

Abstract
The aim of this study was to investigate the significance of specific afferent information during motor learning. Blindfolded subjects stepped over an obstacle on a treadmill while different stimuli (acoustic (ACU), somatosensory (SOM) and light flash (LED)) signalled the approaching obstacle. The effect of the above stimuli was then evaluated and compared to full vision (VIS) locomotion. In the non-visual conditions feedback information about the performance was provided by an acoustic signal.
Using each of the different stimuli for information the level of subject performance was assessed by noting foot clearance and analysing both leg muscle electromyographic activity and movement trajectories during three successive runs. Each of these runs consisted of 100 steps over the obstacle.
The best performance at the onset of the first run was achieved during the VIS condition. When the VIS condition (run 1 + 2) was followed by ACU or SOM information or when the ACU condition (run 1 + 2) was followed by LED, little cross-modal transfer (CMT) occurred, i.e. adaptation in run 3 started again at a low level of performance. In contrast, if adaptation started with ACU stimuli followed by SOM stimuli, almost full CMT occurred. The absolute level of performance achieved after the second or third runs was similar in the VIS and non-VIS conditions.
In conclusion, the course of motor learning depends on specific afferent information, and feedforward control has a special influence on the performance only at the onset of the experiment but not on the rate of learning. The fact that little CMT occurs from visual to non-visual stimuli and from ACU to LED suggests that visual afferent input is processed in a different way to non-visual stimuli.
During everyday living a continuous adaptation of functional movements to actual needs occurs. For example, during locomotion this adaptation is achieved by modulation of the centrally programmed pattern by proprioceptive feedback induced by external stimuli or by feedforward control (see Dietz, 1992, 1997). It is, however, not yet clear which stimuli are most effective for this learning or how far adaptation can be transferred to a new stimulus condition in a corresponding task.
During learning of a new motor task, activation of specific CNS areas leads to long lasting changes of neuronal circuits that are directly involved in the control of this task (Wolpaw & Lee, 1989; Wolpaw et al. 1991; Wolpaw & Carp, 1993; Jenkins et al. 1994; Passingham, 1996; Houk et al. 1996; Jueptner et al. 1997a,b). These changes can also be achieved through an activation of spinal neuronal networks by repetitive stimulation of peripheral afferents (Edgerton et al. 1997a,b; de Leon et al. 1998).
This so-called ‘use-dependent’ motor learning has been described for locomotor movements of healthy subjects (Prokop et al. 1995; Jensen et al. 1998) and of paraplegic patients (Barbeau & Rossignol, 1987; Dietz et al. 1994, 1995), indicating that neuronal circuits within the spinal cord have the ability to learn. In healthy subjects the adaptation to a split-belt treadmill with different speeds was side specific and had to be relearned when slow/fast sides were inverted (Prokop et al. 1995). Consequently, there exists only a restricted bilateral transfer for a newly learned locomotor pattern.
The aim of this study was to investigate whether a newly learned locomotor pattern can be transferred across different stimulus conditions. To our knowledge no information is available about cross-modal transfer (CMT) in motor learning tasks in humans. CMT occurs when the skills acquired during learning of a motor task with specific stimulus information can be transferred to a new stimulus condition (Tran & Delay, 1996). The knowledge about CMT in motor learning might be of great importance for practical purposes, e.g. for sport disciplines and motor rehabilitation.
CMT in motor learning was analysed during repetitive stepping over an obstacle. This task was selected as a typical automatically performed functional movement that requires an interaction between central commands and proprioceptive feedback input to achieve an adaptation to the actual external demands. It was hypothesized that (1) there is a different effectiveness of external stimuli (i.e. visual, acoustic, somatosensory) to achieve an optimal performance and (2) there is a restricted cross-modality, as the information provided by the stimuli uses different pathways.
METHODS
General procedures and recording methods
The experiments were performed with the approval of the local ethical committee and the written informed consent of the volunteers. All experiments conformed with the Declaration of Helsinki.
Thirty healthy subjects (mean age ±s.d., 28.1 ± 4.7 years) walked on a moving treadmill with a speed of 2.5 km h−1. A custom-built ‘obstacle-machine’ was placed next to the treadmill (Fig. 1) in order to study repetitive stepping over an obstacle. The obstacle consisted of a foam-covered stick, 11 cm high. The foam-covered stick was attached to the obstacle machine in such a way that it folded back when the subject touched it. After release the obstacle moved with the same speed as the treadmill. The force signal from a force plate located underneath the treadmill that indicated the right foot fall, i.e. the onset of the stance phase of the right leg, was used as a trigger to start movement of the obstacle. The period of time from the start of movement of the obstacle was chosen such that the right leg had to move over the obstacle during the following swing phase. The anterior-posterior position of the subject on the treadmill was controlled by a metal bar positioned over parallel bars on either side of the treadmill. After some minutes of adaptation, the subjects became familiar with this restriction. At the end of the treadmill the obstacle folded up and moved back to its starting position (Fig. 1). Any acoustic information about the moving treadmill or the obstacle machine was prevented by earphones.
Figure 1. Experimental set-up.
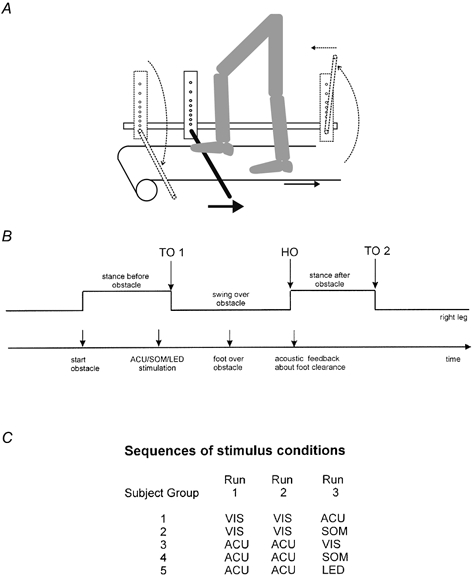
A, subject walking on a treadmill and movement of the obstacle. B, schematic drawing of the timing of all events during one step over the obstacle. C, table of the sequence of stimulus conditions. Abbreviations: TO, toe off; HO, heel on; VIS, visual stimulus; ACU, acoustic stimulus; SOM, somatosensory stimulus; LED, light flash stimulus.
The level of clearance of the subject's foot over the obstacle was assessed by a vertical linear array of eight light-sensitive diodes that were attached to the obstacle machine above the foam-covered stick (the first diode was located 2 cm above the stick, and the distance between each diode was 2 cm, or 3 cm for the upper two diodes, see Fig. 1). Therefore, foot clearance was evaluated by eight discrete sites ranging from 2 to 18 cm above the stick (height, 11 cm). The signal of the lowest activated diode was recorded for each step over the obstacle. The subject received acoustic feedback about the foot clearance over the obstacle according to the activated diode. The feedback signal consisted of either a double-beep (707 and 1400 Hz sinusoidal signal of 600 ms duration) for the lowest diode (optimal clearance) or a single beep (125, 176, 250, 354, 500, 707 and 1000 Hz rectangular signal of 400 ms duration for the second lowest to the highest diode, respectively) for the other seven diodes. Before the experiment started, the volunteers received instruction and were familiarized with this approach.
The 30 volunteers were randomly divided into five groups, each consisting of six subjects. Each group encountered two out of the following four stimulus conditions.
Visual condition (VIS).
The subjects had full visual control, i.e. they could see the start of the obstacle machine and their leg movements.
Acoustic condition (ACU).
Special glasses prevented visual information from the lower visual field, i.e. the obstacle and the legs. In this condition release of the obstacle was indicated by a short acoustic beep (2 kHz sinusoidal signal of 100 ms duration) at 33 % of the subject's step cycle duration (shortly before the end of the right stance phase).
Somatosensory condition (SOM).
Same as the ACU condition. However, the acoustic beep was replaced by a short electrical tibial nerve stimulation at the right medial ankle joint (pulse-train of 5 charge-compensated symmetrical rectangular stimuli, stimulus duration 1 ms, interstimulus interval 5 ms). The stimulus intensity amounted to motor threshold, i.e. a non-noxious sensation.
Light flash condition (LED).
Same as the ACU condition. However, the acoustic beep was replaced by a LED light flash of 100 ms duration. The LED was placed inside the glasses in front of the right eye.
During each run (i.e. one stimulus condition) the subjects had to step 100 times over the obstacle. The time interval between two obstacle steps was randomly varied between 9 and 16 s. Each experiment consisted of three successive runs. Between each run there was a break of 10 min duration. The combinations and order of conditions within the three runs presented to the five groups of subjects were (see Fig. 1): VIS-VIS-ACU, VIS-VIS-SOM, ACU-ACU-VIS, ACU-ACU-SOM and ACU-ACU-LED. Prior to the first run the subjects became accustomed to treadmill walking for 15 min. One experiment lasted around 100 min.
During each run the subjects were asked to move their right foot as close to the obstacle as possible without touching it. The corresponding acoustic feedback consisted of a double-beep acoustic signal indicating the activation of the lowest positioned diode.
EMG recordings were made using surface electrodes from the medial gastrocnemius (GM), anterior tibialis (TA), rectus femoris (RF) and biceps femoris (BF) muscles of the right leg. Ankle (AN), knee (KN) and hip (HI) joint movements of the right leg were monitored using mechanical goniometers fixed at the lateral aspect of each joint. Force plates underneath the left and right treadmill belt were used to record vertical forces exerted by the walking subject.
Data analysis
The general recording technique and the data analysis have been described in detail previously (Dietz et al. 1995; Erni & Colombo, 1998). Briefly, the EMG signals were amplified, bandpass filtered (30-300 Hz), and transferred together with the biomechanical signals to a PC microcomputer system via an analog-to-digital converter. All signals were sampled at 1000 Hz. The EMG signals were rectified. The force signal of the right leg indicating toe off, i.e. before onset of the swing over the obstacle (TO1) was used to trigger all signals. Furthermore, the impact of the right heel after the obstacle (heel on, HO) and the toe off after the following stance phase (TO2) were determined (Fig. 1). From these time points the duration of the swing phase over the obstacle (HO − TO1) and the duration of the whole step over the obstacle (TO2 − TO1) were calculated. For the evaluation of changes in leg muscle EMG activity from the first to the last step over the obstacle within a run, the signal energy (root mean square, RMS) was determined for each step for an interval starting with the earliest TO1 detected and ending with the last TO2 within this run.
For the same interval the variation ratio (VR) for each joint movement signal was calculated to analyse changes in the leg's trajectory over the obstacle within each run. As described recently (Erni & Colombo, 1998), the VR provides a measure of the similarity of several waveforms. Here the VR was calculated between two trajectories: the joint movement trajectory of the actual step and the mean trajectory of the last three steps over the obstacle in this run. For completely reproducible waveforms the VR tends to zero; for dissimilar waveforms the VR tends to one. Therefore, the similarity of the actual, more disturbed trajectory was compared with the adapted one at the end of a run.
For each subject all data of each signal were normalized to the mean in every condition. All variables were logarithmically transformed. Pearson's correlation coefficient, r, was calculated for every condition between the number of steps over the obstacle and all other variables using the normalized and transformed data. Values of r > 0.134 were taken as significant with P < 0.001. Mean correlation coefficients were calculated using Fisher's Z transformation.
The cross-modality effect was determined for each subject by the following calculation. For every pair of consecutive runs the mean value of each parameter recorded (see Table 1) of the last four obstacle steps of the previous run (first or second run) was subtracted from the mean of the first four steps over the obstacle of the current run (second or third run). This difference was divided by the mean of the first four steps over the obstacle of the current (second or third run) and subtracted from 1:
The result of this operation was interpreted as the relative level of performance at the beginning of the current run that was transferred from the previous to the current run, i.e. the amount of cross-modal transfer (CMT).
Table 1.
Correlation coefficients between sequential steps over the obstacle and movement and EMG parameters
| Condition | Height | AN | KN | HI | RF | BF | TA | GM | Step t | Swing t | Mean r |
|---|---|---|---|---|---|---|---|---|---|---|---|
| 1 VIS | −0.315 | −0.525 | −0.499 | −0.524 | −0.347 | −0.338 | −0.332 | −0.208 | 0.179 | 0.089 | −0.29 |
| 2 VIS | 0.017 | −0.245 | −0.132 | −0.198 | −0.123 | −0.106 | 0.008 | −0.036 | 0.135 | 0.069 | −0.06 |
| 3a ACU | −0.117 | −0.455 | −0.383 | −0.443 | −0.226 | −0.25 | −0.36 | −0.362 | −0.302 | −0.38 | −0.33 |
| 3b SOM | −0.183 | −0.416 | −0.243 | −0.209 | −0.197 | −0.283 | −0.149 | −0.083 | −0.3 | −0.38 | −0.25 |
| 1 ACU | −0.285 | −0.489 | −0.519 | −0.54 | −0.316 | −0.449 | −0.303 | −0.314 | −0.23 | −0.188 | −0.37 |
| 2 ACU | −0.087 | −0.233 | −0.205 | −0.18 | −0.092 | −0.147 | −0.153 | −0.212 | −0.126 | −0.178 | −0.16 |
| 3a VIS | −0.109 | −0.31 | −0.262 | −0.224 | −0.202 | −0.2 | −0.284 | −0.212 | 0.082 | 0.056 | −0.17 |
| 3b SOM | 0.044 | 0.012 | −0.116 | −0.114 | −0.107 | −0.167 | 0.111 | −0.117 | −0.084 | −0.077 | −0.06 |
| 3c LED | −0.169 | −0.401 | −0.434 | −0.354 | −0.282 | −0.318 | −0.263 | −0.346 | −0.014 | 0.02 | −0.26 |
Correlations between sequential steps over the obstacle and the foot clearance over the obstacle (height), the variation ratio of the ankle (AN), knee (KN) and hip (HI) angle trajectories, the root mean square of rectus femoris (RF), biceps femoris (BF), tibialis anterior (TA) and gastrocnemius medialis (GM) muscles, the duration of the whole step over the obstacle (Step t) and the duration of the swing phase over the obstacle (Swing t). Conditions: visual (VIS), somatosensory (SOM), acoustic (ACU) and light flash (LED) stimulus condition for the stimulus sequences VIS–VIS followed by SOM or ACU and ACU–ACU followed by VIS, SOM or LED. Correlation coefficients<0.2 are in bold. Negative correlation coefficients indicate a reduction of the value during the repetitive movements over the obstacle.
For all variables the significance of the difference between 1 and the mean of CMT for each subject was calculated using Student's t test. Thus, the level of performance was determined as that which was not transferred from the previous to the current run. The performance of the last four steps over the obstacle of the second VIS (groups 1 and 2) and second ACU (groups 3, 4 and 5) conditions was compared using Student's t test. An ANOVA with a subsequent Scheffe's test was used for comparing the performance of the five groups at the end of the third condition.
A higher level of performance was defined by the following criteria: (1) lower level of foot clearance over the obstacle, (2) smaller VRs of joint movement signals, (3) smaller RMS values for leg muscle activation, (4) shorter steps over the obstacle. Therefore, any improvement in performance concerned a more economical way to overcome the obstacle.
RESULTS
Obstacle hits were rarely observed, probably due to the instruction not to touch the stick. Even if normal vision was not permitted (i.e. in the non-visual conditions) maximally one to two obstacle hits were observed in one subject within one run (i.e. 100 steps over the obstacle). These hits were randomly distributed over the run.
Stimulus combinations starting with VIS
Figure 2 shows a representative individual example of the adapational effect occurring in TA muscle activity when a subject stepped repetitively over the obstacle during three runs with two different stimulus conditions. During the first run (VIS) the TA RMS decreased with a linear correlation coefficient of r = −0.64 in a log-log coordinate system. During the second run (VIS, same stimulus as in the first run) no change in TA RMS occurred (r = −0.11) and, hence, no obvious further adaptation took place. TA RMS amounted to about the same value at the beginning and end of run two as that at the end of run one. However, during the third run, when the stimulus changed to SOM, the TA RMS value was again high during the first few steps over the obstacle. During the following steps this value decreased in a similar way to the first run (r = −0.49). At the end of the third run TA RMS was even smaller than at the end of the second run.
Figure 2. TA EMG activity during successive runs.
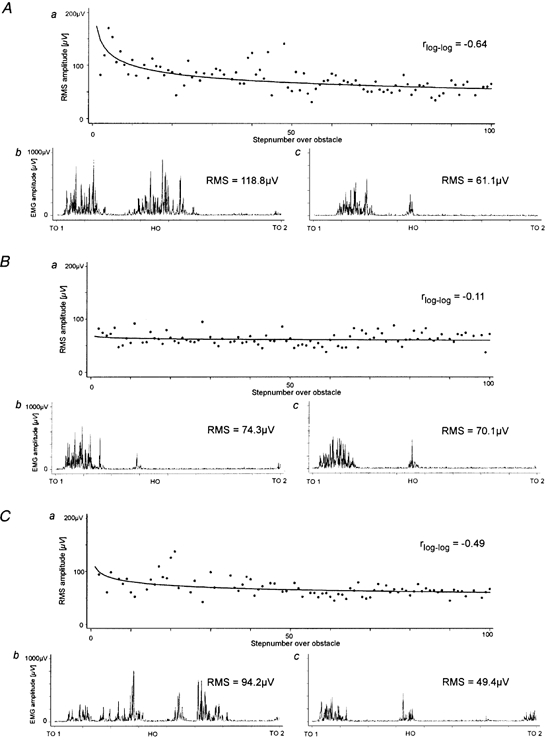
TA EMG activity of one subject during steps over the obstacle during three successive runs with two stimulus conditions: A, VIS; B, VIS; C, SOM. a, course of TA RMS calculated for 100 steps over the obstacle with fitted learning curve (power function); b and c, TA EMG from toe off at the onset of swing over the obstacle to the next toe off during the first (b) and last step over the obstacle (c).
Similar adaptational effects occurred in the leg joint angle trajectories. Figure 3 shows the changes of leg trajectory of one subject within the first run (VIS). During the first run a change from a disturbed to a successively more normal leg trajectory took place. Little further change was seen during the second run. During the third run all three joint angles again showed similar adaptational changes to those during the first run (not shown).
Figure 3. Adaptation of leg movement trajectories.
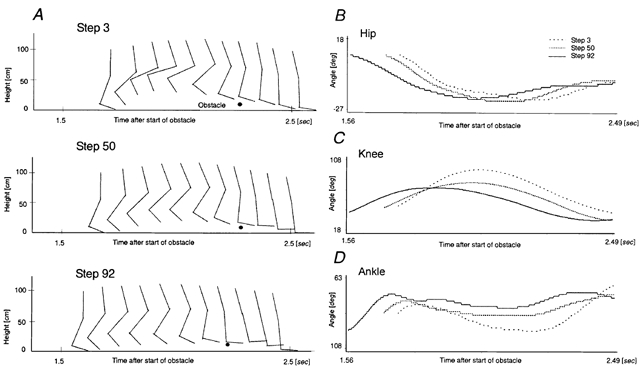
Right leg movement trajectories during stepping over the obstacle within the first run (VIS). Stick diagrams of the right leg while stepping over the obstacle (A), and hip (B), knee (C) and ankle (D) joint movements during step 3, 50 and 92 over the obstacle (i.e. swing phase of the right leg).
Figure 4A and Tables 1 and 2 summarize the slopes of performance for the stimulus combinations starting with VIS. A similar course emerged for almost all variables taken from all subjects measured in this stimulus sequence (VIS-VIS-SOM). Strong adaptational effects were seen during the first run (mean r for all variables together, -0.29), and almost no adaptational effects during the second run with the same stimulus (mean r = −0.06). The gain of performance could be transferred in large part from the end of the first run to the beginning of the second run for most variables (Table 2), i.e. the difference between 1 and the mean relative transfer (0.88) was just below the level of significance (P < 0.05). In the third run (SOM) most variables showed a high correlation with the number of steps over the obstacle (Table 1). The mean correlation for the third run (r = −0.25) was almost the same as for the first run (r = −0.29). The relative CMT from run two (VIS) to run three (SOM) was small (0.59) and significantly different from 1 (P < 0.01).
Figure 4. Slopes of performance for all stimulus conditions.
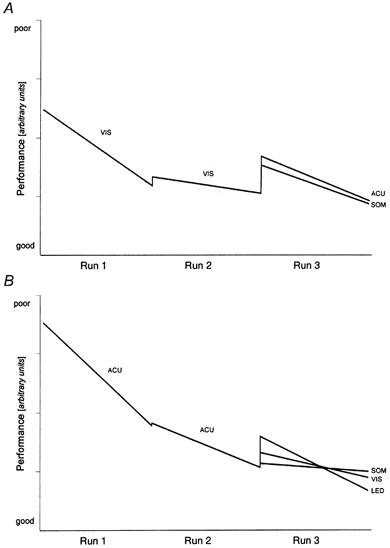
Linearized learning slopes averaged over all variables per condition. The slopes are proportional to the mean correlation coefficients listed in Table 1. The steps between the consecutive runs are proportional to the mean CMT listed in Table 2. A, stimulus sequences VIS-VIS followed by SOM or ACU. B, sequences ACU-ACU followed by VIS, SOM or LED. See Methods for the definition of performance.
Table 2.
Cross-modal transfer of movement and EMG parameters in the different stimulus conditions
| Height | AN | KN | HI | RF | BF | TA | GM | Step t | Swing t | CMT | |
|---|---|---|---|---|---|---|---|---|---|---|---|
| VIS→VIS | 0.86 | 0.76 | 0.84 | 0.61 | 0.87 | 0.93 | 0.94 | 0.98 | 1.02 | 1.00 | 0.88 ± 0.06 |
| ACU→ACU | 0.95 | 0.86 | 0.97 | 0.88 | 1.25 | 0.92 | 0.98 | 0.90 | 1.02 | 1.04 | 0.98 ± 0.11 |
| VIS→ACU | 0.71 | 0.11 | 0.18 | 0.14 | 0.72 | 0.50 | 0.86 | 0.82 | 0.85 | 0.67 | 0.56 ± 0.04 |
| VIS→SOM | 0.36 | 0.15 | 0.16 | 0.23 | 0.76 | 0.50 | 0.96 | 0.86 | 0.99 | 0.96 | 0.59 ± 0.35 |
| ACU→VIS | 0.77 | 0.39 | 0.71 | 0.70 | 0.91 | 0.72 | 0.90 | 0.92 | 1.06 | 0.97 | 0.80 ± 0.08 |
| ACU→SOM | 0.77 | 0.93 | 1.11 | 0.86 | 0.91 | 0.85 | 1.03 | 0.96 | 1.06 | 1.01 | 0.95 ± 0.11 |
| ACU→LED | 0.42 | 0.18 | 0.20 | 0.15 | 0.40 | 0.48 | 0.84 | 0.85 | 0.98 | 0.94 | 0.55 ± 0.2 |
Relative level of transferred performance (cross-modal transfer, CMT; except VIS→VIS and ACU→ACU transfer to the same modality) from the previous to the current condition for the height of the foot over the obstacle (height), the variation ratio (VR) of the ankle (AN), knee (KN) and hip (HI) angle curves, the root mean square of rectus femoris (RF), biceps femoris (BF), tibialis anterior (TA) and gastrocnemius medialis (GM) muscles, the duration of the whole step over the obstacle (Step t) and the duration of the swing phase over the obstacle (Swing t). Conditions as for Table 1. Significant loss of mean CMT (P < 0.05) is printed in bold.
With the stimulus sequence VIS-VIS-ACU similar results were obtained to those during the sequence VIS-VIS-SOM (Fig. 4A, Table 1 and 2). Almost all variables showed a high correlation with the number of steps over the obstacle in the last (i.e. ACU) run. The mean correlation (r = −0.33) was even higher than during the first (VIS) run (r = −0.29) but not different (P 0.05) from the correlation in the SOM condition described above. The relative CMT from VIS to ACU (0.56) was different from 1 (P < 0.05) and about the same as from VIS to SOM.
Stimulus combinations starting with ACU
Figure 4B and Tables 1 and 2 summarize the slopes of performance for the stimulus combinations starting with ACU. The highest correlations between the variables and number of steps, i.e. the strongest adaptational effects, were found when the ACU condition was presented as the first run (stimulus sequences ACU-ACU followed by VIS, SOM or LED). The mean correlation coefficient of r = −0.37 was just not significantly different (P ≤ 0.07) from the VIS condition (r = −0.29). The relative CMT from the first to the second ACU condition was 0.98 and did not differ significantly from 1 (P 0.05; Table 2). The relative CMT from ACU to VIS (0.80) was higher than the transfer from ACU to LED (0.55), VIS to ACU (0.56) and VIS to SOM (0.59), but still significantly different from 1 (P < 0.05; Table 2). In contrast to the second VIS run (Fig. 4A), a significant correlation with the number of steps was still present in the second ACU condition (r = −0.16; Table 1). There was no difference in performance at the end of the second run of ACU and VIS (for all variables: −1.62 < t < 1.72, 10.2 < degrees of freedom < 22, P 0.05).
Figure 5 shows the group changes (group 3) for the foot clearance during the sequence of three runs ACU-ACU-VIS. There was a drop of foot clearance from about 6 to 2 cm during the first run. Little change occurred during the second run. During the third run foot clearance started again at about 6 cm and dropped down to 2 cm.
Figure 5. Foot clearance during successive runs.
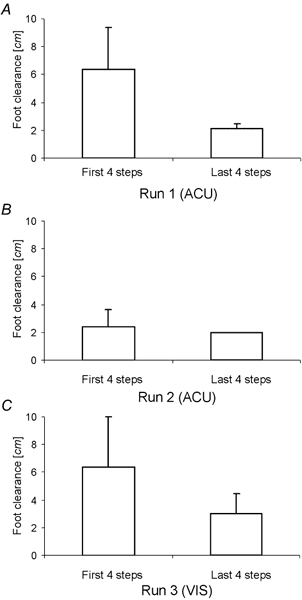
A-C, foot clearance at the beginning and end of stepping over the obstacle in three successive runs (ACU-ACU-VIS). Data are the mean over all subjects (group 3).
Adaptation rate after change of stimulus condition
In all stimulus sequences the stimulus condition was changed during the third run. During the third run of all stimulus sequences, except for the SOM condition of the sequence ACU-ACU-SOM (mean r = −0.06), a significant correlation between most variables and the number of steps was found (Table 1). The correlations were highest for the ACU condition (sequence VIS-VIS-ACU, mean r = −0.33) and lowest for the VIS condition of the sequence ACU-ACU-VIS (mean r = −0.17). Significant differences were found between the mean correlation coefficients of the VIS condition (sequence ACU-ACU-VIS, mean r = −0.17) and the SOM condition of the sequence VIS-VIS-SOM (mean r = −0.33). The mean correlation coefficient of the SOM condition of the sequence ACU-ACU-SOM (mean r = −0.06) was significantly different from all other correlations (Table 1).
A result basically different from those described above was obtained when the SOM condition followed the second ACU condition (ACU-ACU-SOM). A high CMT (0.95, P 0.05, not significantly different from 1) and no correlation were observed between the variables and the number of steps (mean r = −0.06).
The performance at the end of the third run of a stimulus sequence (VIS, SOM, ACU or LED, see Fig. 4) was compared with the performance at the end of the second run (VIS or ACU). A further but not significant improvement in performance was obtained from VIS to SOM (10 %) and from ACU to VIS (1 %). No improvement was found from VIS to ACU (-5 %) or from ACU to SOM (-1 %). A significant improvement in performance was found only from ACU to LED (13 %, P < 0.05).
DISCUSSION
The aim of this study was to find out how far motor learning, here exemplified by stepping over an obstacle, is influenced by afferent input of different modality and how far such learning effects can be transferred from one stimulus to another. The main findings were that, (1) the learning rate depends upon the stimulus modality, (2) the amount of cross-modal transfer (CMT) depends upon the sequence of the different stimuli, and (3) the visual system plays a special role in the control of stepping movements.
Influence of stimulus modality on learning
In everday life the foot clearance over an obstacle is higher than necessary for automatically adopted safety reasons and it is associated with stronger leg muscle activation (Patla et al. 1991).
Most variables recorded showed an improvement of performance (in terms of economy) during repetitive stepping over an obstacle. In line with the literature (Erni & Colombo, 1998), the improvement in performance during the course of learning was reflected by an exponential decrease of leg muscle EMG activity (RMS), leg joint trajectory (VR), foot clearance over the obstacle and swing phase duration. All changes of variables occurring during the different experimental runs reflect a change to a more efficient, less energy-consuming movement. One might argue that the adaptational changes are also due to fatigue. However, this would imply an associated increase of obstacle hits, which was not the case. Furthermore, no subject complained about muscle fatigue after three runs.
With normal vision the minimal time to implement motor commands for obstacle avoidance is one step cycle (Patla, 1997). Here, we found that even during the first steps over an obstacle under non-visual conditions subjects made almost no mistakes.
Initially, the better performance during VIS compared to ACU conditions can be explained easily by the fact that feedforward control was provided during VIS. Nevertheless, it was surprising that after the second run the performance was similar during VIS and ACU, i.e. the learning effect achieved during the first and second runs was greater during ACU than during VIS. Consequently, the rate of learning depended on the stimulus condition and its position in the sequence of runs. During the first run learning was fastest in the ACU condition. One might speculate that this is because in this condition the same afferent pathway was used for the stimulus and the feedback information about foot clearance. The slower learning during VIS in the same run might be because this run started at a better level of performance, which was not improved further in the second run.
In the non-visual conditions the information about foot clearance over the obstacle was provided by the auditory system. This system represents an unusual source for movement feedback information. The necessary information for the control of leg movements is usually provided by the visual system and is implemented in a feedforward manner (Assaillante et al. 1989; Patla & Vickers, 1997). Therefore, it took more time to reach the same level of performance in the non-visual than in the visual conditions.
Cross-modal transfer
The amount of CMT from one stimulus condition to another depended on (1) the sequence of stimuli and (2) the preceding stimulus. Changes from or to visual, i.e. VIS/LED, conditions were followed by a low degree of CMT. In the case of a change from a visual to a non-visual condition the lack of transfer might partly be due to an increased alertness because of the unusual task. Of course, this should not occur the other way around. However, even when feedforward control was provided (VIS) during the third run, a significant part of the performance could not be transferred. We suggest that this is based upon the role of vision during locomotion, i.e. the fact that feedforward information from the visual system is used in everyday life to avoid obstacles during locomotion (Lee & Young, 1986; Patla et al. 1991; Patla, 1997). During voluntary gait modifications, motor cortical neurones become visually triggered for an appropriate performance of obstacle avoidance in cat (Drew, 1993) and man (Schubert et al. 1999). In contrast to the ACU and SOM stimuli, vision (and consequently also LED) represents a well established way for the neuronal control of movement. This might also explain why the drop in performance, i.e. less CMT, was more pronounced from visual to non-visual conditions than vice versa. In the non-visual conditions an unusual motor programme has to be applied; consequently this programme had to be optimized and adapted within the successive steps. Furthermore, the dominant role of the visual system (compared to the other stimuli) during motor learning studied in the present experiments might be attributed to a higher information capacity of the visual system (Wright, 1970), or to an attentional bias towards the visual system (Elliott et al. 1981; Stenberg et al. 1995).
Based on animal experiments (Seraganian & Popova, 1976; Kehoe & Napier, 1991; Tran & Delay, 1996; Reales & Ballesteros, 1999) two other mechanisms were suggested to determine the amount of CMT that also might be at work in our experiments: (1) the more that similar information is shared by the different stimulus modalities the more CMT occurs and (2) more CMT occurs when two stimuli share the same temporal pattern, i.e. stimulus time, duration and frequency.
This supports the observation that when the modality changed from the acoustic to the somatosensory stimulus, full CMT was observed. These two stimuli were presented with a similar pattern at the same time during a step cycle. However, a low CMT also occurred from ACU to LED, although the LED stimulus had the same pattern characteristics as the ACU and SOM stimuli. This special behaviour supports the assumption made above, that the visual pathway plays a special role during the learning task investigated here.
An interesting result for the training of a motor task was that after cross-modal learning a better level of performance was reached when the cross-modal transition was either to or from the VIS condition. Therefore one might conclude that training of a specific movement should be performed by using different stimulus conditions including the change to or from visual information.
Acknowledgments
This work was supported by grants from the Swiss National Science Foundation (no. 31-53526.98). We thank M. Stüssi, G. Colombo and T. Keller for technical assistance and D. Fasset for editorial help.
References
- Assaillante C, Marchand AR, Amblard B. Discrete visual samples may control locomotor equilibrium and foot position in man. Journal of Motor Behavior. 1989;21:72–91. doi: 10.1080/00222895.1989.10735466. [DOI] [PubMed] [Google Scholar]
- Barbeau H, Rossignol S. Recovery of locomotion after chronic spinalization in the adult cat. Brain Research. 1987;412:84–95. doi: 10.1016/0006-8993(87)91442-9. [DOI] [PubMed] [Google Scholar]
- De Leon RD, Hodgson JA, Roy RR, Edgerton VR. Locomotor capacity attributable to step training versus spontaneous recovery after spinalization in adult cats. Journal of Neurophysiology. 1998;79:1329–1340. doi: 10.1152/jn.1998.79.3.1329. [DOI] [PubMed] [Google Scholar]
- Dietz V. Human neuronal control of automatic functional movements: interaction between central programs and afferent input. Physiological Reviews. 1992;72:33–69. doi: 10.1152/physrev.1992.72.1.33. [DOI] [PubMed] [Google Scholar]
- Dietz V. Neurophysiology of gait disorders: present and future applications. Electroencephalography and Clinical Neurophysiology. 1997;103:333–355. doi: 10.1016/s0013-4694(97)00047-7. [DOI] [PubMed] [Google Scholar]
- Dietz V, Colombo G, Jensen L. Locomotor activity in spinal man. Lancet. 1994;344:1260–1263. doi: 10.1016/s0140-6736(94)90751-x. [DOI] [PubMed] [Google Scholar]
- Dietz V, Colombo G, Jensen L, Baumgartner L. Locomotor capacity of spinal cord in paraplegic patients. Annals of Neurology. 1995;37:574–582. doi: 10.1002/ana.410370506. [DOI] [PubMed] [Google Scholar]
- Drew T. Motor cortical activity during voluntary gait modifications in the cat. I. Cells related to forelimbs. Journal of Neurophysiology. 1993;79:179–199. doi: 10.1152/jn.1993.70.1.179. [DOI] [PubMed] [Google Scholar]
- Edgerton VR, De Leon RD, Tillakaratne N, Recktenwald MR, Hodgson JA, Roy RR. Use-dependent plasticity in spinal stepping and standing. Advances in Neurology. 1997a;72:233–247. [PubMed] [Google Scholar]
- Edgerton VR, Roy RR, De Leon R. Does motor learning occur in the spinal cord. Neuroscientist. 1997b;3:287–294. [Google Scholar]
- Erni T, Colombo G. Locomotor training in paraplegic patients: a new approach to assess changes in leg muscle EMG patterns. Electroencephalography and Clinical Neurophysiology. 1998;109:135–139. doi: 10.1016/s0924-980x(98)00005-8. Published erratum appears in Electroencephalography and Clinical Neurophysiology (1998) 109, 385. [DOI] [PubMed] [Google Scholar]
- Houk JC, Buckingham JT, Barto AG. Models of the cerebellum and motor learning. Behavioral and Brain Science. 1996;19:368–383. [Google Scholar]
- Jenkins IH, Brooks DJ, Nixon PD, Frackowiak RS, Passingham RE. Motor sequence learning: a study with positron emission tomography. Journal of Neuroscience. 1994;14:3775–3790. doi: 10.1523/JNEUROSCI.14-06-03775.1994. [DOI] [PMC free article] [PubMed] [Google Scholar]
- Jensen L, Prokop T, Dietz V. Adaptational effects during human split-belt walking: influence of afferent input. Experimental Brain Research. 1998;118:126–130. doi: 10.1007/s002210050262. [DOI] [PubMed] [Google Scholar]
- Jueptner M, Frith CD, Brooks DJ, Frackowiak RS, Passingham RE. Anatomy of motor learning. II. Subcortical structures and learning by trial and error. Journal of Neurophysiology. 1997a;77:1325–1337. doi: 10.1152/jn.1997.77.3.1325. [DOI] [PubMed] [Google Scholar]
- Jueptner M, Stephan KM, Frith CD, Brooks DJ, Frackowiak RS, Passingham RE. Anatomy of motor learning. I. Frontal cortex and attention to action. Journal of Neurophysiology. 1997b;77:1313–1324. doi: 10.1152/jn.1997.77.3.1313. [DOI] [PubMed] [Google Scholar]
- Kehoe EJ, Napier RM. Temporal specificity in cross-modal transfer of the rabbit nictitating membrane response. Journal of Experimental Psychology. 1991;17:26–35. [PubMed] [Google Scholar]
- Lee DN, Young DS. Gearing action to the environment. Experimental Brain Research. 1986;15:217–230. [Google Scholar]
- Passingham RE. Attention to action. Philosophical Transactions of the Royal Society. 1996;351:B1473–1479. doi: 10.1098/rstb.1996.0132. [DOI] [PubMed] [Google Scholar]
- Patla AE. Understanding the roles of vision in the control of human locomotion. Gait and Posture. 1997;5:54–69. [Google Scholar]
- Patla AE, Prentice SD, Robinson C, Neufeld J. Visual control of locomotion: strategies for changing direction and for going over obstacles. Journal of Experimental Psychology: Human Perception and Performance. 1991;17:603–634. doi: 10.1037//0096-1523.17.3.603. [DOI] [PubMed] [Google Scholar]
- Patla AE, Vickers JN. Where and when do we look as we approach and step over an obstacle in the travel path. NeuroReport. 1997;8:3661–3665. doi: 10.1097/00001756-199712010-00002. [DOI] [PubMed] [Google Scholar]
- Reales JM, Ballesteros S. Implicit and explicit memory for visual and haptic objects: Cross-modal priming. Journal of Experimental Psychology. 1999;25:644–663. [Google Scholar]
- Schubert M, Curt A, Colombo G, Berger W, Dietz V. Voluntary control of human gait: Conditioning of magnetically evoked responses in a precision stepping task. Experimental Brain Research. 1999;126:583–588. doi: 10.1007/s002210050767. [DOI] [PubMed] [Google Scholar]
- Seraganian P, Popova YI. Cross modal transfer of a conditional flexion response in dogs. Pavlovian Journal of Biological Science. 1976;11:162–174. doi: 10.1007/BF03000293. [DOI] [PubMed] [Google Scholar]
- Stenberg G, Radeborg K, Hedman LR. The picture superiority effect in a cross-modality recognition task. Memory and Cognition. 1995;23:425–441. doi: 10.3758/bf03197244. [DOI] [PubMed] [Google Scholar]
- Tran TD, Delay ER. Comparison of compound and cross-modal training on postoperative visual relearning of visual decorticate rats. Behavioural Brain Research. 1996;79:137–143. doi: 10.1016/0166-4328(96)00008-3. [DOI] [PubMed] [Google Scholar]
- Wolpaw JR, Carp JS. Adaptive plasticity in spinal cord. Advances in Neurology. 1993;59:163–173. [PubMed] [Google Scholar]
- Wolpaw JR, Lee CL. Memory traces in primate spinal cord produced by operant conditioning of H-reflex. Journal of Neurophysiology. 1989;61:563–572. doi: 10.1152/jn.1989.61.3.563. [DOI] [PubMed] [Google Scholar]
- Wolpaw JR, Lee CL, Carp JS. Operantly conditioned plasticity in spinal cord. Annals of the New York Academy of Sciences. 1991;627:338–348. doi: 10.1111/j.1749-6632.1991.tb25936.x. [DOI] [PubMed] [Google Scholar]
- Wright J M V. Cross-modal transfer and sensory equivalence. A review. Scandinavian Journal of Psychology. 1970;11:21–30. doi: 10.1111/j.1467-9450.1970.tb00713.x. [DOI] [PubMed] [Google Scholar]