

Abstract
Single fibres from the lumbrical muscles of the cane toad (Bufo marinus) were incubated in fluo-5N AM for 2 h at 35 °C in order to load the indicator into the sarcoplasmic reticulum. Fluo-5N is a low-affinity calcium indicator (KCa 90 μm). Successful sarcoplasmic reticulum (SR) loading was indicated by a fluorescence signal that declined during contraction.
Confocal microscopy showed that the dye loaded principally in lines perpendicular to the long axis of the fibre that repeated each sarcomere. This is consistent with much of the dye residing in the SR.
To establish the site of loading, fibres were exposed to 30 mm caffeine in the presence of 20 μm 2,5-di(tert-butyl)1,4-hydroquinone (TBQ, an SR pump inhibitor) which should release most Ca2+ from the SR; this procedure reduced the fluorescence to 46 ± 4 % of the control value. To determine how much indicator was in the myoplasm, fibres were exposed to 100 μg ml−1 saponin which permeabilizes the surface membrane; saponin treatment reduced the fluorescence to 51 ± 2 % of the control value.
During maximally activated tetani (100 Hz stimulation rate, 22 °C) the component of signal from the SR declined by 33 ± 4 %. During relaxation the SR signal recovered in two phases with time constants of 0.38 ± 0.14 s and 10.1 ± 1.7 s. Partially activated tetani (30 Hz stimulation rate) showed a smaller SR signal. Application of the SR Ca2+ pump inhibitor TBQ slowed the rate of recovery of the SR signal.
Muscle fatigue was produced by repeated short tetani until tension was reduced to 50 %. The SR signal during the periods between tetani declined steadily and the SR Ca2+ signal was eventually reduced to 71 ± 8 % of the control signal. This signal recovered in two phases when the muscle was rested. An initial phase had a time constant of 1.7 ± 0.2 s so that by 20 s of recovery the SR Ca2+ signal was 86 ± 7 % of control; the second phase was slower and by 5 min the SR Ca2+ signal was back to control values (98 ± 5 % control). In addition the magnitude of the SR signal decline associated with each tetanus (Δ[Ca2+]SR) declined monotonically throughout fatigue and returned to control after 5 min recovery.
This approach can monitor the SR Ca2+ concentration in normally functioning muscle fibres with good time resolution. The method confirms other approaches that show that the free Ca2+ available for release in the SR declines during fatigue. This reduction in [Ca2+]SR will contribute to the failure of Ca2+ delivery to the myofilaments which is an important cause of muscle fatigue.
Contraction of muscle occurs when Ca2+ is released from storage within the sarcoplasmic reticulum (SR) and diffuses into the myoplasm where it binds to troponin. Understanding of these processes in skeletal muscle has been greatly facilitated by measurements of the free calcium concentration in the myoplasm ([Ca2+]i) (Blinks et al. 1978; Klein et al. 1991; Westerblad & Allen, 1993). However, there is currently no satisfactory method to measure the free calcium in the SR ([Ca2+]SR) and correspondingly little is known about the processes which determine the amount of Ca2+ stored in the SR.
A number of experimental approaches have been devised which have contributed to the current understanding of Ca2+ movements in and out of the SR in muscle. Somlyo et al. (1981) developed the electron micro-probe analysis that measures total calcium and other ions in the SR and other regions of the cell. Their study identified relatively large amounts of Ca2+ in the myoplasm after a tetanus which recovered slowly and probably reflects Ca2+ bound to parvalbumin. This method has a high spatial resolution but the practical temporal resolution is limited by the need to destroy one fibre for each time point. In skinned fibres caffeine stimulates release of Ca2+ from the SR and allows the total Ca2+ in the SR after various loading protocols to be determined (Fryer & Stephenson, 1996).
In intact fibres SR Ca2+ content can also be estimated using agents such as caffeine which release all or most of the SR Ca2+ into the myoplasm. If a suitable [Ca2+]i indicator is present in the myoplasm, then the rise of [Ca2+]i in myoplasm (multiplied by the myoplasmic Ca2+ buffering) provides an estimate of the Ca2+ stored and available for release by the SR. This method has been widely exploited in cardiac muscle in which caffeine can be repeatedly applied to estimated SR Ca2+ content under different conditions (Callewaert et al. 1989). In skeletal muscle there are two difficulties with this approach. In mammalian muscle the SR is relatively insensitive to caffeine and even high concentrations of caffeine do not release all the SR Ca2+ (Balnave & Allen, 1998). Amphibian muscle is more sensitive to caffeine and will release large amounts of Ca2+ from the SR but fibres are often damaged by this procedure. However, we recently showed that if the caffeine was washed away rapidly, the fibre was undamaged and caffeine could be applied repeatedly (Kabbara & Allen, 1999a). We subsequently used this approach to show that the rapidly releasable Ca2+ in the SR declined in fatigue and returned to control levels during recovery (Kabbara & Allen, 1999b). However, the Ca2+ buffer power is not known with accuracy in skeletal muscle, nor is it known whether it changes during fatigue. A further disadvantage of this technique is that 20 min was needed following each caffeine exposure for the fibre to recover.
In a variety of other cell types it has proved possible to continuously estimate SR or endoplasmic reticulum (ER) [Ca2+] using low-affinity Ca2+ indicators. Chen et al. (1996) used a fluorine-tagged Ca2+ indicator based on BAPTA (KCa 65 μm) which has fluorine resonances visible in the F-NMR spectrum. When loaded into the rabbit heart, resonances representing the time averaged [Ca2+]i (600 nm) and [Ca2+]SR (1.5 mm) were present. Golovina & Blaustein (1997) used furaptra (KCa 54 μm) which, when loaded into cultured smooth muscle cells or neurons, allowed the ER to be identified. The ratio signal suggested that [Ca2+]ER was around 100 μm and could be changed by agents known to affect ER Ca2+ release or uptake. The common feature of these approaches (for review see Meldolesi & Pozzan, 1998) are (i) use of a low-affinity Ca2+ indicator so that it is not saturated by the [Ca2+]SR, (ii) loading with the AM ester so that the indicator can enter both the myoplasm and intracellular organelles and (iii) loading for long periods of time at high temperature which seems to allow significant hydrolysis in organelles and may also allow leakage of indicator out of the myoplasm.
In the present study we have applied this approach to single skeletal muscle fibres. We used the low-affinity indicator fluo-5N (KCa 90 μm) and incubated the muscle fibre with the AM ester for 2 h at 35 oC. Here we present evidence that the fluorescence signal from the indicator comes largely from the SR and monitors the [Ca2+]SR effectively. We use this method to confirm that the [Ca2+]SR declines during fatigue and returns towards normal during recovery from fatigue.
METHODS
Single fibre dissection and mounting
Adult cane toads (Bufo marinus) were killed by a blow to the head and double pithed. These experiments were approved by the Animal Ethical Committee of the University of Sydney. Single muscle fibres were dissected from any of the lumbrical muscles (III-V). The fibres were mounted in a chamber (volume 0.2 ml) which allowed simultaneous measurements of isometric tension and fluorescence. Standard tetani were 500 ms in duration and utilized 0.5 ms current pulses (1.2 × threshold) at 100 Hz between two platinum plate electrodes on either side of the fibre. Fibres were superfused at 3 ml min−1 with a Ringer solution containing (mm): NaCl, 115; KCl, 2.5; CaCl, 1.8; sodium phosphate buffer, 3; pH 7.3 (22 °C).
The general features of the methods are similar to recent studies from this laboratory (Kabbara & Allen, 1999a, b). Tension was measured with a Sensonor force transducer (Horten, Norway) and converted to kiloPascals (kPa) by dividing by the cross-sectional area. Muscle fatigue was produced by a protocol of tetani at 4 s intervals for 2 min, 3 s intervals for 2 min, 2.5 s intervals for 2 min and 2 s intervals for 2 min. Stimulation was stopped when tension was reduced to 50 % of control. Only fibres which required more than 6 min to fatigue are considered in this study (Kabbara et al. 2000).
Fluorescence measurements
After dissection single fibres were incubated for 2 h at 35 °C in a small volume (500 μl) of Ringer solution containing 10 μm fluo-5N AM and 0.05 % Pluronic detergent (both agents from Molecular Probes, OR, USA). The fluo-5N AM was prepared as a 2 mm stock solution in dimethylsulphoxide (DMSO) while the Pluronic detergent was a 5 % (by weight) stock solution in DMSO. Aliquots of these stock solutions were added to the Ringer solution and shaken vigorously to force the lipid-soluble fluo-5N AM into small micelles. After 2 h incubation in the fluo-5N AM solution, this was replaced by Ringer solution for a further 1.5 h at 35 °C to allow complete hydrolysis; throughout the loading and hydrolysis periods a water-saturated region was maintained above the muscle chamber to prevent evaporation. At the end of this 3.5 h period fibres were transferred to the muscle chamber and Ringer solution perfusion at room temperature started. Fibre survival, judged by typical time course and amplitude of tetanic force after loading, was > 80 % and the fluorescence signal provided an adequate signal-to-noise ratio. We did not systematically examine the effects of temperature on loading but loading at 30 °C did not produce the predominately store-dependent signals shown in this paper.
Most fibres were studied using spatially averaged fluorescence signals with the muscle bath on the stage of an inverted microscope in epifluorescence mode (for diagram see Lee et al. 1991). These fibres were illuminated with 490 ± 5 nm light from a 100 W xenon lamp whose intensity was reduced 10-fold with a neutral density filter. This light was focused on a region of the fibre with a × 20 NA 0.75 objective. A 510 nm long pass dichroic separated the incoming illuminating light from the fluorescence signal generated by the fluo-5N in the fibre. Fibre fluorescence was measured with a photomultiplier tube with a 530 ± 5 nm interference filter at its photocathode. Background fluorescence (after the fibre had been removed from the field of view) was 20-40 % and has been subtracted from all records. Fibres were displayed on a monitor continuously using a video camera and long wavelength light in order to monitor possible movement artifacts. Light signals were routinely filtered with a low pass 30 Hz filter.
Confocal experiments
Two fibres were studied with a Leica DMIRB confocal microscope to determine the distribution of fluo-5N fluorescence. Loaded fibres were placed, unrestrained, on the surface of a chamber whose base was a coverslip. The fibres were examined with a × 63 NA 1.2 water-immersion objective using 488 nm illumination line and recording wavelengths > 530 nm.
Preliminary observations
In preliminary experiments we varied the loading conditions until we observed fluorescence falling during tetani suggesting that the dominant Ca2+ signal was coming from the SR. Fluo-5N is a single wavelength excitation and emission indicator therefore movement artifacts can be superimposed on the Ca2+-dependent signal. In some fibres which showed little movement there was no obvious movement artifact. In fibres, which moved extensively during a tetanus, the fluorescence often increased during a tetanus presumably because internal shortening increased the fraction of the fibre in the measurement window. Stretching the fibre could usually minimize this problem. In addition the fluorescence signal tended to decline throughout the experiment. This decline was analysed in two components: (1) bleaching, defined as the rate of decline of fluorescence when the fluorescence excitation shutter was open and the fibre was illuminated. This amounted to 3.8 ± 1.3 % min−1(n = 4). This component was much larger if the neutral density filter was removed. To minimize this component the fluorescence shutter was closed except during measurements which were kept as brief as possible; and (2) leakage, defined as the rate of decline of signal measured over 5 min using very short shutter openings at the beginning and end. This amounted to 0.33 ± 0.07 % min−1(n = 7).
Statistics
All data are presented as means ± standard error (s.e.m.) with the number of muscle fibres examined as n. All the results presented were statistically significant at P < 0.05 using Student's t test or one-way ANOVA.
RESULTS
Confocal images of fluo-5N-loaded toad skeletal muscle fibres
A key issue is to determine the location of the fluo-5N fluorescence in the fibre after the loading procedure. Figure 1A is a confocal image of an intact toad skeletal muscle fibre after loading. At low magnification the distribution of fluorescence longitudinally and radially appeared uniform. Higher magnification revealed alternating lines of bright (red is the highest intensity fluorescence and yellow intermediate intensity) and dark (blue) regions perpendicular to the long axis of the fibre. Fluo-5N is virtually non-fluorescent at low [Ca2+]i and has KCa of 90 μm (Molecular Probes Catalogue) so the bright regions represent areas where fluo-5N is located and the [Ca2+] is high. Figure 1B is plot of fluorescence intensity along the long axis of the fibre. Note the periodic peaks of fluorescence (24 arbitrary fluorescence units or a.u.) occuring every 2 μm, similar to the sarcomere spacing. This is consistent with fluo-5N being located in the terminal cisternae of the junctional SR where the [Ca2+]SR is thought to be ≈1 mm (Somlyo et al. 1981). At the minimum intensity between the large spikes there is often a much smaller subsidiary spike which appears to coincide with the middle of the sarcomere where the SR exhibits a more complex branching structure (see EM reconstructions such as Peachey, 1965). Figure 1C is a plot of fluorescence intensity across the fibre. The background level is low (≈2 a.u.) and across the fibre the fluorescence is reasonably uniform (≈15 a.u.) which represents the mean magnitude of the spikes (24 a.u.) and troughs (7 a.u.) observed in panel B. Superimposed on the steady level are many (≈30) small oscillations of amplitude 2-4 a.u., possibly reflecting the myofibrils which are roughly 1 μm in diameter structure (Balnave et al. 1997)
Figure 1. Distribution of fluo-5N fluorescence in single intact toad skeletal muscle fibres.
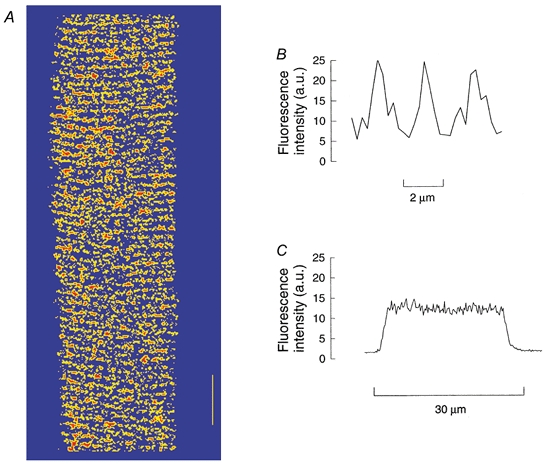
The fibre was loaded with fluo-5N AM as described in the Methods. A, confocal image of section of a single fibre. Regions of high, medium and low fluorescence are coloured red, yellow and blue, respectively. The vertical bar represents 10 μm. B, line plot of fluo-5N fluorescence intensity (arbitrary units, a.u.) of a small (7 μm) region along the fibre. C, line plot of fluo-5N fluorescence intensity (a.u.) across the fibre.
The contribution of the SR Ca2+ to total fibre fluorescence
The total fluorescence coming from the muscle fibre may originate from fluo-5N in various compartments such as the myoplasm, the mitochondria, the SR and the nucleus or from fluo-5N bound to structures such as membranes or proteins. In order to estimate the percentage of total fluorescence originating from Ca2+ within the SR, we depleted the SR Ca2+ store by rapid application of caffeine (30 mm). To further enhance SR emptying by inhibiting SR reuptake, we applied a high concentration of the SR Ca2+ pump inhibitor, 2,5-di(tert-butyl)1,4-hydroquinone (TBQ; 20 μm), 1 min before caffeine application. Figure 2 shows a representative experiment. Note that caffeine causes a large contracture and that the fibre fluorescence falls over 10 s to about 35 % of the initial level; on removal of caffeine, tension and fluorescence recover slowly. In such an experiment myoplasmic [Ca2+]i rises to 3-4 μm (Kabbara & Allen, 1999a) so that there would be a small increase in fluorescence of fluo-5N situated in the myoplasm but clearly the dominant effect is the fall in fluorescence presumably caused by the fall in [Ca2+]SR. Thus, for this particular fibre at least 100 − 35 = 65 % of the total fibre fluorescence was coming from the SR Ca2+ store. In seven fibres fibre fluorescence fell to 46 ± 4 % of the initial value in the presence of 30 mm caffeine and TBQ. When 30 mm caffeine or 2 mm 4-chloro-m-cresol (4-CmC, another SR Ca2+ channel opener) were used alone, the total fluorescence was reduced to 53 ± 3 %(n = 10) and 58 ± 4 %(n = 5), respectively. These are not significantly different (P = 0.11, one-way ANOVA) suggesting that it is not necessary to block the SR Ca2+ pump to completely deplete the SR of Ca2+ with caffeine or 4-CmC.
Figure 2. Effect of SR Ca2+ depletion on fibre fluorescence.
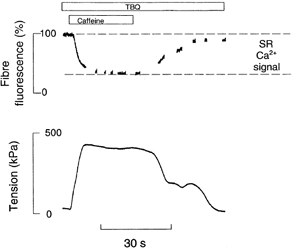
Upper panel shows fibre fluorescence (% initial level) and lower panel shows isometric tension of a single intact toad skeletal muscle fibre loaded with fluo-5N AM. The fibre was exposed to 20 μm TBQ for 60 s and then 30 mm caffeine was applied as indicated by the bars. The fluorescence between the dashed lines represents the total SR Ca2+ signal.
In other experiments saponin, which preferentially permeabilizes the surface membrane compared with the SR (Endo & Iino, 1980), was used to examine the contribution of the myoplasmic fluo-5N to fibre fluorescence. Figure 3 is a representative experiment in which 100 μg ml−1 saponin was added to the Ringer solution as indicated by the bar. Immediately after application of saponin fibre fluorescence often showed a transient increase (not shown) presumably because on permeabilization Ca2+ enters the fibre and excites myoplasmic fluo-5N. Within 20-30 s all fibres showed a substantial reduction of fluorescence to a steady level which averaged 51 ± 2 %(n = 6) of the initial value. This result suggests that the 49 % of fluorescence lost represents fluo-5N liberated from the myoplasm and the remaining 51 % represents fluo-5N located in the SR. To determine whether fluo-5N in the SR was saturated with Ca2+ under the present conditions 1 mm EGTA (0 Ca2+) was applied after permeabilization with saponin and the fluorescence signal fell slowly by a further 10 % i.e. to 41 % of the initial level (Fig. 3). Subsequently 20 mm Ca2+ was added and fibre fluorescence increased markedly to a level which was 125 % higher than the steady level after saponin application. When EGTA was reapplied, the fluorescence signal declined again. Similar results have been observed in six experiments. The most likely interpretation of this experiment is that the fluorescence in saponin-treated fibres arises from the fluo-5N in the SR and that, despite the nominal absence of ATP, the leak and SR Ca2+ pump still operate to some extent and allow modification of the [Ca2+]SR. This is an important observation because it suggests that the fluo-5N in the SR is far from saturation and that the component of fluorescence from the SR is reasonably linearly related to [Ca2+]SR.
Figure 3. Effects of saponin and high [Ca2+] on fibre fluorescence.
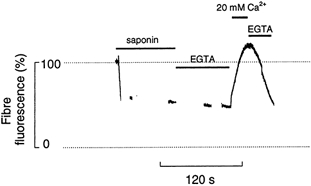
Fibre fluorescence signal (% initial level) of a single intact toad skeletal muscle fibre loaded with fluo-5N AM, when the cell membrane was disrupted with 100 μg ml−1 saponin in Ringer solution. Note the large fall in fibre fluorescence after the treatment with saponin. EGTA (1 mm) was then applied in Hepes-buffered salt solution with no added Ca2+. When the signal became steady, 20 mm Ca2+ was added to this solution; note the large rise in the fluorescence. Finally the EGTA solution was reapplied as indicated by the bar and caused a fall in fibre fluorescence.
Based on the results with caffeine and TBQ, we assume for the remainder of the paper that 100 − 46 = 54 % of fibre fluorescence represents the SR Ca2+ signal and the remaining results and figures are discussed as percentages of the SR Ca2+ signal. This is a useful approximation that is considered further in the Discussion.
SR Ca2+ signal during a tetanus
This study attempts to monitor continuously SR Ca2+ levels in functioning skeletal muscle fibres. Figure 4 is a composite figure showing the SR Ca2+ signal and tension recorded simultaneously from one fibre during a 100 Hz tetanus of 0.5 s duration (panels B i and C). For comparison the [Ca2+]i record from another toad fibre loaded with indo-1 but otherwise under identical conditions is included (panel A). During a tetanus, there was a rapid fall of the SR Ca2+ signal (Δ[Ca2+]SR signal) by about 40 % of the SR Ca2+ signal and the expected increase in [Ca2+]i and tension. In six experiments the mean fall was 33 ± 4 % of the SR Ca2+ signal. Note that although tension returned to resting level soon after the tetanus, the SR Ca2+ signal and [Ca2+]i signals show two distinct phases in their recovery to the pre-tetanus levels. It is well known that the recovery of (myoplasmic) [Ca2+]i after a tetanus has fast and slow components (Klein et al. 1991; Westerblad & Allen, 1993). Here we show that the SR Ca2+ signal also recovers with two components. Figure 4B i (4 s on time bar) shows that at the end of the tetanus there is initially a rapid partial recovery of about half of the signal; Fig. 4B ii (30 s on time bar) shows another experiment on a much slower time base showing the second, slower component to recovery. The shutter was opened briefly three times during the slow phase and the continuous line shows a single exponential fitted to this phase. In eight fibres the complete SR Ca2+ recovery was fitted with a two component exponential; the fast component had a time constant of 0.38 ± 0.14 s and represented 62 ± 2 % of the total signal. The slower component had a time constant of 10.1 ± 1.7 s and represented 38 ± 2 % of the tetanic signal.
Figure 4. Composite figure showing various Ca2+ signals during a tetanus.
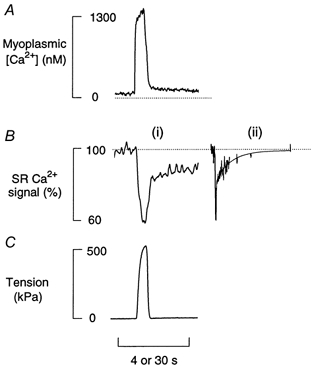
A shows myoplasmic [Ca2+] from a fibre loaded with indo-1. B i and C show the SR Ca2+ signal and isometric tension during a 0.5 s 100 Hz tetanus (simultaneously recorded from another fibre). The SR Ca2+ signal is shown as the percentage of total SR Ca2+ signal. B ii shows the SR Ca2+ signal on a slower time base (30 s on time bar) from a third fibre.
It is clear from Fig. 4A that the time course of the two phases of the recovery of [Ca2+]i are roughly similar to the two phases of recovery of [Ca2+]SR but that the amplitude of the slower phase of myoplasmic [Ca2+]i is much smaller than the amplitude of the slow phase of [Ca2+]SR recovery. This was confirmed by fitting two exponentials in the same way to the [Ca2+]i signal measured with indo-1 under similar circumstances (n = 5). The fast phase had a time constant of 0.094 ± 0.018 s and was 93 ± 4 % of the recovery while the slow phase had a time constant of 9.2 ± 2.7 s and was 7 ± 4 % of the signal.
In order to be confident that the fluo-5N signal was arising from the SR we examined a number of simple situations in which the changes in SR Ca2+ were predictable. Specifically we examined the effects of changing the frequency of stimulation, the duration of a tetanus and the effect of the SR Ca2+ pump inhibitor TBQ (Westerblad & Allen, 1994).
Figure 5A shows the effect of changing the stimulation frequency on the SR Ca2+ signal and tension. The continuous lines in the figure represent responses to a 100 Hz tetanus (0.5 s duration), whereas the dashed lines are responses to a 30 Hz (0.5 s duration). Note that at 100 Hz the magnitude of the Δ[Ca2+]SR signal was 40 % total SR Ca2+ signal. At 30 Hz stimulation frequency the Δ[Ca2+]SR signal was only 25 % of control and the developed tension was also smaller. In four fibres, the mean amplitude of the Δ[Ca2+]SR signal at 30 Hz was 72 ± 6 % of that at 100 Hz and mean force at 30 Hz tetanus was 74 ± 4 % of that at 100 Hz.
Figure 5. Effects of stimulation frequency, stimulation duration and TBQ on SR Ca2+ signal and tension.
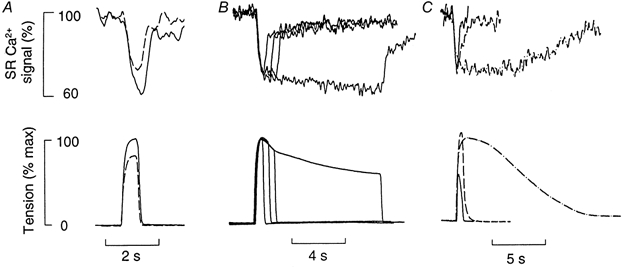
A, effect of stimulation frequency. The fibre was stimulated either at 100 Hz (continuous line) or at 30 Hz (dashed line) with a 0.5 s duration. B, effect of tetanus duration. The fibre was stimulated at 100 Hz for 0.5, 1.0, 1, 1.5 and 8 s durations. C, effect of TBQ. The fibre was given a 100 Hz (0.5 s) tetanus in the absence of TBQ (continuous line), in the presence of 1 μm TBQ (dashed line) and in the presence of 10 μm TBQ (dotted and dashed line). The SR Ca2+ signal is shown as the percentage of total SR Ca2+ signal.
Figure 5B shows the effects of changing tetanus duration (0.5-8 s) on SR Ca2+ and tension signals. Note that for all tetanus durations the initial Δ[Ca2+]SR signal was similar in magnitude. However, in the longest tetanus there was a further monotonic decline in the SR Ca2+ signal. This has been observed with eight fibres and is further confirmation that not all Ca2+ is released from the SR in a short tetanus.
Figure 5C shows the effects of 1 and 10 μm TBQ on SR Ca2+ signal and tension. The continuous lines are control records, the dashed lines show 1 μm TBQ and the dotted and dashed lines show 10 μm TBQ. The most striking feature is the great prolongation of the recovery of [Ca2+]SR and the loss of the fast phase of recovery at the highest TBQ concentration (10 μm). In five fibres in which the effect of 1 μm TBQ was examined the Δ[Ca2+]SR signal was 130 ± 12 % of the control. The magnitude of the peak tension in the presence of TBQ was 113 ± 6 % of control. The rapid component of the SR Ca2+ recovery was lost and the half-time for the decay of the SR Ca2+ signal increased by 194 ± 32 %. Likewise the half-time of the recovery of tension was prolonged to 172 ± 12 % of control. All these data are significantly different to control except for the peak tension data.
SR Ca2+ during fatiguing stimulation
We have previously estimated the rapidly releasable SR Ca2+ indirectly during fatigue by using Ca2+-releasing agents and shown a reduction in rapidly releasable Ca2+ to 46 ± 6 % (Kabbara & Allen, 1999b). This method, however, did not allow the time course of changes in SR Ca2+ to be determined. Therefore, it was of interest in the present study to measure the SR Ca2+ directly at various times during fatigue. Figure 6a is a representative example showing selected records of the SR Ca2+ signal and of tension during a long (8 min) fatiguing stimulation and the following recovery. At the onset of stimulation (1st set of records) the amplitude of tetanic fall of the SR Ca2+ signal (Δ[Ca2+]SR) and amplitude of tetanic tension did not change appreciably over the three tetani examined. However, the resting SR Ca2+ signal had only recovered to 80 % at the time of the second tetanus and showed a small additional decline after each subsequent tetanus. In the middle of fatigue (2nd set of records) the Δ[Ca2+]SR signal was reduced to about 60 % of control while the resting [Ca2+]SR was reduced to 65 %. At the end of fatigue (3rd set of records), when tension had fallen to 50 %, the Δ[Ca2+]SR signal was reduced to 40 %, whereas the resting [Ca2+]SR was reduced to 60 %. Note the disappearance of the fast component of recovery of the SR Ca2+ signal following tetani towards the end of fatigue. At the end of fatigue the fibre was allowed to rest for 5 min. The last set of records shows the recovery SR Ca2+ and tension. Note that the Δ[Ca2+]SR, the steady SR Ca2+ signal and tension had all recovered to close to control levels by this time.
Figure 6. Effects of fatiguing stimulation on SR Ca2+ signal.
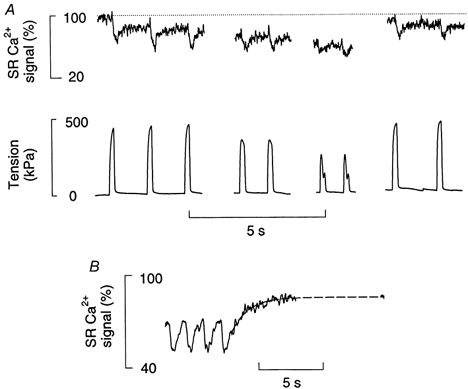
A, the fibre loaded with fluo-5N underwent a fatiguing protocol until tension fell to 50 %. The 1st, 2nd and 3rd sets of records were obtained at the start, mid-point and end of the fatigue protocol. The fibre was then allowed to recover for 3 min (last set of records). The SR Ca2+ signal shown in the upper part is shown as the percentage of total SR Ca2+ signal. The dashed line shows the initial resting level. B, SR Ca2+ signal from another fibre showing the final period of fatiguing stimulation and the first 15 s of recovery. The dashed line shows an exponential curve fitted to the first 15 s of recovery.
Figure 6B examines in more detail the time course of recovery of [Ca2+]SR signal following a fatigue protocol. As commented above the fastest component of recovery following a tetanus is no longer apparent in the fatigued muscle; instead there is an exponential recovery to an intermediate, near-stable level after 10-20 s. This phase had a time constant of 1.7 ± 0.2 s (n = 3). The average magitude of these two phases is shown in Fig. 7 and each component represented about half of the recovery.
Figure 7. Average data of SR Ca2+ signals and tension during fatigue and recovery.
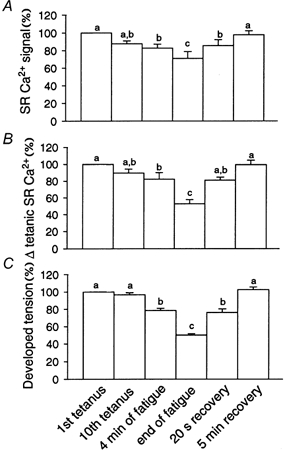
Each column is the mean ±s.e.m. (n = 8). For each panel the bars show data for the 1st tetanus (expressed as 100 %), the 10th tetanus, 4 min of fatigue, the end of fatigue, 20 s recovery and 5 min recovery. A shows the resting SR Ca2+ signal (measured before the tetanus and expressed as a percentage of the total SR Ca2+ signal); B shows the change in SR Ca2+ signal during a tetanus; C shows developed tension. a, not signficantly different to control; b, not significantly different to the 4 min point; c, not significantly different to the end of fatigue. All other comparisons were significantly different (P < 0.05 on one way ANOVA).
Collected data for (8) fatigue experiments are analysed in Fig. 7 which shows the means ±s.e.m. for the SR Ca2+ signals during fatigue and recovery. These data have been corrected for both bleaching and leakage using the data given in the Methods. Note that when the tension was reduced to 50 %, the steady SR Ca2+ signal (between tetani) was reduced to 71 ± 8 % while the amplitude of the tetanic SR Ca2+ release was reduced to 53 ± 5 %.
DISCUSSION
The ability to measure [Ca2+]SR quantitatively and continuously during normal function would make a valuable addition to our understanding of excitation- contraction coupling. The approach and results in the present study make considerable progress in this direction. Fluo-5N AM loads into the fibres that continue to function normally. Probably the fact that Bufo marinus is a tropical toad explains the fact that the fibres survive 3.5 h at 35 °C. There are a number of uncertainties that limit the use of the present method. These include the distribution of fluo-5N and the interpretation of the fluorescence signals that are discussed below. Three other practical difficulties that limit the value of the method are (i) movement artifacts, (ii) bleaching and (iii) leakage of dye from the preparation. All these issues could potentially be improved by use of a ratiometric dye. Mag-fura (furaptra) (KCa 54 μm) is a possibility though the fact that it is more sensitive to Ca2+ than fluo-5N and its sensitivity to Mg2+ are disadvantages for the present purpose (Golovina & Blaustein, 1997).
Distribution of fluo-5N
It is clear that a substantial amount of the fluo-5N is located in the SR based on the fall in fluorescence during a tetanus and caffeine exposure. Furthermore the confocal image is consistent with SR loading though does not exclude a substantial myoplasmic component. However, quantitative analysis is not straight forward for the present experiments. These issues are best explored by some simple calculations. Assume that the fractional volume of SR is 9 % (Mobley & Eisenberg, 1975) and the myoplasmic volume is 58 % (Godt & Maughan, 1988) and assume that the concentration of fluo-5N is equal in both compartments. Assume further that [Ca2+]SR at rest is 1000 μm (Somlyo et al. 1981) while that in the myoplasm is 0.1 μm (Kabbara & Allen, 1999a). Finally assume that the fractional fluorescence of fluo-5N is [Ca2+]/(KCa+[Ca2+]) where KCa is 90 μm. The fluorescence from each compartment is proportional to (% volume of the compartment × the concentration of indicator in the compartment × the fractional fluorescence of the indicator). On this basis the fluorescence from the myoplasm would be 58 × 1 × 0.1/(90 ± 0.1) = 0.06 units while the fluorescence from the SR would be 9 × 1 × 1000/(90 ± 1000) = 8.26 units and the total cell fluorescence would be 8.32 units. In the presence of caffeine assume that the myoplasmic [Ca2+]i is 3 μm (Kabbara & Allen, 1999a) and that the [Ca2+]SR equilibrates with this level. Then the total signal becomes (58 × 1 × 3/(90 ± 3)) + (9 × 1 × 3/(90 ± 3)) = 2.16. Thus on these assumptions the fluorescence signal ought to fall by 8.32/2.16, i.e. ≈4-fold, in the presence of caffeine whereas in fact it fell by 2-fold. We have no evidence that the fluo-5N concentrations are equal in the myoplasm and the SR and it is possible that the concentration of fluo-5N is higher in the myoplasm than in the SR either because only small amounts of fluo-5N AM are delivered to the SR or because the activity of esterases in the SR is low. If fluo-5N were two times higher in the myoplasm than the SR then the control signal becomes 8.39 while the caffeine signal becomes 4.03 and the ratio becomes ≈2, which is approximately what we measure.
A similar approach can be applied to the saponin experiment on the assumption that after saponin treatment there is no fluo-5N remaining in the myoplasm. On the assumption that fluo-5N is initially equal in each compartment the control signal is 8.32 and the signal after saponin is exclusively from the SR and equals 8.26. Thus saponin application should cause no appreciable change in fluorescence on our assumptions. In practice fluorescence falls to about 50 % with application of saponin suggesting that either there is a large component of fluo-5N in the myoplasm which can diffuse away during saponin treatment or saponin treatment reduces the fluorescence from the SR. To explain the saponin result on the basis of increased fluo-5N concentration in the myoplasm over the SR would require about 100 times more fluo-5N in the myoplasm than in the SR which seems unlikely. It seems more likely that saponin also causes some loss of either fluo-5N or Ca2+ from the SR. Launikonis & Stephenson (1997) showed that 100 μg ml−1 of saponin could cause loss of 25 % of the Ca2+ from the SR in cane toad muscles so this seems a good possibility.
Interpretation of fluo-5N fluorescence signal
The two main difficulties have already been mentioned above and are (i) the fluorescence signal arises from both myoplasm and SR and (ii) the fluorescence signal is a non-linear function of [Ca2+]SR. To some extent the first problem is minimized by our procedure of using the total fluorescence in caffeine and TBQ as the ‘[Ca2+]SR empty’ signal. We think it reasonable to assume that in the presence of substantial SR Ca2+ pump inhibition, maximal caffeine application will allow the myoplasmic and SR Ca2+ to equilibrate rendering the SR virtually empty of diffusable Ca2+. On this basis the average fluorescence measured in the presence of caffeine and TBQ (46 % control) has been defined as [Ca2+]SR= 0 and fluorescence above this level is assumed to be proportional to [Ca2+]SR. We recognize that this is an approximation but uncertainties about the concentration and KCa of the indicator in both the myoplasm and the SR prevent us pursuing these issues more quantitatively.
The second problem, of fluorescence non-linearity, depends mainly on the effective KCa of indicator in the SR. Using the equation for fractional fluorescence above, with the in vitro KCa= 90 μm and [Ca2+]SR= 1000 μm, the fluo-5N signal from the SR is 0.92 of the maximum. Thus we might expect the fluo-5N signal to be very close to saturation and a very poor indicator of changes in [Ca2+]SR. In contrast the experiment in Fig. 3 shows that the fluorescence could increase more than 2-fold over the level established in saponin when a high concentration of Ca2+ was placed outside the SR. Thus in practice the fluo-5N does not appear close to saturation. Many indicators have been found to have a lower sensitivity (higher KCa) in vivo than in vitro, probably because of protein binding, and this may be the explanation of this finding (Kurebayashi et al. 1993).
Magnitude and time course of SR Ca2+
On this basis of the assumptions given in the Results and discussed above, we find that [Ca2+]SR falls by 40 % in a 500 ms 100 Hz tetanus; reducing stimulation frequency reduced the fall in [Ca2+]SR, while prolonging the tetanus increased the decline modestly. Partial blockade of the SR pump increased the fall in [Ca2+]SR as expected since any recycling of released Ca2+ would be slowed. Our data can be compared to the data of Somlyo et al. (1981) who measured the total SR calcium content and reported that during a 1.2 s tetanus 59 % of the content of the terminal cisternae was released. Bearing in mind the many differences in conditions (Somlyo et al. 4 °C, 40 Hz stimulation rate, 1.2 s tetanus, measured total calcium; our study 22 °C, 100 Hz stimulation rate, 0.5 s tetanus, measured free [Ca2+]SR) the agreement seems reasonable
A striking feature of the present results is the fast and slow components of recovery of [Ca2+]SR following a tetanus. This parallels the fast and slow components of recovery of myoplasmic [Ca2+]i following a tetanus (Klein et al. 1991; Westerblad & Allen, 1993). The two components of myoplasmic [Ca2+]i can be explained if the SR takes up Ca2+ throughout both components but the fast component is the period in which parvalbumin takes up Ca2+ whereas the slow component is the period in which parvalbumin releases the Ca2+ that it took up during the tetanus and early recovery (for review see Rall, 1996). Presumably the same general mechanisms apply to the two components of [Ca2+]SR recovery. Because the [Ca2+]i is high and rapidly falls over the first 200 ms of relaxation there is a component of SR Ca2+ influx which declines with a rapid time course. When the SR Ca2+ pump is inhibited by TBQ or fatigue, this influx will be smaller and decline more slowly and thus may not be apparent. The slow phase of both [Ca2+]i and [Ca2+]SR recovery represents the slower pump rate of SR pumping when the [Ca2+]i is low.
Store calcium during fatigue
Our measurements of [Ca2+]SR show two, reversible changes during fatigue: (i) a steady decline in resting [Ca2+]SR (defined as the level preceding each tetanus) and (ii) a reduction in Δ[Ca2+]SR associated with each tetanus. The decline in resting [Ca2+]SR could either be because the total Ca2+ in the SR has declined or because the buffering of Ca2+ in the SR has increased (see below). We suggest that the early component of decline is simply because the SR Ca2+ pump has not returned all the Ca2+ released by the previous tetanus. Figure 4 shows that about 20 s are required for the [Ca2+]SR to return to control after a short tetanus so that when tetani are repeated at shorter intervals Ca2+ will gradually accumulate in the myoplasm, mainly bound to parvalbumin, and the SR will show an equivalent depletion caused by a reduction in its total Ca2+. One possibility is that this process continues throughout the fatigue run, probably aided by the gradual slowing of the SR Ca2+ pump which has been shown to occur during fatigue (Allen et al. 1989; Westerblad & Allen, 1993). In favour of this interpretation is the observation that resting [Ca2+]i rises throughout fatigue, suggesting that the same mechanism underlies both (Lee et al. 1991). However, loading of parvalbumin would be expected to saturate after a number of tetani and yet the resting [Ca2+]SR continues to decline during the repeated tetani. We propose that this second process represents Ca2+ becoming bound in the SR as Ca2+ phosphate (CaPi) as previously proposed (Fryer et al. 1995; Westerblad & Allen, 1996; Kabbara & Allen, 1999b). This explanation depends on the idea that the level of phosphate in the SR increases during fatigue (see next paragraph).
Studies of the total Ca (free and bound) in the SR show that the total SR Ca is increased in fatigued muscle (Gonzalez-Serratos et al. 1978). In their study electron probe microanalysis was used and in the fatigued muscles the total SR calcium was increased by 55 % (36 mmol (kg dry weight)−1) and phosphorus also showed a smaller percentage rise of 8 % though the absolute increase was similar to calcium (34 mmol (kg dry weight)−1). These results fit well with the conclusion that Ca2+ phosphate may have precipitated within the SR since they show an equimolar increase in both. Thus the results of the two studies (decreased free [Ca2+]SR and increased total SR Ca) are compatible if we assume that much of the total Ca is in the form of insoluble Ca2+ phosphate.
At the end of fatiguing stimulation the resting [Ca2+]SR recovers in two phases. There is a rapid component with a time constant of 1.7 s. This time course is intermediate between the fast and slow components following an unfatigued tetanus and presumably represents the time course of pumping Ca2+ from the myoplasm back to the SR. The more rapid time course compared with slow component after a single unfatigued tetanus may reflect the higher [Ca2+]i and the fact that the pump rate of the SR is a power function of the [Ca2+]i with an exponent of 3-4 (Klein et al. 1991; Westerblad & Allen, 1993). Following this phase there is a slower recovery with a time course of several minutes; this could conceivably represent the time course for reducing phosphate in the myoplasm and for Ca2+ phosphate in the SR to redissolve thereby increasing [Ca2+]SR.
Our measurements also show a decline of Δ[Ca2+]SR throughout fatigue which roughly parallels the decline of resting [Ca2+]SR suggesting that the concentration of Ca2+ within the SR is a major factor in the magnitude of Ca2+ release. Furthurmore, the decline and recovery of Δ[Ca2+]SR is quite similar to the decline and recovery of the tetanic [Ca2+]i signals suggesting that changes in store Ca2+ are a major factor in the changes in Ca2+ handling which have been shown to contribute to fatigue (for review see Allen et al. 1995). One interesting feature observed in many fatigue studies is that the peak tetanic [Ca2+]i increases for the first 10-20 tetani (Allen et al. 1989; Kabbara & Allen, 1999b); in contrast, in the present study Δ[Ca2+]SR does not show an initial increase but falls monotonically during fatigue. The presence of increased myoplasmic tetanic [Ca2+]i at a time when SR Ca2+ release (judged by Δ[Ca2+]SR) is reduced suggests that buffering of Ca2+ in the myoplasm has decreased. The most likely cause of this is that the SR Ca2+ pump, which constitutes a major component of the Ca2+ buffering, is slowed as has been demonstrated after 10-20 tetani (Westerblad & Allen, 1993). This early slowing of the SR Ca2+ pump may be caused by an inhibitory effect of phosphate on the SR Ca2+ pump (Duke & Steele, 2000). This interpretation is further supported by the observation that in the creatine kinase knockout mice, in which phosphate does not rise, the early rise in peak tetanic [Ca2+]i is absent (Dahlstedt et al. 2000). During the later parts of fatigue the myoplasmic [Ca2+]i transients and Δ[Ca2+]SR decline in parallel suggesting that further changes in buffering are relatively small.
Conclusions
Fluo-5N loads predominantly though not exclusively in the SR and provides a signal that indicates the degree of SR Ca2+ loading. The SR Ca2+ loading falls rapidly during tetani and recovers in two components with a fast and a slow time course. During fatigue, SR Ca2+ loading declines monotonically and then recovers with two distinct time courses. These data confirm the proposal that change in Ca2+ available for release in the SR store contributes to the changes in Ca2+ handling during fatigue.
Acknowledgments
This work was supported by the National Health and Medical Research Council of Australia.
References
- Allen DG, Lännergren J, Westerblad H. Muscle cell function during prolonged activity: cellular mechanisms of fatigue. Experimental Physiology. 1995;80:497–527. doi: 10.1113/expphysiol.1995.sp003864. [DOI] [PubMed] [Google Scholar]
- Allen DG, Lee JA, Westerblad H. Intracellular calcium and tension during fatigue in isolated single muscle fibers from Xenopus laevis. Journal of Physiology. 1989;415:433–458. doi: 10.1113/jphysiol.1989.sp017730. [DOI] [PMC free article] [PubMed] [Google Scholar]
- Balnave CD, Allen DG. Evidence for Na+/Ca2+ exchange in intact single skeletal muscle fibers from the mouse. American Journal of Physiology. 1998;274:C940–946. doi: 10.1152/ajpcell.1998.274.4.C940. [DOI] [PubMed] [Google Scholar]
- Balnave CD, Davey DF, Allen DG. Distribution of sarcomere length and [Ca2+]i in single fibres from mouse skeletal muscle following stretch-induced injury. Journal of Physiology. 1997;502:649–659. doi: 10.1111/j.1469-7793.1997.649bj.x. [DOI] [PMC free article] [PubMed] [Google Scholar]
- Blinks JR, Rudel R, Taylor SR. Calcium transients in isolated amphibian skeletal muscle fibres: detection with aequorin. Journal of Physiology. 1978;277:291–323. doi: 10.1113/jphysiol.1978.sp012273. [DOI] [PMC free article] [PubMed] [Google Scholar]
- Callewaert G, Cleemann L, Morad M. Caffeine-induced Ca2+ release activates Ca2+ extrusion via Na+-Ca2+ exchanger in cardiac myocytes. American Journal of Physiology. 1989;257:C147–152. doi: 10.1152/ajpcell.1989.257.1.C147. [DOI] [PubMed] [Google Scholar]
- Chen W, Steenbergen C, Levy LA, Vance J, London RE, Murphy E. Measurement of free Ca2+ in sarcoplasmic reticulum in perfused rabbit heart loaded with 1,2-bis(2-amino-5,6-diflurophenoxy)ethane-N,N,N',N''-tetraacetic acid by 19F NMR. Journal of Biological Chemistry. 1996;271:7398–7403. [PubMed] [Google Scholar]
- Dahlstedt AJ, Katz A, Wieringa B, Westerblad H. Is creatine kinase responsible for fatigue? Studies of isolated skeletal muscle deficient in creatine kinase. FASEB Journal. 2000;14:982–990. doi: 10.1096/fasebj.14.7.982. [DOI] [PubMed] [Google Scholar]
- Duke AM, Steele DS. Characteristics of phosphate-induced Ca2+ efflux from the SR in mechanically skinned rat skeletal muscle fibers. American Journal of Physiology. 2000;278:C126–135. doi: 10.1152/ajpcell.2000.278.1.C126. [DOI] [PubMed] [Google Scholar]
- Endo M, Iino M. Specific perforation of muscle cell membranes with preserved SR functions by saponin treatment. Journal of Muscle Research and Cell Motility. 1980;1:89–100. doi: 10.1007/BF00711927. [DOI] [PubMed] [Google Scholar]
- Fryer MW, Owen VJ, Lamb GD, Stephenson DG. Effects of creatine phosphate and Pi on Ca2+ movements and tension development in rat skinned skeletal muscle fibres. Journal of Physiology. 1995;482:123–140. doi: 10.1113/jphysiol.1995.sp020504. [DOI] [PMC free article] [PubMed] [Google Scholar]
- Fryer MW, Stephenson DG. Total and sarcoplasmic reticulum calcium contents of skinned fibres from rat skeletal muscle. Journal of Physiology. 1996;493:357–370. doi: 10.1113/jphysiol.1996.sp021388. [DOI] [PMC free article] [PubMed] [Google Scholar]
- Godt RE, Maughan DW. On the composition of of the cytosol of relaxed skeletal muscle of the frog. American Journal of Physiology. 1988;254:C591–604. doi: 10.1152/ajpcell.1988.254.5.C591. [DOI] [PubMed] [Google Scholar]
- Golovina VA, Blaustein MP. Spatially and functionally distinct Ca2+ stores in sarcoplasmic and endoplasmic reticulum. Science. 1997;275:1643–1648. doi: 10.1126/science.275.5306.1643. [DOI] [PubMed] [Google Scholar]
- Gonzalez-Serratos H, Somlyo AV, Mccellan G, Shuman H, Borrero LM, Somlyo AP. Composition of vacuoles and sarcoplasmic reticulum in fatigued muscle: electron probe analysis. Proceedings of the National Academy of Sciences of the USA. 1978;75:1329–1333. doi: 10.1073/pnas.75.3.1329. [DOI] [PMC free article] [PubMed] [Google Scholar]
- Kabbara AA, Allen DG. Measurement of sarcoplasmic reticulum Ca2+ content in intact amphibian skeletal muscle fibres with 4-chloro-m-cresol. Cell Calcium. 1999a;25:227–235. doi: 10.1054/ceca.1999.0023. [DOI] [PubMed] [Google Scholar]
- Kabbara AA, Allen DG. The role of calcium stores in fatigue of isolated single muscle fibres from the cane toad. Journal of Physiology. 1999b;519:169–176. doi: 10.1111/j.1469-7793.1999.0169o.x. [DOI] [PMC free article] [PubMed] [Google Scholar]
- Kabbara AA, Nguyen LT, Stephenson G M M, Allen DG. Intracellular calcium during fatigue of cane toad skeletal muscle in the absence of glucose. Journal of Muscle Research and Cell Motility. 2000;21:481–489. doi: 10.1023/a:1005650425513. [DOI] [PubMed] [Google Scholar]
- Klein MG, Kovacs L, Simon BJ, Schneider MF. Decline of myoplasmic Ca2+, recovery of calcium release and sarcoplasmic Ca2+ pump properties in frog skeletal muscle. Journal of Physiology. 1991;441:639–671. doi: 10.1113/jphysiol.1991.sp018771. [DOI] [PMC free article] [PubMed] [Google Scholar]
- Kurebayashi N, Harkins AB, Baylor SM. Use of fura red as an intracellular calcium indicator in frog skeletal muscle fibres. Biophysical Journal. 1993;64:1934–1960. doi: 10.1016/S0006-3495(93)81564-9. [DOI] [PMC free article] [PubMed] [Google Scholar]
- Launikonis BS, Stephenson DG. Effect of saponin treatment on the sarcoplasmic reticulum of rat, cane toad and crustacea (yabby) skeletal muscle. Journal of Physiology. 1997;504:425–437. doi: 10.1111/j.1469-7793.1997.425be.x. [DOI] [PMC free article] [PubMed] [Google Scholar]
- Lee JA, Westerblad H, Allen DG. Changes in tetanic and resting [Ca2+]i during fatigue and recovery of single muscle fibres from Xenopus laevis. Journal of Physiology. 1991;433:307–326. doi: 10.1113/jphysiol.1991.sp018427. [DOI] [PMC free article] [PubMed] [Google Scholar]
- Meldolesi J, Pozzan T. The endoplasmic reticulum Ca2+ store: a view from the lumen. Trends in Biochemical Science. 1998;23:10–14. doi: 10.1016/s0968-0004(97)01143-2. [DOI] [PubMed] [Google Scholar]
- Mobley BA, Eisenberg BR. Sizes of components in frog skeletal muscle measured by methods of stereology. Journal of General Physiology. 1975;66:31–45. doi: 10.1085/jgp.66.1.31. [DOI] [PMC free article] [PubMed] [Google Scholar]
- Peachey LD. The sarcoplasmic reticulum and transverse tubules of the frog's sartorius. Journal of Cell Biology. 1965;25(suppl.):209–231. doi: 10.1083/jcb.25.3.209. [DOI] [PubMed] [Google Scholar]
- Rall JA. Role of parvalbumin in skeletal muscle relaxation. News in Physiological Sciences. 1996;11:249–255. [Google Scholar]
- Somlyo AV, Gonzalez-Serratos H, Shuman H, McClellan AP, Somlyo AP. Calcium release and ionic changes in the sarcoplasmic reticulum of tetanized muscle: an electron probe study. Journal of Cell Biology. 1981;90:577–594. doi: 10.1083/jcb.90.3.577. [DOI] [PMC free article] [PubMed] [Google Scholar]
- Westerblad H, Allen DG. The contribution of [Ca2+]i to the slowing of relaxation in fatigued single fibres from mouse skeletal muscle. Journal of Physiology. 1993;468:729–740. doi: 10.1113/jphysiol.1993.sp019797. [DOI] [PMC free article] [PubMed] [Google Scholar]
- Westerblad H, Allen DG. The role of sarcoplasmic reticulum in relaxation of mouse muscle; effects of 2,5-di(tert-butyl)-1,4-benzohydroquinone. Journal of Physiology. 1994;474:291–301. doi: 10.1113/jphysiol.1994.sp020022. [DOI] [PMC free article] [PubMed] [Google Scholar]
- Westerblad H, Allen DG. The effects of intracellular injections of phosphate on intracellular calcium and force in single fibres of mouse skeletal muscle. Pflügers Archiv. 1996;431:964–970. doi: 10.1007/s004240050092. [DOI] [PubMed] [Google Scholar]