

Abstract
The dynamic properties of the microcircuitry formed by cones and horizontal cells in the isolated goldfish retina were studied. Cones project to horizontal cells and horizontal cells feed back to cones via a relatively slow negative feedback pathway.
The time constant of the feedback signal in cones and of the effect this feedback signal had on the responses of second-order neurons was determined using whole-cell patch clamp and intracellular recording techniques.
It was found that the feedback signal in cones had a time constant of around 80 ms, whereas the time constant of the effect this feedback signal had on the second-order neurons ranged from 36 to 116 ms. This range of time constants can be accounted for by the non-linearity of the Ca2+ current in the cones. In depolarized cones, the feedback-mediated response in second-order neurons had a similar time constant to that of the direct light response of the cone, whereas in hyperpolarized cones, the time constant of the feedback-mediated response in second-order neurons was considerably larger.
Further, it was shown that there was no delay in the feedback pathway. This is in contrast to what has been deduced from the response properties of second-order neurons. In one type of horizontal cell, the responses to red light were delayed relative to the responses to green light. This delay in the second-order neurons can be accounted for by the interaction of the direct light response of the medium-wavelength-sensitive cones (M-cones) with the feedback response of the M-cones received from the horizontal cells.
The retina translates an object projected onto it into a well-balanced combination of excitatory feedforward signals and inhibitory feedback signals. Generally speaking, feedback pathways have much larger receptive fields than feedforward pathways (Dowling & Werblin, 1969; Werblin & Dowling, 1969). The cone-horizontal cell-bipolar cell system is the first stage in the visual system where such combined excitatory and inhibitory interactions take place and yields the so-called centre- surround organization of bipolar cell (BC) receptive fields (see for instance Dowling, 1987). This organization plays a prominent role in contrast enhancement (Dowling, 1987) and colour constancy (Kamermans et al. 1998).
The events taking place in the first synapse of the visual system can be summarized as follows. Cones project to horizontal cells (HCs) via a Ca2+-dependent, glutamatergic pathway (see for instance Rodieck, 1998). Light stimulation hyperpolarizes cones, leading to a hyperpolarization of HCs. HCs feed back to cones by modulating the Ca2+ current in cones (Verweij et al. 1996). This modulation of the Ca2+ current can be measured directly in the cones and results in an increase of their glutamate release (Copenhagen & Jahr, 1989; Ayoub et al. 1989). This increase forms the basis for the surround responses of the BC (Dowling & Werblin, 1969; Werblin & Dowling, 1969) and the spectral coding of the HCs (for review see Kamermans & Spekreijse, 1995).
In the fish retina three spectrally coded HC types exist. Monophasic HCs (MHCs) hyperpolarize to all stimulus wavelengths, biphasic HCs (BHCs) hyperpolarize to short and middle wavelength stimuli and depolarize to long wavelength stimuli, and triphasic HCs (THCs) hyperpolarize to short and long wavelength stimuli and depolarize to middle wavelength stimuli (Spekreijse & Norton, 1970; Mitarai et al. 1974; Hashimoto et al. 1976). The main pathways underlying these spectrally coded responses of the HCs can be summarized as follows. MHCs are dominated by long-wavelength-sensitive cone (L-cone) input, BHCs are dominated by M-cone input and THCs are dominated by short-wavelength-sensitive cone (S-cone) input and all HCs feed negatively back to the cones. The result of this wiring is that, due to their L-cone input, the MHCs hyperpolarize to all stimulus wavelengths. BHCs will hyperpolarize when stimulated with short and middle wavelength stimuli due to the M-cone input, but for long wavelength stimuli they will depolarize due to feedback from the MHCs to the M-cones (Stell & Lightfoot, 1975; Stell et al. 1975; Kamermans & Spekreijse, 1995) (Fig. 1). This depolarizing response in the BHCs is a pure feedback response. Indications of feedback can also be found in the MHCs. The MHCs show a depolarizing rollback in the sustained light response, which can be mainly attributed to negative feedback from HCs to cones (Fig. 1A) (Piccolino et al. 1981; Wu, 1994; Kamermans & Spekreijse, 1999). Note that the feedback pathway that generates the depolarizing response in the BHC is the same negative feedback pathway as that generating the rollback response in the MHCs (Stell & Lightfoot, 1975; Kamermans et al. 1991; Kamermans & Spekreijse, 1995).
Figure 1.
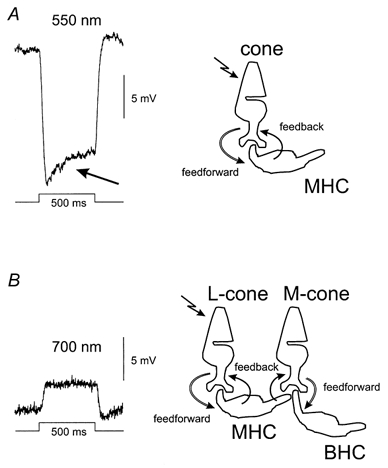
A, response of a MHC to a 550 nm, −1.3 log units, 3000 μm spot of 500 ms duration. The rollback (arrow) in the HC response has a time constant of about 120 ms. B, response of a BHC to a 700 nm, −1.3 log units, 3000 μm spot of 500 ms duration. The time constant of the depolarizing response is about 35 ms. The timing of the stimulus and response scale are shown in the figure.
The feedback pathway in the outer retina is assumed to be much slower than the direct pathway (Piccolino et al. 1981; Wu, 1994; Kamermans et al. 1996) and it has been suggested that the feedback synapse contains a delay of 25 ms (Spekreijse & Norton, 1970). These conclusions are based on indirect measurements. Since the combination of patch clamp and intracellular recording techniques in isolated retinas allows the direct measurement of the properties of the cone light responses, the feedback signal in the cones, and the resulting change in the cone output, we can obtain a direct measurement of the dynamic properties of the signals flowing across the first synapse in the visual system. In this study we determined (1) the time constant of the feedback pathway and (2) the delay in the feedback pathway in order to estimate the relative timing of the direct light response and the feedback-mediated responses in the outer retina.
METHODS
Preparation
Goldfish, Carassius auratus (12–16 cm standard body length), were kept at 18 °C under a 12 h dark, 12 h light regime. All experiments were performed with fish that were between 6 and 9 h in their light phase. Prior to the experiment, the fish were kept in the dark for 8 ± 1 min to facilitate the isolation of the retina from the pigment epithelium. The fish were decapitated under infrared light illumination (λ= 920 nm), the brain destroyed and one eye enucleated. Animal handling and experimental procedures were reviewed and approved by the ethical committee for animal care and use of the Faculty of Medicine of the University of Amsterdam, acting in accordance with the European Community Council directive of 24 November 1986 (86/609/EEC). This eye was hemisected and most of the vitreous humour removed with filter paper. The retina was isolated, placed receptor-side up in a superfusion chamber and superfused continuously (1.5 ml min−1) with oxygenated Ringer solution (pH 7.8, 18 °C).
For the whole-cell recordings of the photoreceptors, the superfusion chamber was mounted on a Nikon Optiphot-X2 microscope (Nikon, Japan). The preparation was illuminated with infrared light (λ > 850 nm; Kodak wratten filter 87c) and viewed with a Nikon × 40 water immersion objective (NA = 0.55), Hoffman modulation contrast optics and a video camera (Philips). Electrodes were mounted on a MP-85 Huxley/Wall-type micromanipulator (Sutter Instruments Company, USA) and connected to a Dagan 3900A integrating patch clamp (Dagan Corporation, USA).
For the intracellular recordings from HCs, the retina was illuminated with an infrared light-emitting diode (LED SFH 484-II, Telefunken, Germany) and viewed through a × 2 objective of an inverted microscope (IMT-2, Olympus, Japan) and a video camera (Philips). The recordings were made with a S7000A microelectrode amplifier with a S7071A electrometer module (World Precision Instruments, USA).
Data acquisition, control of the patch clamp, the microelectrode amplifier and the optical stimulator were done through a CED 1401 AD/DA convertor with a sample frequency of 1.0 kHz (Cambridge Electronic Design Limited, Cambridge, UK) and an MS-DOS-based computer system.
Optical stimulator
For the whole-cell experiments on photoreceptors, the optical stimulator consisted of a 450 W xenon lamp which supplied two beams of light. These were projected through Uniblitz VS14 shutters (Vincent associates, USA), neutral density filters (NG Schott, Germany), bandpass interference filters with a bandwidth of 8 ± 3 nm (Ealing Electro-Optics Inc., Watford, UK), lenses and apertures. The 20, 65 and 250 μm spots were projected through the × 40 water immersion objective (NA = 0.55) of the microscope and light stimuli of 3000 μm were projected through the condenser (NA = 1.25). Throughout the text, for monochromatic light stimuli, a photon flux density of 1.0 × 10⁹ photons μm−2 s−1 corresponds to an intensity of 0 log units. This holds for all wavelengths used. For white light stimuli, a photon flux density of 4.0 × 10³ cd corresponds to an intensity of 0 log units.
For the intracellular experiments on HCs, the optical stimulator consisted of two stimulus beams from a 450 W xenon source (Osram, Germany). These were used to project light spots of various sizes, wavelengths and intensities onto the retina. In one stimulus channel the wavelength was controlled by a monochromator (Ebert, Waltman, USA) and in the other stimulus channel by interference filters (Ealing Electro-Optics Inc.). The intensity of each channel was controlled by a pair of circular neutral density filters (CND3, Barr & Strout, Glasgow, UK). The light stimuli were projected onto the retina through the epifluorescence channel of the microscope. The intensity of the 450, 500, 550, 650 and 700 nm stimuli were, respectively, 1.3, 0.4, 0.4, 0.5 and 0.3 log units lower than that of the 600 nm stimuli.
Patch electrodes and pipette medium
The patch pipettes were pulled from borosilicate glass (GC150TF-10 Clark, UK) with a Sutter P-87 micropipette puller and had impedances between 5 and 10 MΩ when filled with standard patch pipette medium and measured in Ringer solution. The series resistance during the whole-cell recording was between 10 and 20 MΩ.
The standard patch pipette medium contained (mm): 20.0 KCl, 70.0 d-potassium gluconate, 5.0 KF, 1.0 MgCl2, 0.1 CaCl2, 1.0 EGTA, 5.0 Hepes, 4.0 Na2-ATP, 1.0 Na3-GTP, 0.2 3′:5′-Na-cGMP, 20 Na2-phosphocreatine, and, in addition, 50 units ml−1 creatine phosphokinase. The pH of the pipette medium was adjusted to 7.25 with KOH. All chemicals were obtained from Sigma-Aldrich, USA.
Microelectrodes
Intracellular microelectrodes were pulled on a Sutter P-80-PC micropipette puller using aluminium silicate glass (o.d., 1.0 mm; i.d., 0.5 mm; Clark, UK), and had impedances ranging from 80 to 200 MΩ when filled with 4 m potassium acetate.
Liquid junction potential
The liquid junction potential was measured with a patch electrode, filled with pipette medium, and positioned in a bath containing pipette medium. The reference electrode was a patch electrode filled with 3 m KCl. After the potential was adjusted to zero, the bath solution was replaced with Ringer solution. The resulting potential change was considered as the junction potential and all data were corrected accordingly. All results presented in this paper were obtained about 15 min after whole-cell configuration was achieved.
Estimating the time constant
The terms ‘time constant of a response’ and ‘the relative delay between responses’ were determined as follows. A single exponential function was fitted through the data points of the on-phase of the response using Levenberg-Marquardt iterations. The 1/e value of this exponential function was taken as the time constant of the response. These calculations were done with Origin 5.0 (Microcal, Northampton, MA, USA). The relative delay between responses is defined as the time difference between the moments of onset of the responses. A first-order description was chosen, since this paper deals with changes in τ rather than its absolute value.
Simulations and parameter estimation
Simulations were performed using Origin 5.0 (Microcal). All parameters used are listed in Tables 1 and 2. The only free parameter was τFB. The value for this parameter was found by varying this time constant and plotting the relation of Fig. 5C until it fitted the experimental data. The validity of the fit was judged by eye.
| Table 1 | |
|---|---|
| K | −36 mV |
| n | 3.7 mV |
| gCa | 1 nS |
| ECa | 50 mV |
| Vcone | ranging from −30 to −55 mV |
| A | −12 mV |
| τfb | 80 ms |
| Table 2 | |
|---|---|
| K | −36 mV |
| n | 3.7 mV |
| gCa | 1 nS |
| ECa | 50 mV |
| Vrest | −45 mV |
| A | −9 mV |
| τfb | 80 ms |
| τcone | 30 ms |
Figure 5.
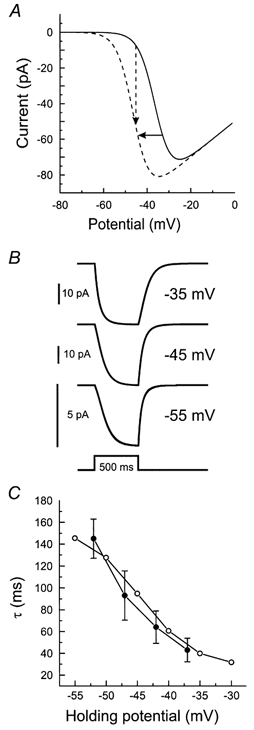
A, simulated current-voltage relation of the Ca2+ current (eqn (2) in the Appendix) in a cone during stimulation with an intense 65 μm white spot (continuous line) and during stimulation with an additional 3000 μm spot (dashed line). Negative feedback from HCs to cones results in a shift of the Ca2+ current activation function to more negative potentials (continuous arrow). This shift will induce an increase in the Ca2+ current (dashed arrow). By choosing a time constant for the feedback signal of 80 ms, the feedback responses with a time constant ranging from about 30 to about 140 ms could be simulated (B and C).
RESULTS
First, the various signals studied will be defined. The feedback signal is the feedback-induced shift in the activation function of the Ca2+ current of the cones. The feedback response in a cone is defined as the feedback-induced change in the Ca2+ current in a voltage-clamped cone. The feedback-induced response in HCs is the change in HC membrane potential which can be attributed to the feedback-induced change in Ca2+ current in cones.
The time constant of the feedback-induced responses in HCs
The effect of negative feedback from HCs to cones can be measured in HCs (i.e. the feedback-induced response). Figure 1 gives two examples of these feedback-induced responses. Figure 1A gives the response of a MHC to 550 nm full-field stimulation. The response consists of a fast hyperpolarizing phase and a slower feedback-induced rollback (arrow). In the 20 cells analysed, the mean time constant of this rollback was 116 ± 6 ms, indicating that feedback is slow. Figure 1B shows the depolarizing response of a BHC to 700 nm full-field stimulation. This stimulus strongly activated the L-cones, whereas it hardly stimulated the M-cones. This depolarizing response is generated via negative feedback from the MHCs to the M-cones (see Fig. 1B right panel) and is subsequently forwarded to the BHCs (Stell & Lightfoot, 1975; Kamermans et al. 1991; Kamermans & Spekreijse, 1995). The mean time constant of this depolarizing response was 36 ± 8 ms (n = 6). These experiments show that feedback is fast.
Although the number and type of synaptic transitions is equal for both feedback-mediated HC responses (cone ⇒ MHC → cone ⇒ MHC vs. cone ⇒ MHC → cone ⇒ BHC), the difference in time constants of the resulting responses is considerable (116 vs. 36 ms). Since the two feedback-induced responses are generated with light of different wavelengths (700 nm for the BHC responses and 550 nm for the MHC response), one could hypothesize that the difference in time constants of the feedback-induced response in the HCs was due to differences in stimulus wavelength used. The following experiments are designed to determine whether this was the case.
The time constant of the feedback-induced change in Ca2+ current in cones
The feedback response in cones can most effectively be recorded when a cone is voltage clamped around −45 mV, saturated with a small bright white spot (65 μm) and stimulated with a full-field stimulus. This induces a small inward current (Fig. 2A) with a time constant of about 90 ms, which has been identified as an increased Ca2+ current (Verweij et al. 1996; Kamermans & Spekreijse, 1999; Kraaij et al. 2000a). The mean time constant of this response was 87 ± 4 ms (n = 18). To exclude the possibility that the small bright spot changed the adaptation state of the retina and thus modified the dynamic characteristics of the various pathways in the outer retina, the intensity- response relation of a MHC to full-field stimulation was determined with and without the small saturating spot. The intensity-response relation and the dynamic features of the HC responses were not modified at all by the bright small spot (data not shown). Therefore, this protocol can be used to determine the stimulus wavelength and intensity dependence of the time constant of the feedback response in cones.
Figure 2.
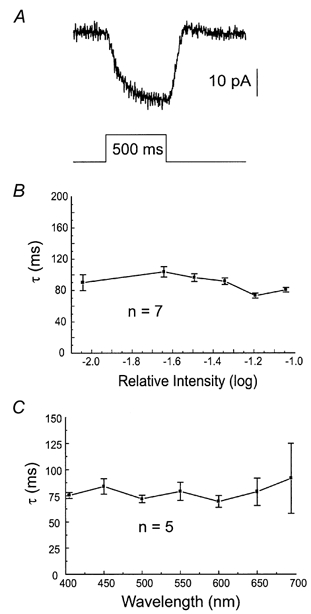
A, feedback-induced response of an M-cone clamped at −45 mV, which was continuously saturated with a bright white spot of 65 μm and, in addition, stimulated for 500 ms with a 3000 μm white spot of -1.3 log units. The timing of the stimulus and scale of the response are shown in the figure. B, intensity dependence of the feedback response. Mean time constants of the feedback response of 7 cones clamped at −47 mV, which were continuously saturated with an intense white spot of 65 μm and, in addition, stimulated for 500 ms with a 3000 μm 550 nm spot of increasing intensity. C, wavelength dependence of the feedback response. Mean time constants of the feedback responses of 5 cones clamped at −47 mV, which were continuously saturated with an intense white spot of 65 μm and, in addition, stimulated for 500 ms with a 3000 μm spot of various wavelengths at an intensity of −1.3 log units.
Figure 2B shows that the time constant is independent of intensity. Similarly, Fig. 2C shows that the time constant of the feedback signal is also mostly independent of wavelength, ruling out the possibility that the differences found in the time constants of the feedback-induced responses in HCs might be due to the different stimulus wavelengths or intensities used.
Another difference between the experimental conditions used in Fig. 1 that could explain the discrepancy found is that for the 550 nm stimuli all cones will hyperpolarize, whereas for the 700 nm stimuli only the L-cones will hyperpolarize and the M- and S-cones will remain almost completely depolarized (Van Dijk & Spekreijse, 1984; Kraaij et al. 1998; Palacios et al. 1998). For 700, 650 and 600 nm stimuli the M-cones are about 3, 1.5 and 0.35 log units less sensitive than the L-cones, respectively. For 550 nm stimuli the L-cones are about 0.3 log units less sensitive than the M-cones. In other words, the cones mediating the feedback-induced responses in MHCs (Fig. 1A) were all hyperpolarized, whereas the cones mediating the feedback-induced responses in BHCs (Fig. 1B) remained depolarized. Could it be that the time constant of the feedback signal depends on the cone membrane potential? To investigate this question the potential dependence of the feedback signal was studied. Figure 3A gives the (normalized) feedback response in a cone clamped at various potentials. At −37 mV the time constant was about 30 ms, whereas at −52 mV the time constant was 110 ms, showing that it was potential dependent. The mean relation between the time constant and the holding potential of six cones is given in Fig. 3B.
Figure 3.
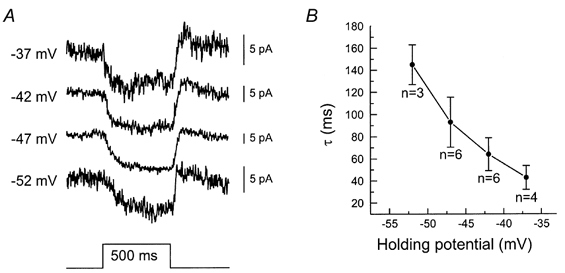
A, feedback responses of a voltage-clamped M-cone, which was continuously saturated with an intense white bright spot of 65 μm and, in addition, stimulated for 500 ms with a 3000 μm 550 nm spot. The clamp potentials of the cone are given to the left of the figure. An exponential function was fitted through these responses and the mean time constants are plotted as a function of holding potential in B.
MHCs feed back to M-cones and induce via this pathway a depolarizing response in BHCs to red light (Stell et al. 1975; Stell & Lightfoot, 1975; Kamermans et al. 1991; Kamermans & Spekreijse, 1995). For shorter wavelengths, the depolarizing response will become smaller and, finally, hyperpolarizing. The wavelength at which the response changes sign is called the neutral point. At this point, the direct light response of the M-cone is compensated by the feedback signal the M-cone receives from the MHCs. The location of the neutral point strongly depends on the adaptational state (Weiler & Wagner, 1984; Djamgoz et al. 1988) and the stimulus intensity used. Based on the experiments illustrated in Fig. 3 it is expected that increasing the intensity of the stimulus around the neutral point will increase the hyperpolarization of the M-cones, the time constant of the feedback-induced response in the BHC will increase with intensity, which will lead to an increase in the time constant of the feedback response. Note that under these conditions the feedback signal in the M-cones is mainly determined by the MHCs, and thus L-cone activity. For low intensity red light stimuli the MHCs will respond whereas the M-cones will not. For middle and high intensities both will respond. This shift in relative response amplitude is due to the difference in spectral sensitivity of the L- and M-cones and also to the sigmoidal shape of the cone intensity-response relation. This seems to be the case. Figure 4 shows the responses of a BHC to 600, 650 and 700 nm stimuli for three stimulus intensities. It is obvious from this figure that the responses to 650 nm become more and more transient with increasing intensity whereas the responses to 600 and 700 nm hardly change in shape. In Fig. 4 exponential functions are fitted through the depolarizing component of the responses to the 650 nm stimuli. The time constant of this component increases from 47 to 101 ms for 1 log unit increase in intensity.
Figure 4.
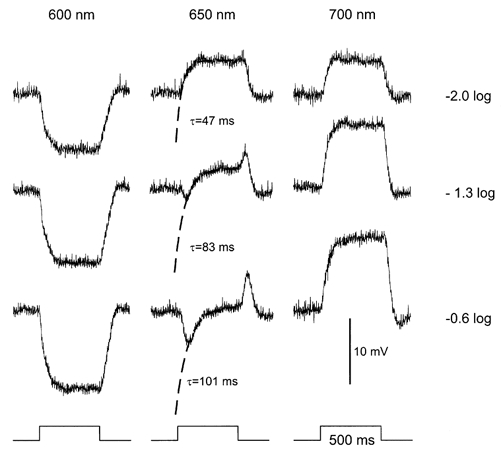
Light responses of a BHC to full-field light stimuli of 600, 650 and 700 nm at three intensities. The dashed lines are exponential functions fitted through the depolarizing phase of the response. The time constant of this part of the response increased with intensity (see text).
Simulating the potential dependence of the feedback response
How can we account for the potential dependence of the time constant of the feedback response? Negative feedback modulates the activation function of the Ca2+ current in cones (the feedback signal). This induces a change in Ca2+ current, which can be measured as a feedback-induced inward current in the cones (the feedback response). The question that now arises is whether the time constants of the feedback responses determined at the various clamp potentials of the cone can be accounted for with one time constant for the feedback signal. The relation between these two time constants was studied in a very simple model, consisting of only a Ca2+ current (eqn (1); see Appendix) and a single exponential function for the feedback signal (eqn (2); see Appendix). The parameters for this simulation are given in Table 1. These values were in the same range as the values determined and used by Verweij et al. (1996), Fahrenfort et al. (1999) and Kraaij et al. (2000b). Figure 5A gives the simulated Ca2+ currents without (continuous line) and with maximal feedback (dashed line). Surround stimulation results in a shift of the Ca2+ current activation function to more negative potentials. The function describing this shift is give by eqn (2) in the Appendix. Since we simulated feedback responses under voltage clamp conditions, Vcone(t) is a constant ranging from −30 to −55 mV for the various clamp potentials in the simulations. Figure 5B shows that, in the model cones, the time constants of the feedback responses strongly depend on the polarization of the cones. The aim of this simulation is to find a value for τFB that yields time constants of the feedback response ranging from 30 to 150 ms. Basically τFB is the only free parameter. The result of the simulation is that a time constant for the feedback signal of 80 ms is needed to obtain the proper range of time constants for the feedback response. Figure 5C gives the relation between the holding potential and the time constant of the feedback response for the simulations (^) and the experiments (•; taken from Fig. 3B). The two curves overlap nicely. This simulation result can be explained as follows. Around −45 mV, the Ca2+ current is relatively linear. At this potential, the feedback-induced shift in the Ca2+ current will yield a change in Ca2+ current with a time constant in the same range as τFB. At hyperpolarized potentials (−55 mV) the Ca2+ current is strongly non-linear. This non-linearity will slow down the response because initially a small shift in activation function of the Ca2+ current will result in only a small change in Ca2+ current. With time the Ca2+ current will have shifted such that it reaches its linear range. By then the effect of a small shift of the activation function of the Ca2+ current will have a much larger effect on the Ca2+ current. The combined effect will be an increase in the time constant of the feedback response. Consistent with this is that the pattern of the offset phase of the response seems to be the opposite of that of the onset phase of the response. At hyperpolarized levels it is fast and at depolarized levels it is slower. This behaviour is qualitatively equal to that observed experimentally (Fig. 3A). The simulations illustrate that the non-linearity of the Ca2+ current in the cones can account for the observed range of time constants of the feedback responses in cones and thus eventually of the feedback-induced responses in HCs.
Delay in feedback responses in cones and the feedback-induced responses in HCs
Next we studied whether or not a delay of about 25 ms exists in the negative feedback pathway from HCs to cones as suggested by Spekreijse & Norton (1970). First, the timing of the feedback-mediated responses in HCs were studied to see whether we could reproduce these results under our stimulus conditions. The hyperpolarizing responses of BHCs in the short and middle wavelength part of the spectrum are due to direct input from the cones, whereas the depolarizing responses to long wavelengths are mediated by feedback. Figure 6A gives the responses of a BHC for various wavelengths and three intensities. To determine whether a delay exists between the direct (hyperpolarizing) and the feedback-mediated (depolarizing) responses, the purely depolarizing responses of the BHC due to 650 and 700 nm stimulation (grey traces) were inverted and scaled such that they overlapped the hyperpolarizing responses due to 500 nm stimulation (black traces, Fig. 6B). Expansion of the time axis (Fig. 6C) shows that no delay exists between the responses to 500 and 600 nm stimuli, and that a delay of about 25 ms exists between the responses to 500 and 650 nm stimuli. This delay is reduced for longer wavelengths (700 nm) and does not depend strongly on stimulus intensity. This was found in all six cells analysed in this way.
Figure 6.
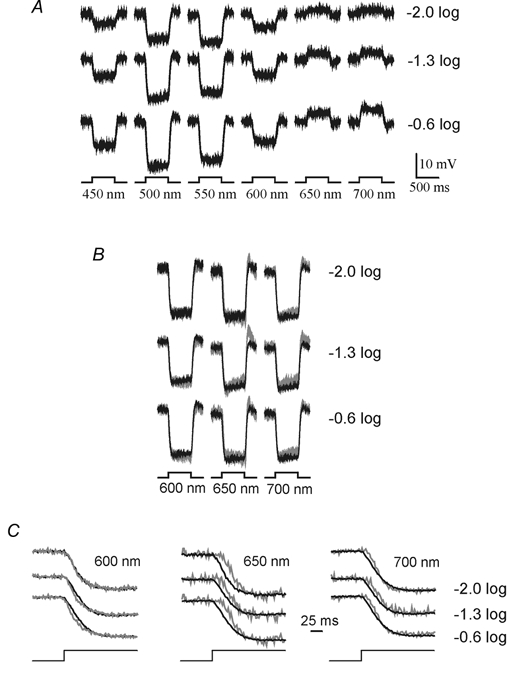
A, light responses of a BHC to stimuli of three intensities and six wavelengths. Short and middle wavelength stimuli evoked hyperpolarizing responses, whereas long wavelength stimuli induced depolarizing responses. The timing of the stimuli and scale of the responses are shown in the figure. B, light responses of a BHC to 600, 650 and 700 nm full-field light stimuli compared to 500 nm wavelength-induced light responses of the same BHC. The responses are scaled and inverted such that the light responses overlap the 500 nm light responses (grey traces). The timing of the stimulus is indicated in the figure. C, redrawing of the light onset responses shown in B on an expanded time scale.
We then studied the delay of the feedback response in the cones and unexpectedly found no delay between the onset of the light-induced voltage response of a cone (Fig. 7, black trace) and the feedback-induced inward current response of that same cone (grey trace). This was found in all 15 cones tested in this way. The results of Fig. 6C and Fig. 7 seem to contradict each other. The main difference between these two experiments is that during the feedback measurement presented in Fig. 7, the cone being recorded was voltage clamped, while during the experiment of Fig. 6C the cones were not. Could this have influenced the feedback-induced responses in the BHCs? The depolarizing responses of a BHC due to 650 and 700 nm stimulation are generated by feedback from MHCs to M-cones. M-cones are about 1.5 log units less sensitive than L-cones (Van Dijk & Spekreijse, 1984; Kraaij et al. 1998; Palacios et al. 1998). Given the fact that cones respond over an intensity range of about 2.5 log units (Kraaij et al. 1998; Palacios et al. 1998), M-cones will respond slightly to middle and high intensity 650 nm stimuli. The effect of this slight hyperpolarization on the feedback response in cones was evaluated with the model described above. However, in the present simulation the cones were not voltage clamped but their membrane potential changed with stimulation according to eqn (3) (see Appendix).
Figure 7.
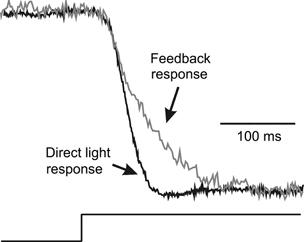
The normalized onset phase of the direct voltage light response of a cone to a 65 μm spot (black trace) and of the feedback response (current) of the same cone clamped at −45 mV (grey trace). This figure illustrates that the onset of the feedback response is not delayed relative to the onset of the direct light response.
For 650 nm stimuli two processes will affect the change in Ca2+ current: (1) M-cones hyperpolarize by a few millivolts, and (2) the activation function of the cone Ca2+ current shifts to more negative potentials. Both processes have different amplitudes and time constants. The combined effect of these two processes is simulated in Fig. 8 using the model described above. With the parameters given in Table 2, the feedback responses in the M-cone for various M-cone light response amplitudes (Vresp) were simulated. Vresp varied between 0 and −5 mV. The continuous traces in Fig. 8A show the change in Ca2+ current (ICa) without hyperpolarization of the M-cone, and the dashed traces show the feedback-induced responses for different values for Vresp (indicated to the right of the figure). In Fig. 8B the traces of Fig. 8A are shown plotted on an expanded time scale. It is obvious that the feedback-induced response becomes delayed when the M-cone response increases in amplitude. To account for this, it has to be realized that feedback will tend to increase the glutamate release with a time constant of 80 ms whereas hyperpolarization of the cone will tend to decrease the glutamate release with a time constant of about 30 ms. The overall effect is that during about the first 25 ms, the feedback response and the cone response tend to compensate each other and both the Ca2+ influx and the glutamate release hardly change. However, due to the differences in amplitudes and time constants of these two processes, the feedback-induced shift of the activation function will become the major process after about 25 ms. The result is that the output of the cone will only change significantly after about 25 ms, resulting in an apparently delayed depolarizing BHC response. This analysis confirms that the delay for responses to 700 nm light stimuli is shorter than that for responses to 650 nm light stimuli. The reason for this is that stimulation of the M-cone by 700 nm light is less effective than that by 650 nm light. For shorter wavelengths than 650 nm, the direct light response will become dominating, resulting in a hyperpolarizing transient response at light onset (Fig. 4). This simulation illustrates how a delay can occur in the cone output, without a delay in the feedback input.
Figure 8.
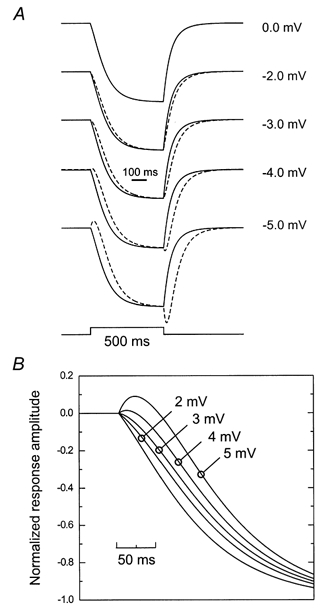
A, simulation of the feedback response in an M-cone for long wavelength stimuli. The time constant of the feedback signal in the cone is 80 ms and the time constant of the direct light response is 30 ms. The continuous trace is the change in Ca2+ current when the M-cone does not respond due to direct light stimulation (i.e. deep red light). The dashed traces are the changes in Ca2+ current when the M-cone responses have the amplitude indicated on the right of the figure. B, the onset of the change in Ca2+ current on an expanded time scale.
DISCUSSION
In this study we have shown that negative feedback from HCs to cones is strongly dependent on the membrane potential of the cone. Feedback to depolarized cones can be almost as fast as the cone response itself. Secondly, we have shown that no delay of 25 ms in the negative feedback pathway from HCs to cones exists. This is seemingly in contrast with the depolarizing responses of BHCs to red light stimulation, which are delayed relative to their hyperpolarizing responses. With a simple model we can account for both the potential dependence of the feedback signal in cones as well as for the delay in the BHC response to red light. The following is a discussion of some critical points of the model.
The origin of the rollback in the MHC response
We used the rollback in MHC responses as an estimate for feedback. Is this feature indeed due to feedback? The rollback in MHCs could in principle be accounted for by voltage-gated currents in HCs. If this were indeed the case and the rollback of the HC response were intrinsic to the HC, then the rollback should strictly correlate with the response amplitude. This is, however, not the case. Increasing the spot size or reducing the wavelength will lead to an increase in rollback even when the intensity is adjusted such that the response amplitude does not increase (Kamermans et al. 1989a,1989b). Another possibility is that the rollback is due to adaptation of the cones. However, under the stimulus conditions used in this study, this seems unlikely because blocking feedback from HCs to cones abolishes the rollback in HC responses whereas the response properties of the cones do not change (Fahrenfort et al. 2000).
Feedback or feedforward inhibition?
It is generally assumed that the depolarizing responses of the BHCs are generated via negative feedback to M-cones (see for instance: Stell & Lightfoot, 1975; Kamermans & Spekreijse, 1995). It was argued that according to this hypothesis the depolarizing responses should develop at a slower rate than the hyperpolarizing responses. As is obvious from Fig. 1 this is not the case. Asi & Perlman (1998) addressed this question in the turtle retina which has a similar organization. They argued that since the depolarizing responses of the BHCs are very fast compared to the hyperpolarizing responses, the latter could not be due to feedback, but would then be due to direct inhibitory input from the cones to the HCs. In this study we show that there is no need to dismiss the feedback hypothesis based on these arguments. The non-linearity of the Ca2+ current, together with the negative feedback mechanism from HCs to cones, can adequately account for the different dynamic features of the hyperpolarizing and depolarizing responses of the BHCs.
The mechanism of negative feedback
Recently Kamermans and co-workers (Verweij et al. 1996; Kraaij et al. 2000a) have shown that in goldfish, HCs feed back to cones via a modulation of the Ca2+ current in cones in a GABA-independent manner. In the literature it has, however, been suggested that HCs feed back to cones via a GABAergic mechanism (Marc et al. 1978; Kaneko & Tachibana, 1986a,1986b; Schwartz, 1987; Leibovic et al. 1987; Studholme & Yazulla, 1988; but see the recent review by Kamermans & Spekreijse, 1999). Although we cannot find any evidence for such a GABAergic mechanism in goldfish, it is important to discuss whether the data and model presented in this paper depend strongly on the type of feedback mechanism. The main difference between the GABAergic and the electrical feedback mechanism is that in the latter, the Ca2+ current activation function shifts, whereas in the GABAergic mechanism, it is the membrane potential of the cone that shifts with the strength of the feedback signal. Since feedback induces in both mechanisms a relative shift of the membrane potential versus the Ca2+ current relation, the model presented in this paper holds for both mechanisms, at least for small amplitudes. In extreme conditions, however, the two mechanisms will behave differently. In the GABAergic mechanism, the membrane conductance will increase with increasing feedback strength, whereas in the electrical mechanism the membrane conductance will decrease (Kraaij et al. 2000a). Changes in membrane conductance will influence the light response amplitude of the cone and thus the final effect of feedback on the second-order neurons.
Centre-surround organization of the bipolar cells
The receptive fields of almost all neurons in the visual system have a centre-surround organization. Lateral inhibitory interactions are essential for this organization. One of the sites where such lateral interactions take place is the outer retina. There, the HCs integrate the visual stimulus over a large area and feed back negatively to the cones. It was generally assumed that this feedback signal is slower than the feedforward signal and has a delay relative to the feedforward signal. If that were the case, then the centre-surround organization would be compromised when a moving object is presented (see for instance Werblin, 1991). At the leading edge, the surround would be compressed and at the tailing edge the surround would be extended. This would suggest a difference in contrast enhancement between the leading and the tailing edge of a moving object. In other words the object would subjectively change its shape while moving. To the best of our knowledge there are no psychophysical data supporting this prediction (Burr, 1980; Barbur et al. 1986). In this paper we have shown that, due to the non-linearity of the Ca2+ current, the time constant of the surround response can be of the same order as that of the centre response. The result is that the surround response of BCs will not lag the centre response for a moving object, retaining the integrity of the centre-surround organization.
The results presented in this paper illustrate why it is necessary to be careful using the dynamic features of neuronal responses as a measure for the pathway via which a response is generated. Due to the non-linearity of the synaptic processes involved, responses generated via longer pathways can appear to be equally fast or even faster than responses generated via a shorter pathway.
Acknowledgments
We would like to thank Drs I. Fahrenfort and C. Joselevitch for their useful comments on the manuscript. This work was supported by the Human Frontier Science program (HFSP) and the Netherlands Organization for Scientific Research (NWO).
APPENDIX
The aim of these simulations is to study the dynamic properties of the transformation from feedback signal to feedback response in cone photoreceptors. The feedback signal is the shift in the Ca2+ current activation function and the feedback response is the resulting change in Ca2+ current. For the present simulations we only need a mathematical description of the Ca2+ current and of the feedback signal.
The Ca2+ current consists of a linear conductance, gCa, a reversal potential, ECa, and an activation function. For the activation function we have chosen a Boltzmann equation. At negative potentials, the activation function is zero and at positive potentials the activation function is 1. At the value K (in conditions without feedback) the activation function is 0.5. The slope factor determining n determines the width of the activation function.
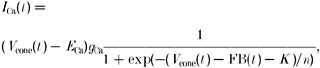 |
(1) |
where ICa(t) is the Ca2+ current in cones (pA) at time t, Vcone(t) is the cone membrane potential (mV) at time t, ECa is the equilibrium potential for Ca2+ (mV), gCa is the maximal conductance of the Ca2+ channels (nS), K is the half-activation potential of the Ca2+ current (mV), n is the slope factor (mV) and FB(t) is the feedback signal (mV) at time t.
The feedback signal is assumed to be a single exponential function that shifts the Ca2+ current to negative potentials. A is the amplitude of the shift and τFB is the time constant of the feedback signal. Note that this is the only free parameter.
| (2) |
where A is a scale factor, τFB is the time constant of the feedback signal (ms) and IFB(t) is the input function for the feedback signal at time t. For t ≤ 0 or t ≥ 500 ms IFB(t)=0 and for t > 0 and t < 500 ms IFB(t)=1.
For the simulations of the delay in the feedback response we need to include the membrane potential change of the cone due to direct light stimulation. For this simulation we have assumed that the cone light response can be described by a single exponential function:
| (3) |
where Vrest is the dark resting membrane potential (mV), Vresp is the maximal response amplitude (mV), τcone is the time constant of the cone (ms) and Icone(t) is the input function for the cone. For t ≤ 0 or t ≥ 500 ms Icone(t)=0 and for t > 0 and t < 500 ms Icone(t)=1.
References
- Asi H, Perlman I. Neural interactions between cone photoreceptors and horizontal cells in the turtle (Mauremys caspica) retina. Visual Neuroscience. 1998;15:1–13. doi: 10.1017/s0952523898146047. [DOI] [PubMed] [Google Scholar]
- Ayoub GS, Korenbrot JI, Copenhagen DR. Release of endogenous glutamate from isolated cone photoreceptors of the lizard. Neuroscience Report Supplement. 1989;10:S47–S56. doi: 10.1016/0921-8696(89)90008-x. [DOI] [PubMed] [Google Scholar]
- Barbur JL, Dunn GM, Wilson JA. The perception of moving comets at high retinal illuminance levels: a rod-cone interaction effect. Biological Cybernetics. 1986;55:145–158. doi: 10.1007/BF00341930. [DOI] [PubMed] [Google Scholar]
- Burr D. Motion smear. Nature. 1980;284:164–165. doi: 10.1038/284164a0. [DOI] [PubMed] [Google Scholar]
- Copenhagen DR, Jahr CE. Release of endogenous excitatory amino acids from turtle photoreceptors. Nature. 1989;341:537–539. doi: 10.1038/341536a0. [DOI] [PubMed] [Google Scholar]
- Djamgoz MBA, Downing JEG, Kirsch M, Prince DJ, Wagner H-J. Light-dependent plasticity of horizontal cell functioning in cyprinid fish retina: effects of background illumination of moderate intensity. Journal of Neurocytology. 1988;17:701–710. doi: 10.1007/BF01260997. [DOI] [PubMed] [Google Scholar]
- Dowling JE. An Approachable Part of the Brain. Cambridge: Belknap Press; 1987. The Retina. [Google Scholar]
- Dowling JE, Werblin FS. Organization of the retina of the mudpuppy, Necturus maculosus. I. Synaptic structure. Journal of Neurophysiology. 1969;32:315–338. doi: 10.1152/jn.1969.32.3.315. [DOI] [PubMed] [Google Scholar]
- Fahrenfort I, Habets RL, Spekreijse H, Kamermans M. Intrinsic cone adaptation modulates feedback efficiency from horizontal cells to cones. Journal of General Physiology. 1999;114:511–524. doi: 10.1085/jgp.114.4.511. [DOI] [PMC free article] [PubMed] [Google Scholar]
- Fahrenfort I, Sjoerdsma T, Kamermans M. Low concentrations of cobalt block negative feedback from HCs to cones, using a non-GABAergic pathway. Investigative Ophthalmology and Visual Science Supplement. 2000;41:S943. [Google Scholar]
- Hashimoto Y, Kato A, Inokucki M, Watanabe K. Re-examination of horizontal cells in the carp retina with procion yellow electrode. Vision Research. 1976;16:25–29. doi: 10.1016/0042-6989(76)90072-9. [DOI] [PubMed] [Google Scholar]
- Kamermans M, Haak J, Habraken JBA, Spekreijse H. The size of the horizontal cell receptive fields adapts to the stimulus in the light adapted goldfish retina. Vision Research. 1996;36:4105–4120. doi: 10.1016/s0042-6989(96)00143-5. [DOI] [PubMed] [Google Scholar]
- Kamermans M, Kraaij DA, Spekreijse H. The cone/horizontal cell system: A possible site for color-constancy. Visual Neuroscience. 1998;15:787–797. doi: 10.1017/s0952523898154172. [DOI] [PubMed] [Google Scholar]
- Kamermans M, Spekreijse H. Spectral behavior of cone-driven horizontal cells in teleost retina. Progress in Retinal and Eye Research. 1995;14:313–360. [Google Scholar]
- Kamermans M, Spekreijse H. The feedback pathway from horizontal cells to cones in the goldfish retina. Vision Research. 1999;39:2449–2468. doi: 10.1016/s0042-6989(99)00043-7. [DOI] [PubMed] [Google Scholar]
- Kamermans M, Van Dijk BW, Spekreijse H. Lateral feedback from monophasic horizontal cells to cones in carp retina. II. A quantitative model. Journal of General Physiology. 1989a;93:695–714. doi: 10.1085/jgp.93.4.695. [DOI] [PMC free article] [PubMed] [Google Scholar]
- Kamermans M, Van Dijk BW, Spekreijse H. Color opponency in cone-driven horizontal cells in carp retina. Aspecific pathways between cones and horizontal cells. Journal of General Physiology. 1991;97:819–843. doi: 10.1085/jgp.97.4.819. [DOI] [PMC free article] [PubMed] [Google Scholar]
- Kamermans M, Van Dijk BW, Spekreijse H, Zweypfenning RCVJ. Lateral feedback from monophasic horizontal cells to cones in carp retina. I. Experiments. Journal of General Physiology. 1989b;93:681–694. doi: 10.1085/jgp.93.4.681. [DOI] [PMC free article] [PubMed] [Google Scholar]
- Kaneko A, Tachibana M. Effects of γ-aminobutyric acid on isolated cone photoreceptors of the turtle retina. Journal of Physiology. 1986a;373:443–461. doi: 10.1113/jphysiol.1986.sp016057. [DOI] [PMC free article] [PubMed] [Google Scholar]
- Kaneko A, Tachibana M. Blocking effects of cobalt and related ions on the γ-aminobutyric acid-induced current in turtle retinal cones. Journal of Physiology. 1986b;373:463–479. doi: 10.1113/jphysiol.1986.sp016058. [DOI] [PMC free article] [PubMed] [Google Scholar]
- Kraaij DA, Kamermans M, Spekreijse H. Spectral sensitivity of the feedback signal from horizontal cells to cones in goldfish retina. Visual Neuroscience. 1998;15:799–808. doi: 10.1017/s0952523898154184. [DOI] [PubMed] [Google Scholar]
- Kraaij DA, Spekreijse H, Kamermans M. The nature of surround induced depolarizing responses in goldfish cones. Journal of General Physiology. 2000a;115:1–14. doi: 10.1085/jgp.115.1.3. [DOI] [PMC free article] [PubMed] [Google Scholar]
- Kraaij DA, Spekreijse H, Kamermans M. The open- and closed-loop gain-characteristics of the cone/horizontal cell synapse in goldfish retina. Journal of Neurophysiology. 2000b;84:1256–1265. doi: 10.1152/jn.2000.84.3.1256. [DOI] [PubMed] [Google Scholar]
- Leibovic KN, Dowling JE, Kim YY. Background and bleaching equivalence in steady-state adaptation of vertebrate rods. Journal of Neuroscience. 1987;7:1058–1063. doi: 10.1523/JNEUROSCI.07-04-01056.1987. [DOI] [PMC free article] [PubMed] [Google Scholar]
- Marc RE, Stell WK, Bok D, Lam DMK. GABA-ergic pathways in the goldfish retina. Journal of Comparative Neurology. 1978;182:221–246. doi: 10.1002/cne.901820204. [DOI] [PubMed] [Google Scholar]
- Mitarai G, Asano T, Miyake Y. Identification of five types of S-potential and their corresponding generating sites in the horizontal cells of the carp retina. Japanese Journal of Ophthalmology. 1974;18:161–176. [Google Scholar]
- Palacios AG, Varela FJ, Srivastava R, Goldsmith TH. Spectral sensitivity of cones in the goldfish, Carassius auratus. Vision Research. 1998;38:2135–2146. doi: 10.1016/s0042-6989(97)00411-2. [DOI] [PubMed] [Google Scholar]
- Piccolino M, Neyton J, Gerschenfeld HM. Center-surround antagonistic organization in small-field luminosity horizontal cells of turtle retina. Journal of Neurophysiology. 1981;45:363–375. doi: 10.1152/jn.1981.45.3.363. [DOI] [PubMed] [Google Scholar]
- Rodieck RW. The First Step in Seeing. Sunderland, MA, USA: Sinauer Associates; 1998. [Google Scholar]
- Schwartz EA. Depolarization without calcium can release gamma-aminobutyic acid from a retinal neuron. Science. 1987;238:350–355. doi: 10.1126/science.2443977. [DOI] [PubMed] [Google Scholar]
- Spekreijse H, Norton AL. The dynamic characteristics of color-coded S-potentials. Journal of General Physiology. 1970;56:1–15. doi: 10.1085/jgp.56.1.1. [DOI] [PMC free article] [PubMed] [Google Scholar]
- Stell WK, Lightfoot DO. Color-specific interconnections of cones and horizontal cells in the retina of the goldfish. Journal of Comparative Neurology. 1975;159:473–502. doi: 10.1002/cne.901590404. [DOI] [PubMed] [Google Scholar]
- Stell WK, Lightfoot DO, Wheeler TG, Leeper HF. Goldfish retina: functional polarization of cone horizontal cell dendrites and synapses. Science. 1975;190:989–990. doi: 10.1126/science.1188380. [DOI] [PubMed] [Google Scholar]
- Studholme KM, Yazulla S. Localization of GABA and glycine in goldfish retina by electron microscopic postembedding immunocytochemistry: improved visualization of synaptic structures with LR white resin. Journal of Neurochemistry. 1988;17:859–870. doi: 10.1007/BF01216712. [DOI] [PubMed] [Google Scholar]
- Van Dijk BW, Spekreijse H. Color fundamentals deduced from carp ganglion cell responses. Vision Research. 1984;24:211–220. doi: 10.1016/0042-6989(84)90123-8. [DOI] [PubMed] [Google Scholar]
- Verweij J, Kamermans M, Spekreijse H. Horizontal cells feed back to cones by shifting the cone calcium current activation range. Vision Research. 1996;36:3943–3953. doi: 10.1016/s0042-6989(96)00142-3. [DOI] [PubMed] [Google Scholar]
- Weiler R, Wagner H-J. Light-dependent change of cone-horizontal cell interactions in carp retina. Brain Research. 1984;298:1–9. doi: 10.1016/0006-8993(84)91141-7. [DOI] [PubMed] [Google Scholar]
- Werblin FS. Synaptic connections, receptive fields, and patterns of activity in the tiger salamander retina. A simulation of patterns of activity formed at each cellular level from photoreceptors to ganglion cells. Investigative Ophthalmology and Visual Science. 1991;32:459–483. [PubMed] [Google Scholar]
- Werblin FS, Dowling JE. Organization of the retina of the muddpuppy, Necturus maculosus. II. Intracellular recording. Journal of Neurophysiology. 1969;32:339–355. doi: 10.1152/jn.1969.32.3.339. [DOI] [PubMed] [Google Scholar]
- Wu SM. Synaptic transmission in the outer retina. Annual Review of Physiology. 1994;56:141–168. doi: 10.1146/annurev.ph.56.030194.001041. [DOI] [PubMed] [Google Scholar]