

Abstract
We have compared the mRNA distribution of sodium channel alpha subunits known to be expressed during development with the known auxiliary subunits Naβ1.1 and Naβ2.1 and the novel, recently cloned subunit, β3.
In situ hybridisation studies demonstrated high levels of Nav1.2, Nav1.3, Nav1.6 and β3 mRNA at embryonic stages whilst Naβ1.1 and Naβ2.1 mRNA was absent throughout this period.
Naβ1.1 and Naβ2.1 expression occurred after postnatal day 3 (P3), increasing steadily in most brain regions until adulthood. β3 expression differentially decreased after P3 in certain areas but remained high in the hippocampus and striatum.
Emulsion-dipped slides showed co-localisation of β3 with Nav1.3 mRNA in areas of the CNS suggesting that these subunits may be capable of functional interaction.
Co-expression in Xenopus oocytes revealed that β3 could modify the properties of Nav1.3; β3 changed the equilibrium of Nav1.3 between the fast and slow gating modes and caused a negative shift in the voltage dependence of activation and inactivation.
In conclusion, β3 is shown to be the predominant β subunit expressed during development and is capable of modulating the kinetic properties of the embryonic Nav1.3 subunit. These findings provide new information regarding the nature and properties of voltage-gated sodium channels during development.
Voltage-gated sodium channels play an important role in excitable cells. They mediate an increase in Na+ ion permeability thereby transmitting depolarising impulses rapidly throughout cells and cell networks (Catterall, 1984). These molecules are also thought to perform a pivotal role during CNS development since action potential propagation and excitatory transmission are vital in the maturation of neuronal morphological, electrophysiological and molecular properties (Shatz, 1990; Fields & Nelson, 1992; Goodman & Shatz, 1993). Although current evidence strongly supports the functional importance of sodium channels during development, little information presently exists concerning their molecular properties.
Within the mature CNS, voltage-gated Na+ channels have been shown to be composed of three glycoprotein subunits, a pore-forming α subunit and two auxiliary subunits Naβ1.1 and Naβ2.1, which assemble with a subunit stoichiometry of 1α:1Naβ1.1:1Naβ2.1 (Messner & Catterall, 1985). Although ion permeability and voltage sensing is primarily determined by the α subunit, β subunits are important modulators of Na+ channel function. For example, co-expression studies of Naβ1.1 with either neuronal or skeletal muscle α subunits show that this auxiliary subunit increases current density, accelerates gating kinetics and shifts the steady-state inactivation curve in the hyperpolarizing direction (Isom et al. 1992; Bennett et al. 1993; Cannon et al. 1993; Patton et al. 1994). Similarly, expression of Naβ2.1 with neuronal α subunits in oocytes increases current amplitude, modulates gating and increases membrane capacitance (Isom et al. 1995).
In previous studies the expression of Naβ1.1 mRNA in the rat brain has been shown to be a postnatal phenomena. No expression of Naβ1.1 mRNA has been observed in the rat embryo (Patton et al. 1994) and expression has been shown to steadily increase after day 1 (P1), reaching a plateau 2-3 weeks after birth and persisting into adulthood (Sashihara et al. 1995). Northern blot studies have shown that Naβ2.1 mRNA can be detected from embryonic day 20 (E 20) onwards (Isom et al. 1995), whilst specific antibodies recognise Naβ2.1 from P7 onwards (Wood et al. 1995).
Despite this apparent lack of β subunit expression during embryonic development, sodium channel α subunits are expressed and functional Na+ currents can be detected (Mandler et al. 1990). For example, the Nav1.3 subunit has been shown to be a major embryonic voltage-gated sodium channel, expressed extensively during prenatal development. Similarly Nav1.6 mRNA is detectable throughout both development and adulthood (Beckh et al. 1989; Brysch et al. 1991; Felts et al. 1997). On the basis of these findings, therefore, it would appear that other embryonic β subunits may exist, or alternatively, these embryonic α subunits function in the CNS independently of associated β subunits.
With regard to this former suggestion, although Naβ1.1-specific antibodies have been unable to detect specific immunoreactivity in the rat embryo, these antibodies were cross-reactive with a species of approximately 42 kDa suggesting that alternative Naβ1.1-like subunits may be present (Sutkowski & Catterall, 1990). Indeed, Kazen-Gillespie et al. (2000) have recently cloned a Naβ1.1 splice variant, Naβ1.1A, which is expressed in rat embryo, but whose expression falls following birth. Furthermore, we have recently identified a novel β subunit, β3, related to Naβ1.1 exhibiting 50 % homology (Morgan et al. 2000). Since Naβ1.1 and β3 show a complimentary pattern of distribution in the adult rat, in the present study we have compared the ontogeny of β3 with other β subunits and embryonic α subunits.
METHODS
All embryonic and postnatal tissue used in this study were obtained from Sprague-Dawley rats of either sex.
In situ hybridisation
Oligonucleotide probes for in situ hybridisation were designed using the software program OLIGO (Plymouth, MN, USA). The specificity of binding of all oligonucleotide probes used in this study was controlled for by displacement with 100-fold excess cold probe and hybridisation of sense probes. For each gene analysed, a second probe designed to a different region on the gene was also used to act as an additional control. Probes were checked by BLAST searching against all publicly available databases. See Table 1 for oligoprobe sequences.
Table 1.
Sequences of oligonucleotide probes used for in situ hybridisation
| Gene | Accession Number | Sequence (main probe) | Nucleotides (main probe) | Sequence (2nd probe) | Nucleotides (2nd probe) |
|---|---|---|---|---|---|
| Navl. 2 | X03639 | gcagaatccagagacttcagcggggcaggcgggataggtgttttc | 1615–1659 | tccacagtaccaacaacgacagccagagccctacactgcctctta | 7970–8014 |
| Navl. 3 | Y00766 | cctgtctccatcggctctgtggtttccctccaagtgttccctctg | 1935–1980 | gttagaatggacggtgccaccccctgtagttcttcagatttgggc | 267–311 |
| Navl. 6 | L39018 | taatttccacctcagtcgttgcctcagcaggagccgcccgatgtg | 1966–2010 | gcctggttgcggttcccctggaggactttgacccttactatt | 392–433 |
| Naβl.l | M91808 | gcttgatggggtgaagaggggtcgggacagggacagtagtgggc | 1253–1296 | aagtggcctatgtgcaaatcagcaaaaagaagggggcggggcctg | 1174–1218 |
| Naβ2.1 | U37026 | gcagagagtgagaggagacaggacacaggaaggggcttcagggca | 824–868 | ttaggcgggtgggctgtgggaaagggtgattgagggaccaaggac | 105–149 |
| β3 | AJ243395 | ggggaagcaatctgttgaaggcaggcatcttttccaccgtaagcg | 346–390 | gatcttgcgaagccccgatgctggacgattaggtggtcaaaccgt | 23–63 |
Oligonucleotide probes for in situ hybridisation were designed on the software programme OLIGO (Plymouth, MN, USA)
Animals were killed by anaesthetic overdose after the final collection of tissue (Enfluorane, Abbot). All tissue was rapidly dissected and snap-frozen in isopentane on dry ice. Tissue was then sectioned at 5 and 10 μm and thaw mounted onto sterile poly-l-lysine-coated slides (BDH, Dorset, UK). Sections were fixed in 4 % paraformaldehyde (PFA) in sterile phosphate-buffered solution (PBS) and stored under 95 % ethanol at 4 °C until hybridisation.
Oligonucleotide probes (see Table 1 for probe sequences) were 3′ labelled using terminal deoxynucleotidyl transferase (Roche, East Sussex, UK) and [35S]dATP (1000 Ci mmol−1, 5 μl; Amersham, Arlington Heights, IL, USA), and subsequently purified using Sephadex Biospin 6 columns (Biorad, Hertfordshire, UK).
Hybridisation was performed overnight (approximately 18 h) at 42 °C with 35S-labelled probe in hybridisation buffer (4 × standard sodium citrate (SSC), 50 % deionised formamide) at a concentration of 3000 counts min−1μl−1. Following hybridisation, slides were washed in 1 × SSC at room temperature for 30 min and 1 × SSC at 55 °C for 30 min, rinsed in 1 × SSC, 0.1 × SSC and dehydrated. The slides were then air dried and apposed to Kodak β-hyperfilm (Amersham) for 10 days.
Analysis of in situ hybridisation autoradiographs was carried out using an MCID image analyser (model M4, Imageworks, Ontario, Canada). The image was scanned and converted into a digitized image of 256 shades of grey. Comparison with known relative optical density (ROD) values allowed ROD measurements to be made. Measurements were made by selecting a well defined region of interest or by using a template of fixed size over the area. Measurements were taken over the linear range of ROD levels. Averaged ROD readings were presented as means ±s.e.m.
Following in situ hybridisation, slides of interest were coated with LM-1 photographic emulsion (Amersham) for 5 s at 43 °C in a dark room, drained vertically, and dried on a chilled metal plate for 10 min. Slides were subsequently dried horizontally in the dark for 2 h at room temperature and stored at 4 °C for three times the exposure time required for X-ray film. Following development, slides were counter stained using Cresyl Violet. Adjacent sections were analysed under a light microscope.
Electrophysiology
Rat Nav1.3 subunit cDNA engineered into pCI (Promega, Southampton, UK) was linearized using Not1. Rat β3 cDNA engineered into pBG7.2 was linearized using Nde1. Capped cRNA was transcribed in vitro from linearized cDNAs using T7 MessageMachine (Ambion, Abingdon, Oxfordshire, UK).
Xenopus laevis were anaesthetised by immersion in 0.3 % (w/v) 3-amino benzoic acid (Sigma, Poole, UK) and ovarian lobes were removed. Oocytes were dissociated using 0.3 % (w/v) collagenase (Sigma, Poole, UK) in Ca2+-free solution (mm): 82.5 NaCl, 2.5 KCl, 1 MgCl2, 5 Hepes at pH 7.6. Prepared oocytes were microinjected with 50 nl of cRNAs dissolved in water. To ensure that the expression of the β3 subunit was saturating, increasing concentrations were tested and a 10:1 ratio of β3 cRNA to Nav1.2 cRNA was used. Oocytes were incubated at 18 °C in ND96 (mm): 96 NaCl, 2 KCl, 1.8 CaCl2, 1 MgCl2, 5 Hepes at pH 7.6.
Two-electrode voltage-clamp recordings were performed 3-6 days after microinjection of cRNAs using a GeneClamp 500 amplifier (Axon Instruments, CA, USA) interfaced to a Digidata 1200 A/D board with Clampex software (v6, Axon Instruments, CA, USA). Oocytes were continually perfused with ND96 solution. Microelectrodes filled with 3 m KCl had resistances between 0.5 and 1 MΩ.
Voltage pulse protocols were applied from a holding potential of -100 mV. Recovery from inactivation was measured using a recovery protocol consisting of a 1 s inactivating pulse to -10 mV followed by conditioning pulses to -100 mV of increasing duration (1-400 ms) and finally a test pulse to -10 mV. The protocol for measuring voltage dependence of inactivation consisted of a conditioning pulse of 500 ms duration from -120 to +40 mV in 5 mV increments, followed by a test pulse to -10 mV. Currents were filtered at 1 kHz and digitized at 5 kHz using a Digidata 1200 A/D converter. Data analysis was performed using Clampfit software (v6, Axon Instruments, CA, USA) and Origin (v5, Microcal Software, MA, USA). Capacitative, leak and endogenous currents were removed by subtracting currents recorded in the presence of 1μm TTX from those recorded in the absence of TTX.
Inactivation (I) and recovery from inactivation data were fitted with a double exponential equation:
where A1 and A2 are the relative amplitudes of recovery and τ1 and τ2 are the recovery time constants. The voltage dependence of activation was calculated from current-voltage data using the equation g=I/(V - VR), where g is conductance and VR is reversal potential. VR was calculated from the current-voltage relationship of each data set using the equation:
where A is amplitude, V½ is the voltage of half-maximal inactivation, k is the slope factor and VR is reversal potential (based on Smith & Goldin, 1998). Steady-state activation data were fitted with the two state Boltzmann equation:
where g is conductance, V½ is the voltage of half-maximal activation and k is the slope factor. The voltage dependence of inactivation data were fitted with a double two-state Boltzman equation:
where g is conductance A1 and A2 are the relative amplitudes of the two Boltzmann components, V½ is the voltage of half-maximal inactivation and k is the slope factor. Statistical analyses were performed using Student's unpaired t test. Data were assumed to be normally distributed and a significant difference was accepted when the two-tailed P value was less than 0.01. Mean data are presented as ±s.e.m.
RESULTS
In situ hybridisation
In situ hybridisation was carried out to determine the cellular distribution of sodium-channel subunit mRNAs. Control experiments using excess cold probe (not shown) and sense probe in situ hybridisation showed no hybridisation signal. Background levels were examined using sense probes. A second probe designed to a different region on the gene was also used for each subunit to ascertain similar expression patterns. All expression data shown were compiled from examination of X-ray film images and emulsion-dipped sections.
Prenatal development
Whole embryos were cut in the saggittal plane at prenatal stages E10, E15, E17 and E19 (see Fig. 1). At stage E10, strong Nav1.6 mRNA signal could be seen whilst a lower signal for Nav1.2 and β3 message could be discerned although a clear anatomical pattern of brain structures could not be defined. Expression of Nav1.2, Nav1.3, Nav1.6 and β3 transcripts were detected at stages E15 to E19, whilst no signal (above background and in comparison to sense controls) was detected for the auxiliary subunit Naβ1.1 at any embryonic stage. Expression of Naβ2.1 mRNA was absent during embryonic development until stage E19 when it could be detected just above background.
Figure 1. Sagittal section autoradiographs of whole rat embryo after in situ hybridisation with antisense probes for Nav1.2 (a), Nav1.3 (b), Nav1.6 (c), Naβ1.1 (d), Naβ2.1 (e) and β3 (f) at the stages E10, E15, E17 and E19.

Scale bar 7.4 mm. A second probe designed to a different region of the gene for each subunit was used as control. Identical patterns of distribution were observed for both probes for each subunit. The brain at E19 - probe 2 (box) was magnified to show detailed structure whilst the diagram (h) shows the main anatomical regions. Scale bar 2 mm. Sense probe for β3 (g) at E19 shows an example of background levels of hybridisation. Tel, telencephalon; Mesen, mesencephalon; Myelen, myelencephalon; Cor, cortex; Sup coll, superior colliculus; Inf coll, inferior colliculus; Cer flex, cervical flexure; Cereb, cerebellum; Diff hipp, diffentiating hippocampus, Cor plate, cortical plate; Int cor layer, intermediate cortical layer; Cor, cortical neuroepithelium; Olf bulb, olfactory bulb; Acb, nucleus accumbens; Thal nuc, thalamic nuclei; Hypothal nuc, hypothalamic nuclei.
All subunits examined with the exception of Naβ1.1 and Naβ2.1 were present in the telencephalon at E15, E17 and E19. Nav1.2, Nav1.3, Nav1.6 and β3 mRNA were expressed in this area of the cerebral cortex and neocortical neuroepithelium and by E19 the differential layers of the cortex could be visualized. All four subunits were present in the cortical plate and the nucleus accumbens. Naβ2.1 mRNA was expressed just above background levels in the cortical neuroepithelium and the nucleus accumbens at E19. Within the developing hippocampal formation, expression of Nav1.2, Nav1.3, Nav1.6 and β3 message was visible by E19 (see Fig. 2).
Figure 2. Bright field photomicrographs showing cellular distribution of voltage- gated sodium channel mRNAs in the developing hippocampus at embryonic ages E15.

Silver grains demonstrate message for Nav1.2 (a), Nav1.3 (b), Nav1.6 (c), Naβ1.1 (d), Naβ2.1 (e) and β3 (f). Scale bar 10 μm.
In the diencephalon, expression of Nav1.2, Nav1.3, Nav1.6 and β3 mRNA was seen in areas of the differentiating field of the thalamic nuclei by E19. Only Nav1.2 and Nav1.6 mRNA was observed in the differentiating hypothalamus at E15 but by E17, all subunits were present. These subunits were also expressed in moderate to high levels in the mesencephalic areas of the superior and inferior collicululi by E19 (Fig. 1).
In the developing field of the cerebellum, Nav1.2 and Nav1.6 mRNA were expressed in moderate amounts at E19 whilst Nav1.3 and β3 mRNAs were present in high amounts at this time point. All subunits with the exception of Naβ1.1 and Naβ2.1 were also present in the spinal cord at E15, E17 and E19 (not shown).
Adjacent embryonic sections
Since β3 and Nav1.3 mRNA showed similar distribution patterns throughout the embryonic CNS, a more detailed analysis was performed to determine whether these subunits were co-expressed together in neurones. Thinner adjacent sections through the differentiating field of the thalamus and brain stem (5 μm) were alternatively hybridised with β3- or Nav1.3-specific probes. Subsequent analysis revealed the two subunits to be co-localized in these cell groups at embryonic stages E15, E17 and E19; Fig. 3 shows an example of co-localisation at stage E15.
Figure 3. Nav1.3 and β3 mRNAs are co-localized in the same cell groups in rat embryo.

Bright field high-power photomicrographs of 5 μm thick emulsion-dipped sections, demonstrate the co-expression of Nav1.3 (a) and β3 (b) mRNA in specific neurones (arrowheads) and cell groups of the differentiating field of the thalamus and brain stem at stage E15. Red asterisks indicate orientation markers. Scale bar 10 μm.
Postnatal development
Postnatal rat brains were cut in saggittal planes at the stages P1, P3, P9, P14 and adult (Fig. 4, Table 2).
Figure 4. In situ hybridisation of voltage-gated sodium channels on sagittal sections of rat brain.

X-ray autoradiographs of sections after hybridisation with 35S-labelled antisense probe for Nav1.2 (a), Nav1.3 (b), Nav1.6 (c), Naβ1.1 (d), Naβ2.1 (e) and β3 (f) at postnatal stages P1, P3, P9, P14 and adult. Scale bar 5.5 mm.
Table 2.
Detailed in situ hybridisation analysis of the distribution of Nav1.2, Nav1.3, Nav1.6, Naβ1.1, Naβ2.1 and β3mRNAs during postnatal rat brain development
| Nav1.2 | Nav1.3 | Nav1.6 | Naβ1.1 | Naβ2.1 | β3 | ||
|---|---|---|---|---|---|---|---|
| CORTEX | P1 | +++++++ | +++ | ++ | + | 1/2 | ++++ |
| P3 | ++++++ | +++ | ++ | + | + | ++++ | |
| P9 | ++++++++ | ++ | +++ | ++ | ++ | ++++ | |
| P14 | +++++ | 1/2 | ++ | +++ | ++ | +++ | |
| Adult | ++ | 0 | ++ | ++ | +++ | ++ | |
| STRIATUM | P1 | +++ | +++ | ++ | + | 1/2 | +++++ |
| P3 | ++++ | +++ | ++ | + | + | ++++++++ | |
| P9 | +++++ | ++ | +++ | + | ++ | +++ | |
| P14 | +++ | + | + | + | ++ | ++++ | |
| Adult | ++ | 1/2 | ++ | + | +++ | +++ | |
| THALAMUS | P1 | ++++++ | ++++ | ++ | + | 1/2 | +++++ |
| P3 | +++++++ | +++ | ++ | ++ | + | ++++ | |
| P9 | +++++ | ++ | +++ | +++ | ++ | +++ | |
| P14 | +++++ | 1/2 | ++ | +++++ | ++ | ++ | |
| Adult | ++ | 0 | ++ | +++ | +++ | + | |
| HIPPOCAMPUS CA1 | P1 | ++ | ++ | ++ | 1/2 | 1/2 | ++++ |
| P3 | ++ | ++ | ++ | + | + | ++++ | |
| P9 | ++ | ++ | ++ | ++ | + | ++++++ | |
| P14 | ++++ | + | ++ | +++ | + | +++++++ | |
| Adult | ++ | 1/2 | +++ | ++ | +++ | ++++++ | |
| HIPPOCAMPUS CA2 | P1 | — | — | — | — | — | — |
| P3 | +++ | 1/2 | ++ | + | 1/2 | ++++ | |
| P9 | +++ | 1/2 | ++ | ++ | + | ++++++ | |
| P14 | ++++ | 0 | ++ | +++ | + | ++++++ | |
| Adult | +++ | 0 | +++ | ++ | +++ | ++++++ | |
| HIPPOCAMPUS CA3 | P1 | + | 1/2 | ++ | 1/2 | 0 | ++++ |
| P3 | ++ | 1/2 | ++ | 1/2 | 1/2 | ++++ | |
| P9 | +++ | 1/2 | ++ | ++ | + | ++++++ | |
| P14 | +++ | 0 | ++ | +++ | + | ++++++ | |
| Adult | ++ | 0 | +++ | +++ | +++ | ++++++ | |
| Dentate gyrus | P1 | + | + | ++ | 0 | 0 | ++++ |
| P3 | ++ | + | ++ | 1/2 | 0 | ++++ | |
| P9 | +++ | + | ++ | + | 1/2 | +++++ | |
| P14 | +++ | 1/2 | +++ | ++ | 1/2 | +++++ | |
| Adult | ++ | 1/2 | +++ | + | +++ | ++++ | |
| CEREBELLUM | |||||||
| Molecular layer | P1 | — | — | — | — | — | — |
| P3 | — | — | — | — | — | — | |
| P9 | — | — | — | — | — | — | |
| P14 | + | 0 | ++ | ++ | + | 0 | |
| Adult | + | 0 | + | ++ | + | 0 | |
| Granular layer | P1 | — | — | — | — | — | — |
| P3 | — | — | — | — | — | — | |
| P9 | — | — | — | — | — | — | |
| P14 | +++++ | 0 | ++ | + | + | 0 | |
| Adult | ++++ | 0 | ++ | ++ | ++ | 0 | |
| Purkinje layer | P1 | ++ | ++ | +++ | 0 | 0 | ++ |
| P3 | ++ | ++ | ++ | 0 | 0 | + | |
| P9 | ++ | + | ++ | ++ | 0 | 1/2 | |
| P14 | ++ | 0 | +++ | ++ | + | 0 | |
| Adult | + | 0 | +++ | ++ | +++ | 0 | |
In situ hybridisation signal observed for 35S labelled oligonucleotide probes to Nav1.2, Nav1.3, Nav1.6, Naβ1.1, Naβ2.1 and β3 mrna on rat brain sections at postnatal stages P1, P3, P9, P14 and adult. Data were collected emulsion-dipped sections and autoradiographs, were rated for relative optical density and scored with respect to an arbitrary scale: ++++++++, +++++++, very abundant; ++++++, +++++, abundant; ++++, +++, moderate; ++, +, low; 1/2, just above background; 0, not detectable; —, not ascertained as area undeveloped. n = 5.
Figure 5. Bright field emulsion photomicrographs showing mRNA expression for voltage-gated sodium channel subunits in the hippocampal CA1 neurones at ages P1, P3, P9, P14 and adult.

Silver grains demonstrate message for Nav1.2 (a), Nav1.3 (b), Nav1.6 (c), Naβ1.1 (d), Naβ2.1 (e) and β3 (f). Scale bar 20 μm.
Cortex
Levels of Nav1.2 and Nav1.3 were seen to decrease with time in the cortex whilst Nav1.6 transcript expression appeared to remain constant throughout the time points studied. Thus, Nav1.2 mRNA was the most abundant α subunit present from P1-P9 with expression decreasing by adulthood. Similarly, β3 was found to be the most abundant β subunit in the cortex from P1-P9 with levels falling by half that by adulthood. In contrast to β3, Naβ1.1 mRNA steadily increased from very low levels at P1, peaking at day 14. Naβ2.1 mRNA also increased steadily, reaching maximum levels in the adult.
Hippocampus
The expression of Nav1.2, Naβ1.1, Naβ2.1 and β3 mRNAs all appeared to increase in the hippocampal layers during postnatal development. For example Nav1.2 and Naβ1.1 reached maximum levels at P14 whilst Naβ2.1 mRNA expression peaked at adult and β3 mRNA expression rose to maximum at P9. At all time points, β3 mRNA was the most abundant subunit in CA1, CA3 and dentate gyrus (Fig. 6, Fig. 7, Fig. 8, Fig. 9, Table 2). In contrast, Nav1.3 and Nav1.6 mRNA expression remained fairly constant at all the time points. Dark field photographs in the adult show the distribution of these subunits in the different layers of the hippocampus as well as the cells between the main layers.
Figure 6. Bright field emulsion photomicrographs showing mRNA expression for voltage-gated sodium channel subunits in the hippocampal CA3 neurones at ages P1, P3, P9, P14 and adult.

Silver grains demonstrate message for Nav1.2 (a), Nav1.3 (b), Nav1.6 (c), Naβ1.1 (d), Naβ2.1 (e) and β3 (f). Scale bar 20 μm.
Figure 7. Bright field emulsion photomicrographs showing mRNA expression for voltage-gated sodium channel subunits in the hippocampal dentate gyrus neurones at ages P1, P3, P9, P14 and adult.

Silver grains demonstrate message for Nav1.2 (a), Nav1.3 (b), Nav1.6 (c), Naβ1.1 (d), Naβ2.1 (e) and β3 (f). Scale bar 20 μm.
Figure 8. Dark field emulsion photomicrographs showing mRNA expression for voltage-gated sodium channel subunits in the hippocampal formation in the adult.

Silver grains demonstrate message for Nav1.2 (a), Nav1.3 (b), Nav1.6 (c), Naβ1.1 (d), Naβ2.1 (e) and β3 (f). Scale bar 300 μm.
Figure 9. Co-expression of Nav1.3 with β3 subunit modifies inactivation kinetics.
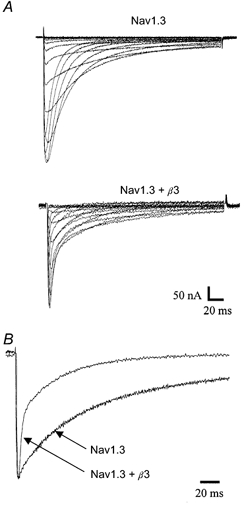
A, Na+ currents recorded from Xenopus oocytes expressing Nav1.3 and Nav1.3 +β3. Na+ currrents were evoked by applying depolarizing pulses in 5 mV increments between -60 and +40 mV from a holding potential of -100 mV. B, normalized Na+ currents from oocytes expressing Nav1.3 and Nav1.3 +β3. Currents evoked by a pulse to -10 mV were normalized to peak amplitudes.
Striatum
The expression of Nav1.3 and β3 mRNAs appeared to decrease in the striatum during postnatal development whilst Nav1.6 and Naβ1.1 mRNA remained constant, Naβ1.1 exhibiting extremely low levels of expression. Nav1.2 expression increased to a maximum at P9 after which levels decreased to a mimimum level by adulthood (Table 2). Similarly, Nav1.3 transcripts steadily decreased during development becoming almost absent by adult whilst β3 mRNA decreased from a maximum level at P3, to approximately 50 % in the adult. In contrast, Naβ2.1 expression increased steadily to maximum in adulthood. Although β3 mRNA decreased over the time period, its levels were abundant in the adult, and similar to those of Naβ2.1 at this time point (Table 2).
Thalamus
Thalamic nuclei expressed high levels of Nav1.2, Nav1.3 and β3 mRNA at P1. Expression of each of these subunits then decreased to lower levels along the time course. Nav1.3 and β3 decreased close to absence in this region by the adult stage. In contrast, both Naβ1.1 and Naβ2.1 increased expression levels from P1 to adult. Naβ1.1 expression peaked at P14 and decreased to levels similar to P9 by adult, whilst Naβ2.1 reached maximum in the adult. Nav1.6 mRNA expression remained constant (Table 2).
Cerebellum
Within the cerebellum, Nav1.2 mRNA signal was evident in the Purkinje cell layer at P1. The signal persisted throughout the time points and was also present in the granular layer by adulthood. Nav1.3 mRNA was found in the Purkinje cell layer at P1 and P3 but decreased by P9 and was absent in the adult in all cell types. Nav1.6 transcripts were present in high levels in the Purkinje cell layer and stayed high through development. Signal was also observed in the granular cell layer in the adult. Naβ1.1 and β3 mRNAs were absent in all cells of the cerebellum until P9 when Naβ1.1 mRNA signal could be seen in the Purkinje cells. By P14 both the β subunits were present in the Purkinje and granular cells. β3 mRNA expression resembled that of Nav1.3, signal in the Purkinje cells decreasing by P9 and was absent in the adult.
Electrophysiology
Since the present study demonstrates that Nav1.3 and β3 are expressed together in individual neurones during embryonic development, and since little information currently exists in relation to the modulation of Nav1.3 by β subunits, we decided to test whether β3 was capable of functional interaction with Nav1.3 when expressed in Xenopus oocytes.
Oocytes expressing Nav1.3 subunits alone showed Na+ currents with slow rates of inactivation which were described by two exponential components (τ1 = 1.1 ms and τ2 = 60 ms at -10 mV). Co-expression of saturating concentrations of β3 with the Nav1.3 subunit cRNAs altered the inactivation time course. β3 had no effect on the time constants of decay of Nav1.3, but the relative amplitudes of the exponential components were significantly different (P < 0.01Fig. 9A, Table 3). The percentage of current described by the fast time constant of inactivation at -10 mV was 6.5 and 29 % for Nav1.3 and Nav1.3 +β3, respectively (Fig. 9B, Table 3).
Table 3.
Inactivation properties of Navl.3 co-expressed with β3
| Inactivation time course | Recovery from inactivation | Voltage-dependence of activation | Voltage-dependence of inactivation | ||||||||||||||
|---|---|---|---|---|---|---|---|---|---|---|---|---|---|---|---|---|---|
| Subunit | τ1 (ms) | τ2 (ms) | % fast | n | τ1 (ms) | τ2 (ms) | %fast | n | V1/2 (mV) | k (mV) | n | Component 1 | Component 2 | %comp1 | n | ||
| V1/2 (mV) | k (mV) | V1/2 (mV) | k (mV) | ||||||||||||||
| Navl 3 | 1.1 ± 0.1 | 60 ± 4.8 | 6.5 ± 2 | 4 | 3.4 ± 0.2 | 139 ± 4 | 26 ± 1 | 4 | −12.3 ± 0.1 | −4.8 ± 0.1 | 5 | −42.8 ± 1.1 | 5.6 ± 0.5 | −22.2 ± 0.3 | 3.8 ± 0.2 | 35 ± 3 | 5 |
| Navl. 3 | 1.4 ± 0.2 | 24.7 ± 4.3 | 29 ± 1 | 5 | 5.5 ± 0.3 | 126 ± 26 | 70 ± 3 | 4 | −20.6 ± 0.1 | −6.1 ± 0.1 | 5 | −39.8 ± 0.5 | 6.5 ± 0.3 | −16.9 ± 0.9 | 2.3 ± 0.7 | 86 ± 3 | 5 |
| +β3 | |||||||||||||||||
Percentage fast is the percentage of current represented by the fast time constant. Percentage component 1 is the percentage of conductance represented by component 1 of the double Boltzmann function.
The rate of recovery from inactivation of Nav1.3 was also significantly (P < 0.01) altered by co-expression of β3. The time course of recovery from inactivation of Nav1.3 and Nav1.3 +β3 were described by similar time constants (for Nav1.3, τ1 = 13.9 ms, τ2 = 185 ms) (Table 3). However, recovery of Nav1.3 +β3 was described predominantly by the fast time constant (70 % of total current) compared with Nav1.3 expressed alone (29 % of total current). Thus, β3 changed the equilibrium between the two gating modes, shifting the equilibrium to fast gating mode (Fig. 10A).
Figure 10.

A, effect of β3 on time course of recovery from inactivation of Nav1.3. Peak current amplitudes measured during the test pulse were normalized to the peak currents evoked during the inactivating pulse and plotted as a function of conditioning pulse duration. Data were fitted with a double exponential equation. Nav1.3, ○; Nav1.3 +β3, •. See Table 2 for fit parameters. Inset illustrates typical Nav1.3 currents evoked following conditioning pulses of 20 and 200 ms duration. Following a 20 ms recovery period the Nav1.3 current is dominated by the rapidly inactivating component, while after a 200 ms recovery period there is also a large slowly inactivating component. B, effect of β3 on voltage dependence of activation and inactivation. Conductance-voltage relationships for steady-state activation and inactivation. For steady-state inactivation, peak current amplitudes evoked by the test pulse were normalized to the maximum peak current amplitude and plotted as a function of conditioning pulse potential. Data were fitted with a double Boltzmann function. The steady-state activation data were normalized to peak amplitudes and fitted with a single Boltzmann function. Nav1.3, •; Nav1.3 +β3, ○. See Table 2 for fit parameters. Inset illustrates typical Nav1.3 currents evoked following conditioning pulses to -40 and -70 mV are shown. Following a -70 mV pulse both fast and slow inactivating components are present, while after a -40 mV pulse only the slow inactivating component can be detected.
Co-expression of Nav1.3 with β3 caused a significant (P < 0.01) change in the voltage dependence of activation and inactivation. In the presence of β3 the voltage of half-maximal activation (V½) of Nav1.3 was shifted in the hyperpolarizing direction by 8 mV (Table 3). The voltage dependence of inactivation for Nav1.3 was best described by a double Boltzmann function with half-maximal inactivation (V½) values of -22 and -43 mV (Table 3). The voltage dependence of Nav1.3 co-expressed with β3 subunit was also described by a double Boltzmann function with similar V½ and slope values (Table 3). However, the relative proportion of the two Boltzmann components was altered in the presence of β3, having a greater proportion of the component represented by the more negative V½ value (Fig. 10B, Table 3).
DISCUSSION
In the present study we report the ontogeny of the voltage-gated sodium channel subunits Nav1.2, Nav1.3, Nav1.6, Naβ1.1 and Naβ2.1 and compare it to that of the novel β subunit, β3. Nav1.2, Nav1.3 and Nav1.6 were chosen for study since they have been previously reported to be present during development (Beckh et al. 1989; Brysch et al. 1991; Felts et al. 1997). In contrast, previous evidence suggests that the auxiliary subunits Naβ1.1 and Naβ2.1 are not expressed during embryonic development (Sutkowski & Catterall, 1990; Wood et al. 1995) although recent preliminary data would suggest that a splice variant of Naβ1.1, Naβ1.1A, is present during this period (Kazen-Gillespie et al. 2000). Thus on the basis of our present knowledge, it would appear that the molecular architecture of neuronal voltage-gated sodium channels differs between the mature and immature CNS. Since action potential propagation and excitatory transmission are believed to perform a fundamental role in the maturation of neuronal morphological, electrophysiological and molecular properties (Shatz, 1990; Fields & Nelson, 1992; Goodman & Shatz, 1993), an understanding of the architecture and resultant properties of voltage-gated sodium channels may provide an important insight into the mechanisms which contribute to CNS development.
Embryonic development
In agreement with previous studies, high levels of Nav1.2 and Nav1.3 mRNA and moderate levels of Nav1.6 mRNA were detected in the embryonic rat CNS (Brysch et al. 1991, Felts et al. 1997). In addition, in accordance with immunocytochemical and gene expression studies, Naβ1.1 and Naβ2.1 immunoreactivity and mRNA were found to be absent in the rat embryo (Sutkowski & Catterall, 1990; Patton et al. 1994; Wood et al. 1995). In contrast, β3 mRNA was highly expressed throughout the prenatal CNS with a hybridisation signal temporally similar to that of both Nav1.2 and Nav1.3 subunits.
On the basis of these observations, it is possible that β3 may couple with Nav1.2 and/or Nav1.3 subunits during development to form a functional sodium channel complex. In a recent study, Morgan et al. (2000) showed that β3 can indeed couple to Nav1.2 when co-expressed in Xenopus oocytes. In this former study, β3 was shown to modulate the properties of the Nav1.2 channel to a different extent from that seen when Nav1.2 was expressed with the Naβ1.1 subunit. β3 caused a hyperpolarizing in the voltage dependence of inactivation and modulated the Nav1.2 by increasing the number of channels operating in the fast gating mode (Morgan et al. 2000).
At present there is some confusion regarding the modulatory role Naβ1.1 may perform on Nav1.3 kinetics. For example, Patton et al. (1994) show Nav1.3 modulation by Naβ1.1 in Xenopus oocytes whilst Naβ1.1 caused no significant changes in kinetics of human Nav1.3 when co-expressed in HEK cells (Clare et al. 1999). Thus, we decided to investigate whether β3 may perform a modulatory role upon Nav1.3 activity. Gating of Nav1.3 has been shown to occur by two modes, fast and slow, which are reflected by different inactivation rates (Moorman et al. 1990; Joho et al. 1990). Heterologous expression in Xenopus oocytes showed that co-expression of β3 changed the equilibrium between the two gating modes of the Nav1.3 subunit, favouring the fast over the slower gating mode. This resulted in a more rapid time course of inactivation and recovery from inactivation and a hyperpolarizing shift in the voltage dependence of activation and inactivation. Thus β3 modulates Nav1.3 in a similar manner as Nav1.2 when expressed in Xenopus oocytes. The electrophysiological properties of Nav1.3 co-expressed with β3 are similar to those reported for native Nav1.3 channels present in DRG after peripheral axotomy, in particular the fast recovery kinetics (Black et al. 1999).
On the basis of these findings it would appear that β3 is capable of functional interaction with the Nav1.3 subunit. Given that these two subunits exhibit a similar time course of expression during the development of the rat CNS it is possible that β3 may form a multimeric complex with Nav1.3 during development. The evidence in favour of this suggestion is further supported by co-localisation studies, which clearly demonstrate that β3 and Nav1.3 mRNA are expressed in the same groups of neurone.
However, since Naβ2.1 subunit expression appears absent during these stages of development, it would appear that voltage-gated sodium channels in the embryo may function in the absence of this accessory subunit. Alternatively it is possible that other presently unidentified Naβ2.1-like molecules exist. Similarly, one might argue that lack of complete correlation between β3 and Nav1.6 might suggest that Nav1.6 subunit can act independently of β subunits or that other Naβ1.1-like subunits such as Naβ1.1A may perform this function.
Postnatal development
The postnatal expression pattern exhibited by each of the above α subunits is remarkably distinctive in nature possibly underlining the different functional roles performed by these channels. For example Nav1.2 mRNA levels appear to increase from P9 to P14 before falling to reach a plateau level by adulthood. In contrast, Nav1.3 mRNA levels decrease from P1 ultimately disappearing in many areas of the adult brain (Beckh et al. 1989; Brysch et al. 1991), whilst Nav1.6 levels appeared to remain constant throughout development (Felts et al. 1997).
As shown previously Naβ1.1 mRNA first appears around P3 (Sashihara et al. 1995) with expression increasing rapidly in most brain areas to reach a maximum by P14. Naβ2.1 mRNA expression was also found to increase throughout the CNS between P3 and adulthood consistent with biochemical studies showing an increase in disulphide bond formation of β subunits (Scheinman et al. 1989). From these results, it can be seen that Naβ1.1 and Naβ2.1 have some synchrony in their regional and temporal expression.
In marked contrast, β3 mRNA is expressed at very high levels throughout the CNS at P1 with levels decreasing in most areas along the time points measured. Thus Naβ1.1 and β3 appear to exhibit a very striking complementary pattern in temporal expression during development. The distribution of Naβ1.1 and β3 following stage P9 becomes more complimentary and distinct differences are evident by adulthood as previously shown (Morgan et al. 2000).
The continued high level of β3 expression in discrete areas of the mature CNS in the absence of Nav1.3 expression suggests that β3 performs a greater role than simply acting as a molecular chaperone to embryonic α subunits. Indeed the ability of β3 to functionally modulate the properties of the Nav1.2 subunit suggests that the molecular and functional complexity of voltage-gated sodium channels within the adult CNS is far greater than hitherto considered.
Functional importance
Expression of Naβ1.1 and Naβ2.1 are late events, which occur during development and appear to correlate with the assembly of mature sodium channel complexes (Sashihara et al. 1995). However since researchers (Mandler et al. 1990) have recorded sodium currents in rat at embryonic days 13, 14 and 15 it would appear that functional sodium channels are indeed present during stages of embryonic development where Naβ1.1 or Naβ2.1 expression is absent. Alcaraz et al. (1997) have shown previously that the amount of internalisation of sodium-channel saxitoxin binding sites decreases with development. Since this time course appears similar to Naβ1.1 subunit expression, the authors have suggested that Naβ1.1 may stabilize α subunits at the cell surface (Bonhaus et al. 1996).
Levels of Nav1.2, Naβ1.1 and Naβ2.1 mRNA rise during the first postnatal week, a time when neurite outgrowth and synaptogenesis are greatest (Altman, 1972; Crain et al. 1973; Schreyer & Jones, 1982). Naβ1.1, Naβ2.1 and β3 contain a single extracellular Ig-like domain with structural similarity to the neural cell adhesion molecule (CAM) myelin Po (Xiao et al. 1999; Morgan et al. 2000). However, the Ig domain protein sequences of the β subunits are only partially homologous. For example, only Naβ2.1 has amino acid sequence similarity with the neuronal cell adhesion protein contactin (Isom et al. 1995). It has been hypothesised that Naβ1.1 and Naβ2.1 may participate in cell-to-cell/matrix interactions and sodium-channel localisation during development (Isom & Catterall, 1996). As β3 also possesses an Ig-fold sequence similarity, it can be postulated that β3 may also aid channel localization in neurones.
The time course of expression of Naβ1.1 and Naβ2.1 parallels the onset of myelination. During myelination, the distribution of sodium channels changes from a diffuse uniform expression throughout the axon to discrete clusters at the nodes of Ranvier (Kaplan et al. 1997). Tenascin-R, a CNS extracellular matrix molecule, has been localized to the nodes of Ranvier (Bartsch et al. 1993) and has been shown to interact functionally with Naβ1.1 and Naβ2.1 immunoglobulin domains (Srinivasan et al. 1998; Xiao et al. 1999). Thus, these β subunits may be involved in clustering sodium channels at the nodes of Ranvier during myelination although the importance of this interaction is disputed since Tenascin-R deficient mice exhibit normal Na+ channel distribution and expression at the nodes of Ranvier (Weber et al. 1999). From the present study it can be seen that the time course of expression of β3 does not coincide with myelination and is therefore likely to have a different role.
Thus one may envisage a situation where the expression of different β subunits in different parts of the CNS serves to provide site-specific localization of the sodium-channel complex in accord with the requirements of the specific neurones in question. In conclusion, this study shows that β subunit expression is regulated independently of α subunit expression throughout development. The β3 subunit appears to be highly expressed in all areas of the CNS during both pre- and postnatal development, decreasing to absence in some areas but remaining high elsewhere. This observation suggests that β3 may have differing regional roles during development and may couple to α subunits at different times to perform different functions. These findings serve to extend our understanding of the role performed by sodium channels during development, indicating that there is considerable complexity and diversity of expression pattern, which may underlie functional significance.
References
- Alcaraz G, Sampo B, Tricaud N, Giraud P, Martin-Eauclaire MF, Couraud F, Dargent B. Down-regulation of voltage-dependant sodium channels coincides with a low expression of alphabeta1 subunit complexes. Brain Research. Molecular Brain Research. 1997;51:143–153. doi: 10.1016/s0169-328x(97)00232-5. [DOI] [PubMed] [Google Scholar]
- Altman J. Postnatal development in the cerebellar cortex in the rat. III Maturation and the components of the granular layer. Journal of Comparative Neurology. 1972;145:465–514. doi: 10.1002/cne.901450403. [DOI] [PubMed] [Google Scholar]
- Bartsch U, Pesheva P, Raff M, Schachner M. Expression of janusin (J1–160/180) in the retina and optic nerve of the developing and adult mouse. Glia. 1993;9:57–69. doi: 10.1002/glia.440090108. [DOI] [PubMed] [Google Scholar]
- Beckh S, Noda M, Lubbert H, Numa S. Differential regulation of three sodium channel messenger RNAs in the rat central nervous system during development. EMBO Journal. 1989;8:3611–3616. doi: 10.1002/j.1460-2075.1989.tb08534.x. [DOI] [PMC free article] [PubMed] [Google Scholar]
- Bennett P, Makita N, George A. A molecular basis for gating mode transitions in human skeletal muscle Na+ channels. FEBS Letters. 1993;326:21–24. doi: 10.1016/0014-5793(93)81752-l. [DOI] [PubMed] [Google Scholar]
- Black JA, Cummins TR, Plumpton C, Chen YH, Hormuzdiar W, Clare JJ, Waxman SG. Upregulation of a silent sodium channel after peripheral, but not central, nerve injury in DRG neurons. Journal of Neurophysiology. 1999;82:2776–2785. doi: 10.1152/jn.1999.82.5.2776. [DOI] [PubMed] [Google Scholar]
- Bonhaus DW, Herman RC, Brown CM, Cao Z, Chang LF, Loury DN, Sze P, Zhang L, Hunter J. The Naβ1.1 sodium channel subunit modifies the interactions of neurotoxins and local aneasthetics with the rat brain A β sodium channel in isolated membranes but not in intact cells. Neuropharmacology. 1996;35:605–613. doi: 10.1016/0028-3908(96)84631-4. [DOI] [PubMed] [Google Scholar]
- Brysch W, Creutzfeldt OD, Luno K, Schlingensiepen R, Schlingensiepen KH. Regional and temporal expression of sodium channel messenger RNAs in the rat brain during development. Experimental Brain Research. 1991;86:562–567. doi: 10.1007/BF00230529. [DOI] [PubMed] [Google Scholar]
- Cannon S, McClatchey A, Gusella J. Modification of the Na+ current conducted by the rat skeletal muscle alpha subunit by coexpression with a human brain subunit. Pflügers Archiv. 1993;423:155–157. doi: 10.1007/BF00374974. [DOI] [PubMed] [Google Scholar]
- Catterall WA. The molecular basis of neuronal excitability. Science. 1984;223:653–661. doi: 10.1126/science.6320365. [DOI] [PubMed] [Google Scholar]
- Clare JJ, Dale TJ, Xie X, Peakman TC, Chen Y. Cloning and functional analysis of the type III Na+ channel from human brain. Annals of the New York Academy of Sciences. 1999;868:80–83. doi: 10.1111/j.1749-6632.1999.tb11276.x. [DOI] [PubMed] [Google Scholar]
- Crain B, Cotman C, Taylor D, Lynch D. A quantitative electron microscopic study of synaptogenesis in the dentate gyrus of the rat. Brain Research. 1973;63:195–204. doi: 10.1016/0006-8993(73)90088-7. [DOI] [PubMed] [Google Scholar]
- Felts PA, Yokoyama S, Dib-Hajj S, Black JA, Waxman SG. Sodium channel β-subunit mRNAs I, II, III, NaG, Na6 and hNE (PN1): different expression patterns in developing rat nervous system. Brain Research. Molecular Brain Research. 1997;45:71–82. doi: 10.1016/s0169-328x(96)00241-0. [DOI] [PubMed] [Google Scholar]
- Fields RD, Nelson PG. Activity-dependent development of the vertebrate nervous system. International Reviews in Neuroscience. 1992;34:133–214. doi: 10.1016/s0074-7742(08)60098-7. [DOI] [PubMed] [Google Scholar]
- Goodman CS, Shatz CJ. Developmental mechanisms that generate precise patterns of neuronal connectivity. Cell. 1993;72:S77–98. doi: 10.1016/s0092-8674(05)80030-3. [DOI] [PubMed] [Google Scholar]
- Isom LL, Catterall WA. Na+ channel subunits and Ig domains. Nature. 1996;383:307–308. doi: 10.1038/383307b0. [DOI] [PubMed] [Google Scholar]
- Isom LL, De-Jongh KS, Patton DE, Reber BF, Offord J, Charbonneau H, Walsh K, Goldin AL, Catterall WA. Primary structure and functional expression of the beta 1 subunit of the rat brain sodium channel. Science. 1992;256:839–842. doi: 10.1126/science.1375395. [DOI] [PubMed] [Google Scholar]
- Isom LL, Ragsdale DS, De-Jongh KS, Westenbroek RE, Reber BF, Scheuer T, Catterall WA. Structure and function of the beta 2 subunit of brain sodium channels, a transmembrane glycoprotein with a CAM motif. Cell. 1995;83:433–442. doi: 10.1016/0092-8674(95)90121-3. [DOI] [PubMed] [Google Scholar]
- Joho RH, Moorman JR, Vandongen AM, Kirsch GE, Silberberg H, Schuster G, Brown AM. Toxin and kinetic profile of rat brain type III sodium channels expressed in Xenopus oocytes. Brain Research. Molecular Brain Research. 1990;7:105–113. doi: 10.1016/0169-328x(90)90087-t. [DOI] [PubMed] [Google Scholar]
- Kaplan MR, Meyer-Franke A, Lambert S, Bennet V, Duncan ID, Levinson SR, Barres BA. Induction of sodium channel clustering by oligodendrocytes. Nature. 1997;386:724–728. doi: 10.1038/386724a0. [DOI] [PubMed] [Google Scholar]
- Kazen-Gillespie KA, Ragsdale DS, D'Andrea MR, Mattei LN, Rogers KE, Isom LL. Cloning, localization and functional expression of sodium channel Naβ1. 1A subunits. Journal of Biological Chemistry. 2000;275:1079–1088. doi: 10.1074/jbc.275.2.1079. [DOI] [PubMed] [Google Scholar]
- Mandler RN, Schaffner AE, Novotny EA, Lange GD, Smith SV, Barker JL. Electrical and chemical excitability appear one week before birth in the embryonic rat spinal cord. Brain Research. 1990;522:46–54. doi: 10.1016/0006-8993(90)91575-2. [DOI] [PubMed] [Google Scholar]
- Messner DJ, Catterall WA. The sodium channel from rat brain. Separation and characterisation of subunits. Journal of Biological Chemistry. 1985;260:10597–10604. [PubMed] [Google Scholar]
- Moorman JR, Kirsch GE, Vandongen AM, Joho RH, Brown AM. Fast and slow gating of sodium channels encoded by a single mRNA. Neuron. 1990;4:243–252. doi: 10.1016/0896-6273(90)90099-2. [DOI] [PubMed] [Google Scholar]
- Morgan K, Stevens EB, Shah BS, Cox PJ, Dixon AK, Lee K, Richardson PJ, Pinnock RD, Hughes J, Mizuguchi K, Jackson AP. A novel auxiliary subunit of the voltage-sensitive sodium channel modulates channel gating with distinct kinetics. Proceedings of the National Academy of Sciences of the USA. 2000;97:2308–2313. doi: 10.1073/pnas.030362197. [DOI] [PMC free article] [PubMed] [Google Scholar]
- Patton DE, Isom LL, Catterall WA, Goldin AL. The adult rat brain beta 1 subunit modifies activation and inactivation gating of multiple sodium channel alpha subunits. Journal of Biological Chemistry. 1994;269:17649–17655. [PubMed] [Google Scholar]
- Sashihara S, Oh Y, Black JA, Waxman SG. Na+ channel Naβ1. 1 subunit mRNA expression in developing rat central nervous system. Brain Research. Molecular Brain Research. 1995;34:239–250. doi: 10.1016/0169-328x(95)00168-r. [DOI] [PubMed] [Google Scholar]
- Scheinman RI, Auld VJ, Goldin AL, Davidson N, Dunn RJ, Catterall WA. Developmental regulation of sodium channel expression in the rat forebrain. Journal of Biological Chemistry. 1989;264:10660–10666. [PubMed] [Google Scholar]
- Schreyer DJ, Jones EG. Growth and target finding by axons of the corticospinal tract in prenatal and postnatal rats. Neuroscience. 1982;7:1837–1853. doi: 10.1016/0306-4522(82)90001-x. [DOI] [PubMed] [Google Scholar]
- Shatz CJ. Impulse activity and the patterning of connections during CNS development. Neuron. 1990;5:745–756. doi: 10.1016/0896-6273(90)90333-b. [DOI] [PubMed] [Google Scholar]
- Smith RD, Goldin AL. Functional analysis of the Rat. I. Sodium channel in Xenopus oocytes. Journal of Neuroscience. 1998;18:811–820. doi: 10.1523/JNEUROSCI.18-03-00811.1998. [DOI] [PMC free article] [PubMed] [Google Scholar]
- Srinivasan J, Schachner M, Catterall WA. Interaction of voltage-gated sodium channels with the extracellular matrix molecules tenascin-C and tenascin-R. Proceedings of the National Academy of Sciences of the USA. 1998;95:15753–15757. doi: 10.1073/pnas.95.26.15753. [DOI] [PMC free article] [PubMed] [Google Scholar]
- Sutkowski EM, Catterall WA. Naβ1. 1 subunits of sodium channels. Studies with subunit-specific antibodies. Journal of Biological Chemistry. 1990;265:12393–12399. [PubMed] [Google Scholar]
- Weber P, Bartsch U, Rasband MN, Czaniera R, Lang Y, Bluethmann H, Margolis RU, Levinson SR, Shrager P, Montag D, Schachner M. Mice deficient for tenascin-R display alterations of the extracellular matrix and decreased axonal conduction velocities in the CNS. Journal of Neuroscience. 1999;19:4245–4262. doi: 10.1523/JNEUROSCI.19-11-04245.1999. [DOI] [PMC free article] [PubMed] [Google Scholar]
- Wood MR, De-Jongh KS, Catterall WA, Pfenniger KH. Na+ channel changes in the growth cone and developing nerve terminal. Brain Research Developmental Brain Research. 1995;88:194–203. doi: 10.1016/0165-3806(95)00103-k. [DOI] [PubMed] [Google Scholar]
- Xiao ZC, Ragsdale DS, Malhotra JD, Mattei LN, Braun PE, Schachner M, Isom LL. Tenascin-R is a functional modulator of sodium channel β subunits. Journal of Biological Chemistry. 1999;247:26511–26517. doi: 10.1074/jbc.274.37.26511. [DOI] [PubMed] [Google Scholar]