

Abstract
Current clamp studies using two patch electrodes and morphological observations have been performed in guinea-pig mesenteric arterioles to evaluate intercellular electrical couplings.
In electron micrographs, preparations were found to have a single layer of smooth muscle cells. Typical gap junctions were readily observed between endothelial cells only.
While immunoreactivity to connexin 40 was strongly expressed on the membranes of endothelial cells only, that to connexin 43 was expressed on both smooth muscle and endothelial cell membranes.
Neurobiotin injected into a smooth muscle cell diffused into several neighbouring smooth muscle cells while that injected into an endothelial cell diffused into many endothelial cells.
Acetylcholine-induced hyperpolarizations were conducted from endothelial cells to smooth muscle cells with a relative amplitude of 80.1 %. Ba2+-induced action potentials were conducted in the opposite direction with a relative amplitude of 92.4 %.
An electrotonic potential produced in a smooth muscle cell by current injection diminished steeply with distance as it spread along the muscle layer, plateauing at distances beyond 25 μm. An electrotonic potential produced in an endothelial cell spread within the intima with virtually no reduction. Electrotonic potentials could conduct through myoendothelial couplings, which seemed to behave as ohmic resistors without rectification.
The coupling resistance between adjacent smooth muscle cells was estimated to be at least 90 MΩ and that between a smooth muscle cell and the whole endothelial layer to be 0.9 GΩ.
The results indicate that although the resistance of myoendothelial couplings is appreciable, the endothelium may be important as a low resistance path connecting many smooth muscle cells.
Membrane potential is one of the major factors regulating contractile activity of smooth muscle cells. In vascular tissue, the membrane potential of individual smooth muscle cells may be modified by autonomic nervous activity causing either excitatory or inhibitory junction potentials or by humoral substances such as catecholamines, kinins, prostanoids and acetylcholine (ACh), which affect the smooth muscle cells either directly or indirectly via the endothelial cells. As coordinating the contraction or dilatation of many smooth muscle cells is necessary for adequate control of local circulation, synchronized changes in membrane potential in regions of neighbouring smooth muscle cells would be expected.
Three kinds of intercellular electrical coupling exist in vascular tissue, namely coupling between smooth muscle cells, between endothelial cells and between smooth muscle and endothelial cells. The existence of such intercellular coupling has been shown by dye transfer experiments; dyes move from endothelial cell to endothelial cell and from smooth muscle cell to smooth muscle cell in the pig coronary artery (Bény & Connat, 1992; Bény & Pacicca, 1994), Lucifer Yellow diffuses between endothelial cells only (Segal & Bény, 1992; Little et al. 1995b) whereas dyes with smaller molecular size diffuse between the two cell layers in hamster cheek pouch arterioles (Little et al. 1995b). When a change in membrane potential occurs in a smooth muscle cell or a group of smooth muscle cells, it may be conducted to the neighbouring smooth muscle cells through any of these intercellular pathways.
The principal pathway of electrical signal conduction remains elusive and may differ among vascular beds and also depend upon experimental conditions. In arterioles of the hamster cheek pouch in vitro, Xia et al. (1995) found electrical couplings between smooth muscle and endothelial cells, while Welsh & Segal (1998) found no coupling between these two layers in the same preparation but in vivo. In the feed arteries and arterioles of the retractor muscle of the hamster, the smooth muscle cells are poorly coupled to each other, while the endothelial cells are well coupled to each other and so are the two layers in both in vivo (Segal et al. 1999) and in vitro experiments (Emerson & Segal 2000a, 2000b). Thus, in these feed arteries and arterioles, the endothelial cells provide the primary pathway for conducting changes in the membrane potential and propagating vasoconstriction or dilatation along arteries in response to application of ACh (Emerson & Segal, 2000a) or to current injections (Emerson & Segal, 2000b). Conduction of vasodilatation induced by hyperpolarizing vasodilators in arterioles of the mouse cremaster muscle is impaired in connexin 40-deficient animals ( De Wit et al. 2000). As connexin 40 is abundantly expressed in the endothelium (Yeh et al. 1997; Gabriels & Paul, 1998), this observation suggests that hyperpolarization conducts primarily in the endothelium in this tissue also.
The spread of electrical polarization within blood vessels has been extensively studied in the submucosal arterioles of the guinea-pig ileum by Hirst & Neild (1978). They calculated that the resting time constants were in the range 300-700 ms and that the resting length constant was ≈1.5 mm. They also estimated that the membrane resistance of a single smooth muscle cell was 10 GΩ and that the coupling resistance between smooth muscle cells was 110 kΩ. From these analyses, they concluded that the smooth muscle cells were well coupled to each other. However, this work was done before the importance of the endothelium to vascular function had been demonstrated by Furchgott & Zawadzki (1980). Electrical connectivity in submucosal arterioles can now be reconsidered involving the endothelium as one of the main elements.
In the present experiments, we investigated first-order arterioles from the guinea-pig mesentery because they are located just proximal to the arterioles Hirst & Neild (1978) studied and are thought to share similar electrical properties with them. Because of their low access resistance and high seal resistance, patch electrodes were used instead of sharp electrodes to minimize the errors associated with current injection. The results indicate that there are functioning myoendothelial electrical couplings and that the endothelium may be important as a low resistance path connecting many smooth muscle cells.
METHODS
Tissue preparation for electrophysiology
Male guinea-pigs, weighing 250-400 g, were anaesthetized by sevoflurane inhalation and killed with an animal guillotine. Animals were treated ethically according to the rules of the Laboratory Animal Care and Use Committee of Nagoya City University Medical School. The ileum was excised and the first-order arterioles were dissected out (diameter, 50-100 μm). Three kinds of preparations were made as described previously (Yamamoto et al. 1998). Briefly, for the experiments in which recordings were made from two smooth muscle cells, the arteriole was incubated in physiological saline containing 0.5 mg ml−1 collagenase (Wako Pure Chemical Industries, Ltd, Osaka, Japan) for 15 min at 35 °C, and then the adventitial layer was removed mechanically to reveal the smooth muscle layer. In some experiments, a part of the adventitia-removed preparation was cut open to reveal the endothelial layer and simultaneous recordings were made from both the smooth muscle and endothelial cells. When recordings were made from two endothelial cells, the arteriole segment was everted by pushing one end into the lumen with a tungsten wire (20 μm in diameter); no enzymatic treatment was used. One millimetre segments of these preparations were pinned out in a small recording chamber (0.8 mm wide × 1.5 mm long). Because both ends were pressed down to the bottom with pins, the actual length of the typical preparation was 0.7 mm and the diameter was about 70 μm. Preparations were superfused with preheated (35 °C) and aerated (100 % O2) bath solution at a constant rate (1 ml min−1).
Electrophysiological techniques
The tight-seal patch clamp method was applied to two cells simultaneously in the conventional or perforated whole-cell clamp configuration using gramicidin (Ebihara et al. 1995). Voltage or current signals were acquired using an EPC-7 patch clamp system (List-Medical) and an Axopatch 200 system (Axon Instruments), then digitized with a Digidata 1200B data acquisition system (Axon Instruments). The sampling rate was always 5 times higher than the cut-off frequency (-3 dB) of a low-pass Bessel filter. Current or voltage clamp protocols were controlled with pCLAMP 8 software (Axon Instruments). In some experiments, voltage signals were stored on a DAT tape with a pass band of DC to 10 kHz (PC-204, Sony Magnescale Inc., Tokyo) before digitization.
Solutions and chemicals for electrophysiology
The composition of standard bath solution was (mm): NaCl, 141.5; KCl, 5.4; CaCl2, 1.8; MgCl2, 1; Hepes, 10; glucose, 5; the pH was adjusted to 7.3 with NaOH. The pipette solution for conventional whole-cell clamp experiments contained (mm): KCl, 143; MgCl2, 1; EGTA, 5; Hepes, 10; glucose, 5; the pH was adjusted to 7.3 with KOH. The pipette solution for perforated whole-cell clamp experiments contained: KCl, 150 mm; Hepes, 10 mm; gramicidin D, 20-50 μg ml−1. Ba2+ (5 mm) solution was prepared by replacing all CaCl2 in the bath solution with 5 mm BaCl2. ACh and gramicidin D were obtained from Sigma. ACh was applied into the superfusate. Gramicidin was dissolved in DMSO to make a stock solution of 10 mg ml−1.
Morphological observations
Electron microscopy
Samples, still attached to intestinal muscle, were pinned onto Sylgard and fixed overnight in fixative consisting of 2 % paraformaldehyde and 2 % glutaraldehyde in 0.1 m sodium cacodylate buffer (pH 7.3). Samples were rinsed 3 times for 15 min each in 0.1 m buffer, then post-fixed in 2 % osmium tetroxide in the same buffer for 2 h. Samples were dehydrated in a graded series of ethanol and propylene oxide, and embedded in Epon. Sections were cut using a Sorvall ultramicrotome and examined using a Hitachi 7000 transmission electron microscope operated at 75 kV.
Immunohistochemistry for connexin 40 and connexin 43
Adventitia-removed or everted preparations were pinned onto Sylgard and fixed overnight at 4 °C in 4 % paraformaldehyde in 0.1 m phosphate buffer, pH 7.3. Samples were then rinsed 3 times in phosphate-buffered saline (PBS) containing 0.3 % Triton X-100 for 10 min each, once for 20 min in DMSO and finally for 10 min in PBS. Samples were removed from the Sylgard and incubated at room temperature in primary antibody (rabbit anti-connexin 40, 1:250; or rabbit anti-connexin 43, 1:250; both Chemicon International, Inc., Temecula, CA, USA) for 24-48 h. Excess antibody was rinsed from the tissue in three changes of PBS and the tissue further incubated in secondary antibody (goat anti-rabbit IgG conjugated to Alexa fluor 568, 1:500; Molecular Probes, Eugene, OR, USA) for 1-2 h. Excess antibody was rinsed from the tissue in three changes of PBS, prior to mounting in Dako fluorescent mounting medium. Negative controls were processed identically, with the primary antibody being replaced by PBS. Preparations were imaged using a Biorad MRC-1000 confocal microscope, through a × 63, 1.4 NA oil immersion objective. Scans at either a single confocal plane (XY scans), or series of scans through the depth of the tissue (XYZ scans) were acquired and stored on disk for later analysis using a personal computer.
Neurobiotin injection
The patch pipette was back-filled with pipette solution containing 2.5 mm neurobiotin (Vector Laboratories, Burlingame, CA, USA). After the conventional whole-cell clamp condition was established on either a smooth muscle or an endothelial cell, the membrane potential was held at several millivolts less negative than the resting membrane potential to inject a current of up to 100 pA. After about 10 min the patch electrode was removed and the tissue was pinned onto a piece of Sylgard. The tissue was fixed in 4 % paraformaldehyde in 0.1 m phosphate buffer overnight and then rinsed 3 times in PBS containing 0.3 % Triton X-100 for 10 min each. The tissue was then removed from the Sylgard and incubated in streptavidin-CY3 (Jackson Immuno Research, West Grove, PA, USA) diluted 1:500 in PBS-Triton X-100 for between 24 and 48 h. The tissue was rinsed again 3 times in PBS and mounted on a glass slide using DAKO fluorescent mounting medium, and sealed with nail polish. The preparation was observed using a confocal microscope.
Statistics
Numerical data are represented as the mean ± standard error of the mean, with n referring to the number of measurements. Statistical evaluation was performed by either Student's t test (paired or unpaired) or Mann-Whitney's U test with a P value < 0.05 considered statistically significant.
RESULTS
Morphology of the preparation
Mesenteric arterioles consisted of three distinct layers, with a total thickness of approximately 20 μm in transverse section (Fig. 1A). A single layer of smooth muscle cells, each some 5-8 μm in thickness, was arranged approximately circumferentially to the longitudinal axis of the vessel. The section shown in Fig. 1A was not exactly parallel to the smooth muscle orientation and several smooth muscle cells can be seen. The smooth muscle cells were surrounded by an adventitial layer containing fibroblasts, connective tissue and unmyelinated axon bundles in which both varicose (containing synaptic vesicles) and non-varicose (containing only neurotubules) portions of axon can be observed. A layer of endothelial cells formed the lumen of the arterioles, and these cells were oriented parallel to the longitudinal axis of the vessel. Endothelial cells were some 3-5 μm in width at the level of the nucleus, and were tightly packed and in close apposition with each other at many points; desmosomes, tight junctions and gap junctions (Fig. 1B) were all observed. Elastic fibres were present between the layer of endothelial cells and the muscular wall but did not form an organized internal elastic lamina (Fig. 1A). Processes from smooth muscle cells projected towards endothelial cells and similarly, endothelial cell processes projected towards smooth muscle cells (Fig. 1C). Myoendothelial gap junctions have recently been described in rat arteries after analysis of serial sections (Sandow & Hill, 2000). However, such structures could not be observed at these sites of close apposition. The reconstruction of serial sections, necessary to determine the presence or absence of myoendothelial gap junctions (Sandow & Hill, 2000), was beyond the scope of this study. Smooth muscle cells also were in close association with neighbouring cells at many points, but true gap junctions were rarely observed.
Figure 1. Ultrastructure of guinea-pig mesenteric arteriole.
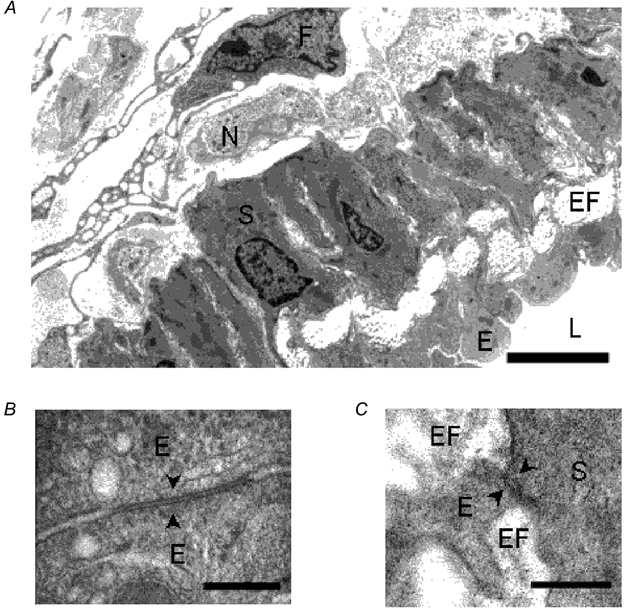
A, electron micrograph of a transverse section of guinea-pig mesenteric arteriole. Smooth muscle cells (S), endothelial cells (E), elastic fibres (EF), nerve bundles (N), fibroblast (F) and lumen (L) can be seen. Scale bar represents 5 μm. B, electron micrograph showing a gap junction (arrowheads) between endothelial cells (E). Scale bar represents 0.2 μm. C, electron micrograph showing close apposition (arrowheads) between a smooth muscle cell (S) and a process from an endothelial cell (E) with intervening elastic fibres (EF). Scale bar represents 0.2 μm.
Immunohistochemistry for connexins
In an everted arteriole which had been treated to reveal immunoreactivity for connexin 40 (Fig. 2A), punctate immunoreactivity to connexin 40 was strongly expressed on the membranes of endothelial cells, but appeared to be rare or absent from smooth muscle cell membranes. In these preparations uninterrupted lines of punctate immunoreactivity clearly indicated borders between endothelial cells and it could be observed that endothelial cells were oriented parallel to the longitudinal axis of the vessel. In an adventitia-removed arteriole which had been treated to reveal immunoreactivity for connexin 43 (Fig. 2B), immunoreactivity in endothelial cells was observed at the centre, and occasional punctate spots were also observed in outer smooth muscle cells. In another adventitia-removed arteriole which had been treated to reveal immunoreactivity for connexin 43 (Fig. 2C), punctate immunoreactivity was expressed on smooth muscle membranes. It was impossible to determine whether connexins were forming myoendothelial gap junctions by examination of whole mount preparations.
Figure 2. Immunohistochemistry for connexins 40 and 43.
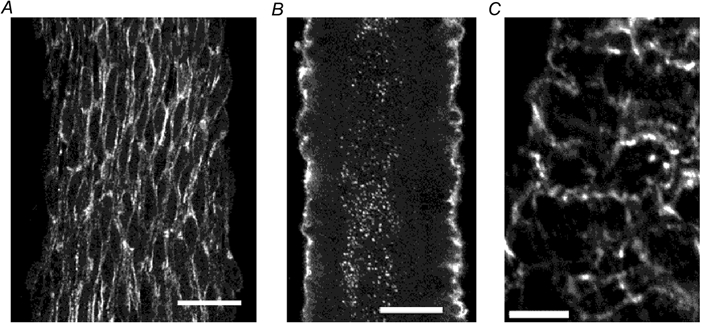
A, reconstructed image through 12 optical slices each 0.5 μm thick in an everted arteriole which has been treated to reveal immunoreactivity for connexin 40. Scale bar represents 20 μm. B, reconstructed image through four optical slices each 1 μm thick from the central region of an adventitia-removed arteriole which has been treated to reveal immunoreactivity for connexin 43. Scale bar represents 20 μm. C, single optical slice 1 μm thick in an adventitia-removed arteriole which has been treated to reveal immunoreactivity for connexin 43. Scale bar represents 10 μm.
Cell identification and diffusion of injected neurobiotin
With patch clamp electrodes, gigaseals can be made only on the cells which are located on the surface of the preparation and whose membranes are smooth. In the adventitia-removed preparations, only the smooth muscle cells were accessible to the patch electrodes, and similarly in the everted preparations, only the endothelial cells. In the parts of the adventitia-removed preparations where the endothelial layer had been revealed, only the endothelial cells were accessible. The target cell was also identified by observing the membrane current induced by a step depolarization in the voltage clamp condition (Yamamoto et al. 1998). The time course of current relaxation is much faster in a smooth muscle cell than in an endothelial cell.
In some experiments, neurobiotin was incorporated into the pipette solution and its localization and diffusion were observed with a confocal microscope (Fig. 3). In an adventitia-removed arteriole, the patched cell was identified as a smooth muscle cell from the time course of the current relaxation induced by a step depolarization (Fig. 3Aa). In the confocal microscopic image (Fig. 3Ba), there was a densely stained cell, presumably the patched cell, having an expanded central portion where the nucleus might reside with a single thin process at each end. From a series of confocal images, the cell was found to be located circumferentially around the vessel occupying roughly half of the circumference and could be morphologically identified as a smooth muscle cell. Several smooth muscle cells but not endothelial cells around the patched cell were also stained less densely indicating the existence of intercellular couplings between smooth muscle cells, which allowed passage of neurobiotin. In an everted arteriole, on the other hand, a patched cell was identified as an endothelial cell from the time course of the current relaxation induced by a step depolarization (Fig. 3Ab). In the confocal microscopic image (Fig. 3Bb), many cells were homogeneously stained and the patched cell could not be specified indicating these cells were well coupled to each other. Individual cells were oriented parallel to the longitudinal axis of the vessel and were morphologically identified as endothelial cells. Injected neurobiotin diffused further in the longitudinal direction than in the circumferential direction, which was consistent with the long and narrow shape of the cells. Neurobiotin diffusion into smooth muscle cells from endothelial cells could not be observed.
Figure 3. Cell identification and spread of injected neurobiotin.
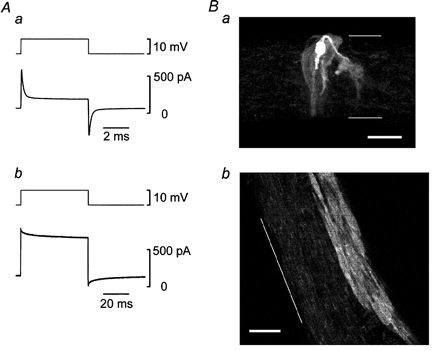
A, membrane currents (lower traces) induced by step depolarizations (upper traces) in a smooth muscle of adventitia-removed arteriole (a) and in an endothelial cell of everted arteriole (b). Conventional whole-cell clamp experiments using pipette solution containing 2.5 mm neurobiotin. Averages of 5-28 individual traces. Signals were filtered at a cut-off frequency (-3 dB) of 10 kHz. Note that the time scales are different between a and b. B, about 10 min after the whole-cell clamp condition was established, the tissues were fixed and processed. Reconstructed image through 24 optical slices each 0.9 μm thick in the adventitia-removed tissue (a) and single optical slice, 0.5 μm thick in the everted tissue (b). Scale bars represent 20 μm and thin lines indicate the edges of the preparations.
From the observations using silver nitrate staining, Haas & Duling (1997) reported that an endothelial cell was 141 μm long and 7 μm wide in hamster cheek pouch arterioles, and 94 μm long and 7 μm wide in rat pial arterioles. In our immunohistochemical observations for connexin 40 and confocal microscopic images of neurobiotin-injected preparations, although the poor resolution did not allow us to measure the precise size, the length of a single endothelial cell seemed to be 20-40 μm, which was much shorter than those values in the literature. This discrepancy might be due to differences in the methods of fixation or in the species used. We did not examine this issue further.
Conduction of chemically induced signals
In this series of experiments, the tight-seal patch clamp method was used in perforated whole-cell clamp configuration using gramicidin to preserve the intracellular condition. The average resting membrane potential measured simultaneously was -53.8 ± 1.6 mV in smooth muscle cells and -54.0 ± 1.8 mV in endothelial cells. These values were not significantly different (n = 15, Student's paired t test).
In guinea-pig mesenteric arterioles, applied ACh opens Ca2+-activated K+ channels in the endothelial cells only, producing membrane hyperpolarization (Yamamoto et al. 1999). While the membrane potentials in an endothelial cell and in a smooth muscle cell were recorded simultaneously in current clamp mode, ACh (3 μm) was applied to stimulate the endothelial cells (Fig. 4). ACh induced a membrane hyperpolarization with two phases, an initial fast phase followed by a slower second phase. A membrane hyperpolarization with the same time course could also be recorded from the smooth muscle cell, but the amplitude was reduced. When the voltage trace from the endothelial cell was scaled by 78 %, it coincided with the voltage trace from the smooth muscle cell.
Figure 4. Effect of ACh on membrane potentials simultaneously recorded from smooth muscle and endothelial cells.
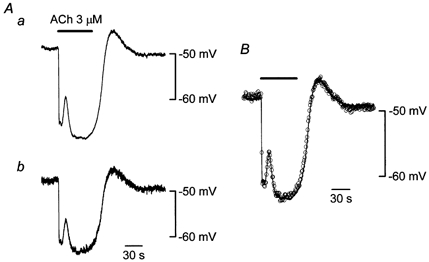
A, in current clamp mode using the perforated whole-cell clamp method, membrane potentials in an endothelial cell (a) and in a smooth muscle cell (b) were recorded simultaneously. Distance between the two electrodes was 154 μm. ACh (3 μm) was applied during the period indicated by the bar at the top. Signals were filtered at a cut-off frequency (-3 dB) of 10 Hz. B, the voltage trace shown in Aa was scaled by 78 % (continuous curve) and superimposed on the trace shown in Ab (○, sampled once per second).
High concentrations of Ba2+ produce membrane depolarization by blocking voltage-dependent and inward rectifier K+ channels (Nelson & Quayle, 1995). For L-type Ca2+ channels, Ba2+ substitutes well for Ca2+ as a current carrier and substitutes poorly in stimulating the Ca2+-dependent inactivation process (Eckert & Tillotson, 1981). Thus, Ca2+ channels pass more current when the external Ca2+ is replaced by Ba2+. In guinea-pig mesenteric arterioles, a high concentration of applied Ba2+ produces action potential discharges in the smooth muscle cells only, as the endothelial cells do not exhibit time-dependent currents in voltage clamp experiments (Yamamoto et al. 1998). While the membrane potentials in an endothelial cell and in a smooth muscle cell were recorded simultaneously in current clamp mode, Ca2+ in the bath solution was replaced with Ba2+ (5 mm) to stimulate the smooth muscle cells (Fig. 5). In Ba2+, the membrane depolarized and repetitive spike discharges appeared in the smooth muscle cell. Membrane depolarization and spike discharges with nearly identical timing and amplitude could simultaneously be recorded from the endothelial cell. When one of the spikes from the smooth muscle cell was scaled by 98 % and superimposed on the corresponding spike from the endothelial cell, a delay of about 10 ms was observable in the spike from the endothelial cell. In five preparations where two electrodes were separated by 94-120 μm, the average delay was 7.9 ± 1.0 ms. When Ba2+-induced spikes were recorded simultaneously from two smooth muscle cells separated by 79-115 μm, the average delay between the two recordings was 1.3 ± 0.8 ms (n = 4), which was comparable to the resolution of data acquisition (1 ms). It is possible that this delay might be due purely to myoendothelial conduction, but we did not examine this issue further.
Figure 5. Effect of Ba2+ on membrane potentials simultaneously recorded from smooth muscle and endothelial cells.
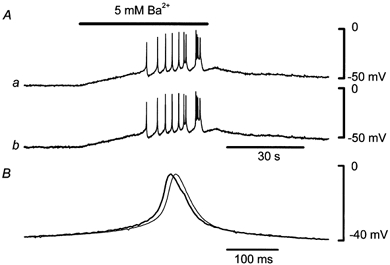
A, in current clamp mode using the perforated whole-cell clamp method, membrane potentials in an endothelial cell (a) and in a smooth muscle cell (b) were recorded simultaneously. Distance between the two electrodes was 120 μm. Ca2+ in the bath solution was replaced with Ba2+ (5 mm) during the period indicated by the bar at the top. Signals were filtered at a cut-off frequency (-3 dB) of 100 Hz. B, one of the spikes shown in Ab was scaled by 98 % (thick curve) and superimposed on the corresponding spike shown in Aa (thin curve).
Although the average resting membrane potentials in smooth muscle and endothelial cells were not significantly different, these potentials were not exactly the same in individual preparations. As the ACh-induced hyperpolarization tends to be larger when the resting potential is more positive (Kitamura & Kuriyama, 1979), the difference in the resting potentials should be considered when amplitudes of hyperpolarization are compared. In nine preparations where two electrodes were separated by 41-168 μm, the resting potentials of the smooth muscle cells were more positive in six preparations and more negative in three preparations when compared to those of the endothelial cells (Fig. 6A). Yet the ACh-induced hyperpolarizations recorded in the smooth muscle cells were always smaller than those from the endothelial cells irrespective of resting potential and the differences were statistically significant. Similar observations were made in the case of Ba2+-induced spikes in five preparations where two electrodes were separated by 94-120 μm (Fig. 6B). Ba2+-induced spikes recorded in endothelial cells were always smaller than those in smooth muscle cells irrespective of the membrane potentials between the spikes and the differences were significant. These observations suggest that ACh-induced hyperpolarizations conduct from endothelial cells to smooth muscle cells and that Ba2+-induced spikes conduct in the opposite direction. The average relative amplitude in the smooth muscle cell of ACh-induced hyperpolarizations from the endothelial cell was 80.1 ± 1.7 % (n = 9, Fig. 6C) and that in the endothelial cell of Ba2+-induced spikes from the smooth muscle was 92.4 ± 2.2 % (n = 5, Fig. 6C).
Figure 6. Conduction of ACh-induced hyperpolarization and Ba2+-induced spikes between smooth muscle and endothelial cells.
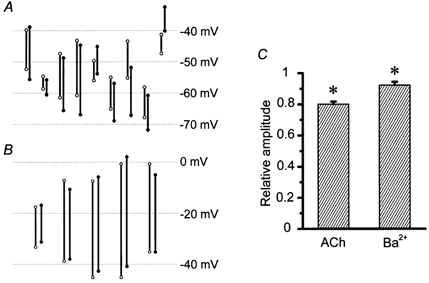
A, amplitude of ACh-induced hyperpolarization is indicated by a bar whose top corresponds to the resting membrane potential and bottom to the peak of hyperpolarization. B, amplitude of Ba2+-induced spike is indicated by a bar whose top corresponds to the peak of the spike and bottom to the membrane potential between spikes. In both A and B, open circles represent smooth muscle cells and filled circles endothelial cells. Each pair represents a separate preparation. C, average relative amplitudes of ACh-induced hyperpolarizations from the endothelial cell to the smooth muscle and of Ba2+-induced spikes in the opposite direction. Error bars represent the standard error of the mean (n = 9 in ACh and 5 in Ba2+). * Significant difference between smooth muscle and endothelial cells (Student's paired t test).
Conduction of electrotonic potentials
In this series of experiments, the tight-seal patch clamp method was used in the conventional whole-cell clamp configuration to minimize the access resistance. In current clamp mode, electrotonic potentials produced by injecting depolarizing or hyperpolarizing currents were recorded simultaneously from the cells where the currents were injected (source cells) and from distant cells. In these experiments, the seal resistance and the access resistance might cause some errors in measured membrane potential of the source cell. Using patch electrodes, the seal resistance which is in parallel with the cell membrane is of the order of gigohms (20-200 GΩ by Corey & Stevens, 1983) and seal leakage currents could be ignored in the present experiments where the input resistances measured were much lower than the seal resistance (see Table 1). On the other hand, the access resistance is in series with the cell membrane and could cause an error when the input resistance is low. When the source cell was a smooth muscle cell, the voltage drop across the access resistance was only a few millivolts when a current of 200 pA was injected. This was corrected for by using an access resistance estimated from the membrane current required to impose a 10 mV voltage clamp step (Yamamoto et al. 1998). When the current was injected into an endothelial cell, however, the voltage drop was tens of millivolts for a current of 800 pA. As the estimation of access resistance in the voltage clamp condition was unsuccessful, probably because of poor voltage control, the access resistance was estimated in the current clamp condition. When a current was applied to an endothelial cell, an abrupt change in the measured potential preceded a much slower change. As the abrupt change in potential was most likely to be due to a voltage drop across the access resistance, we calculated the access resistance from it and the correction was performed. To check the validity of this method, we located two electrodes as close as possible to each other to record from a single endothelial cell through two different electrodes and a current was injected through one of them. After correcting for the voltage error due to access resistance by the method outlined above, the electrotonic potentials recorded from the two electrodes were identical.
Table 1.
Properties of electrotonic potentials
| Smooth muscle cells | |||
|---|---|---|---|
| With | without | Endothelial | |
| endothelium | endothelium | cells | |
| τ1 (ms) | 1.2 ± 0.1 | 1.8 ± 0.2 * | 74.3 ± 7.3 |
| Contribution of τ1 (%) | 85.7 ± 1.4 | 58.3 ± 6.3 * | — |
| τ2 (ms) | 13.2 ± 0.7 | 24.8 ± 3.7* | — |
| Contribution of τ2 (%) | 14.3 ± 1.4 | 41.7 ± 6.3* | — |
| Rin (Mω) | 99.4 ± 9.0 | 198.2 ± 22.9* | 4.6 ± 0.5 |
| n | 22 | 9 | 19 |
τ1 and τ2: time constants of electrotonic potentials. Rin: input resistance of the patched cell within the syncytium calculated by dividing plateau amplitude of electrotonic potential by injected current intensity. Values are the mean ± standard error of the mean, with n referring to the number of measurements.
Significantly different from the values with endothelium (Mann–Whitney's U test).
Figure 7A shows actual recordings from an experiment where the source cell was a smooth muscle cell and the second cell an endothelial cell 118 μm distant from the source cell. When depolarizing and hyperpolarizing currents of 200 pA were injected into the source smooth muscle cell, electrotonic potentials induced in the source cell were nearly identical except for the polarity. Conducted electrotonic potentials recorded from the distant endothelial cell were small in amplitude and again nearly identical except for the polarity. In source smooth muscles, the average amplitudes of electrotonic potentials induced by currents of 200 pA and -200 pA were 17.7 ± 2.0 mV and 18.5 ± 2.1 mV, respectively, and they were not significantly different (Student's paired t test). In endothelial cells 118-170 μm distant from the source cells, the average magnitudes of electrotonic potentials induced by currents of 200 pA and -200 pA were 1.1 ± 0.2 mV and 1.1 ± 0.3 mV, respectively, and they were again not significantly different (Student's paired t test). Average relative amplitudes of electrotonic potentials induced by currents of 200 pA and -200 pA from the smooth muscle to the endothelial cell were both 0.06 ± 0.01 and they were not significantly different (Student's paired t test, Fig. 7B).
Figure 7. Electrotonic potentials recorded from a smooth muscle and an endothelial cell simultaneously in a guinea-pig mesenteric arteriole.
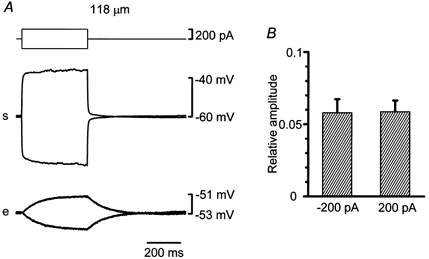
A, in current clamp mode using the conventional whole-cell clamp method, simultaneous recordings of membrane potentials were made from a current-injected smooth muscle and a distant endothelial cell (traces marked s and e). The top traces represent injected currents. Voltage traces are averages of up to 10 sweeps and corrected for voltage drops due to access resistance. Distance between the two electrodes was 118 μm. B, average relative amplitudes of electrotonic potentials induced by currents of 200 pA or -200 pA from the smooth muscle to the endothelial cell. Error bars represent the standard error of the mean (n = 6).
As the myoendothelial electrical coupling did not seem to exhibit rectification (Fig. 7), only hyperpolarizing currents were employed in the experiments shown in Fig. 8. Firstly, in 14 adventitia-removed preparations, attempts were made to locate two electrodes as closely as possible to record from single cells through two different electrodes. In 4 out of the 14 trials, when both patch clamp systems were set to voltage clamp mode, setting of the holding potential through one electrode enormously affected the holding current through the other electrode as if the two electrodes were shunted. Once such a phenomenon was observed, we considered that two electrodes were placed on the same smooth muscle cell. The mode was switched to current clamp to avoid undesirable oscillation, and a hyperpolarizing current was injected through one of the electrodes (Fig. 8A). After correcting for the voltage error due to access resistance, the electrotonic potentials recorded from the two electrodes were identical. The electrotonic potential had a rapid falling phase followed by a gradually falling phase. Properties of electrotonic potentials are summarized in Table 1. The input resistance of the patched cell within the syncytium (Rin in Table 1) was calculated by dividing the plateau amplitude of the electrotonic potential by the injected current intensity. The rapid phase could be well fitted by the sum of two exponential functions whose time constants (τ1 and τ2) are given in Table 1. The gradual phase could not be well described by an exponential function. When the second electrode was placed on a different smooth muscle cell 25 μm distant from the source cell, the electrotonic potential recorded from that cell was small in amplitude and had a slow falling phase (Fig. 8B). When the second electrode was placed on an endothelial cell 255 μm distant from the source smooth muscle cell, the electrotonic potential recorded from that cell was small in amplitude and had a slow falling phase (Fig. 8C). In some adventitia-removed preparations, the endothelial layers were destroyed by inserting a wire into the lumen. The damage to the endothelial cells was confirmed by the disappearance of the ACh-induced hyperpolarization. In such preparations, the electrotonic potential recorded from the source smooth muscle cell was larger and slower than that in the endothelium-intact preparations (Fig. 8D). The falling phase could be well fitted by the sum of two exponential functions (Table 1). Both time constants, the contribution of each exponential component and the input resistance were significantly different from the values obtained in the endothelium-intact preparations. The gradually falling phase seen in responses in the preparations with intact endothelium was not evident after the endothelium had been destroyed. The electrotonic potential recorded from a smooth muscle cell 51 μm distant from the source cell in the endothelium-destroyed preparation was small in amplitude and had a slow falling phase. The falling phases of electrotonic potentials recorded from the second electrodes in Fig. 8B–D could not be well described by an exponential function.
Figure 8. Electrotonic potentials recorded from two cells simultaneously in guinea-pig mesenteric arterioles.
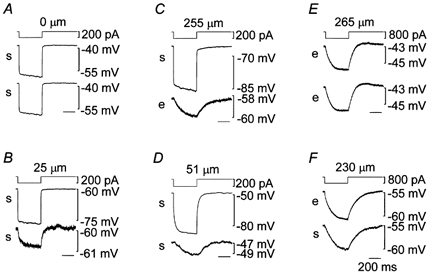
In current clamp mode using the conventional whole-cell clamp method, pairs of simultaneous recordings of membrane potentials were made. Firstly in two smooth muscle cells (traces marked s in A, B and D), secondly in two endothelial cells (traces marked e in E) and thirdly in a smooth muscle and an endothelial cell (traces marked s and e in C and F) traces were recorded simultaneously. In each set of three traces, the top one represents injected current into one cell from which the middle trace was recorded. The bottom trace was recorded from another cell except in A where two electrodes were probably placed on the same cell. The endothelial layer was mechanically destroyed prior to the recording in D. The distance between the two electrodes along the longitudinal axis of vessel is indicated at the top. Voltage traces are averages of up to 10 sweeps and corrected for voltage drops due to access resistance. Time scale shown in F applies to all.
When current was injected into an endothelial cell, the electrotonic potential recorded from the cell was small in amplitude and had a slow falling phase (Fig. 8E). The falling phase could be well fitted to an exponential function (τ1 in Table 1). The electrotonic potential recorded from an endothelial cell 265 μm distant from the source cell was almost identical to that recorded from the source cell. When the second electrode was placed on a smooth muscle cell 230 μm distant from the source cell, the electrotonic potential recorded from that cell was slightly smaller in amplitude and had a similar time course to that from the source cell (Fig. 8F).
Relative amplitudes of electrotonic potentials to those recorded from source cells were plotted against the distance between the two electrodes along the longitudinal axis of the vessel (except ▪, Fig. 9A). When the source and the distant cells were both smooth muscle cells (•), the relative amplitudes decreased rapidly with increasing electrode separation. However, they approached a constant value at distances longer than 25 μm. Fourteen points on the ordinate axis having values of 0.15-1.00 represent the data from the experiments where attempts were made to place two electrodes on single smooth muscle cells. In some experiments, the locations of the patched cells were visualized using pipette solution containing 2.5 mm neurobiotin. In an experiment where the relative amplitude was 0.57, two densely stained smooth muscle cells partially overlapped indicating that the patched cells were directly coupled to each other (Fig. 9B). When the source and the distant cells were both endothelial cells (○), the electrotonic potentials spread up to 332 μm with virtually no reduction. When the source cells were smooth muscle cells and the distant cells endothelial cells (▵), the relative amplitude (average: 0.07 ± 0.01, n = 7) was not strongly dependent on electrode separation at distances between 66 and 255 μm. When the source cells were endothelial cells and the distant cells smooth muscle cells (▴), the relative amplitude again had an approximately constant value (average: 0.84 ± 0.01, n = 6) at distances between 139 and 248 μm. When the source and the distant cells were both smooth muscle cells in preparations from which the endothelial layers had been removed (□), the relative amplitude at distances up to about 50 μm was similar to those from the preparations with intact endothelium. However, it was nearly zero at longer distances. As endothelial cells are oriented parallel to the longitudinal axis of the vessel, electrotonic potentials would encounter more intercellular junctions when they spread a given distance through the endothelial layer in the circumferential direction than in the longitudinal direction. This was also shown in Fig. 3Bb where injected neurobiotin diffused further in the longitudinal direction than in the circumferential direction. When the source and the distant cells were both endothelial cells separated by about 50 μm circumferentially, however, the electrotonic potentials spread with virtually no reduction (▪).
Figure 9. Spread of electrotonic potentials in guinea-pig mesenteric arterioles.
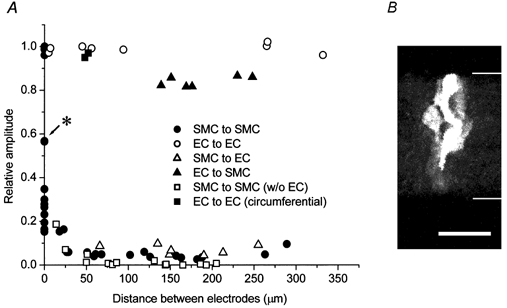
A, relative amplitudes of electrotonic potentials to those recorded from cells where currents were injected were plotted against the distance between two electrodes along the longitudinal axis of the vessel (except ▪). Current-injected and distant cells were both smooth muscle cells (SMC, •), both endothelial cells (EC, ○), smooth muscle cells and endothelial cells (▵), endothelial cells and smooth muscle cells (▴), both smooth muscle cells in preparations from which the endothelial layers had been removed (□) and both endothelial cells separated circumferentially (▪). B, reconstructed image of two partially overlapping smooth muscle cells which had been independently filled with neurobiotin (2.5 mm) through 35 optical slices each 0.5 μm thick in the adventitia-removed tissue which is indicated by an asterisk in A. Scale bar represents 20 μm and thin lines indicate the edges of the preparation.
DISCUSSION
In the present experiments we quantitatively evaluated the intercellular electrical couplings in the arteriolar wall by observing the conduction of membrane potential changes induced either by chemical substances or by current injection. The preparation we used was a segment of isolated arteriole which could be considered as a short electrical cable with sealed ends. Electron microscopic observations revealed that the arterioles had single layers of smooth muscle cells, allowing for simplified analyses. Many typical gap junctions were found between endothelial cells as was the case in other arteries (Bény & Connat, 1992; Sandow & Hill, 2000). Using indirect immunofluorescence microscopy and Western blotting, Gabriels & Paul (1998) reported that connexin 40 and connexin 37 were uniformly distributed in aortic endothelial cells. Connexin 40 is co-localized with connexin 43 in endothelial cells of rat arterioles (Little et al. 1995a). In rat aorta and coronary artery endothelial cells, connexin 40 is extensively and prominently expressed (Yeh et al. 1997). In our preparations also, connexin 40 was strongly expressed on the membranes of endothelial cells. These morphological observations as well as our neurobiotin and dye transfer experiments (Little et al. 1995b) suggest that the endothelial cells are very well coupled. Indeed, in the present experiments, the electrotonic potentials spread with virtually no reduction within the endothelial layer both along and around the vessels. As our preparations were only 700 μm long, it was reasonable to treat the whole endothelial layer as a single large equipotential equivalent cell.
The electrotonic potential produced in a smooth muscle cell by current injection diminished steeply with distance as it spread along the smooth muscle layer, indicating a high coupling resistance between adjacent smooth muscle cells. Therefore, the smooth muscle layer could not in general be treated as a single large equivalent cell. On the occasions when all smooth muscle cells were isopotential no net current flowed through the junctions between smooth muscle cells, and the whole smooth muscle layer could be treated as a single large equivalent cell. We showed that ACh-induced hyperpolarization and Ba2+-induced spikes were conducted very effectively. In these experiments, either all endothelial cells or all smooth muscle cells were stimulated simultaneously and the whole endothelial layer or smooth muscle layer, respectively, was presumably isopotential. Indeed virtually identical Ba2+-induced spikes could be recorded when two different electrodes were placed on two separate smooth muscle cells. The relative amplitudes of conducted ACh-induced hyperpolarizations recorded from smooth muscle cells in nine preparations were quite similar in spite of the variation in the distance between the two electrodes. From these experimental data, it was reasonable to represent the endothelial layer as a single equivalent cell, and the smooth muscle layer as a second large equivalent cell, connected to the endothelium via an equivalent junctional resistance (Fig. 10). This representation was used to analyse data from the experiments where ACh or high Ba2+ solution was applied.
Figure 10. Schematic diagram of the preparation in experiments involving applied ACh, high Ba2+ solution, or current injection into an endothelial cell.
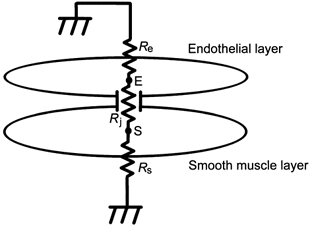
In these experiments, both endothelial and smooth muscle cells were isopotential within their layers and could be represented as two large equivalent cells (E and S) having membrane resistances of Re and Rs, respectively. Rj represents the coupling resistance between these two large equivalent cells. See text for the details.
When a current was injected into an endothelial cell to induce an electrotonic potential, the situation was the same as that for ACh-induced hyperpolarization. Because the whole endothelial layer could be treated as a single large equipotential cell, the same electrotonic potential could be observed in any of the endothelial cells. In these cases, conduction of electrical signals occurred from one layer to the other and net conduction within each layer was zero owing to isopotentiality. Indeed, the relative amplitudes of the conducted electrotonic potentials recorded from smooth muscle cells were approximately constant at distances between 139 and 248 μm.
In those experiments involving the application of ACh or high Ba2+ solution, and those using current injection into an endothelial cell, the conduction thus involved only one intercellular coupling, namely the myoendothelial coupling between two large equivalent cells, and the only difference was the direction of conduction. The difference observed in the efficiency with which these modulations of membrane potential were conducted might have been due to rectifying properties of the myoendothelial coupling. Gap junctions in rabbit sinoatrial nodal cell pairs do not always behave as pure ohmic resistors but can exhibit time- and voltage-dependent kinetics (Anumonwo et al. 1992). However, these dependencies are observed only when transjunctional voltage clamp steps of large amplitude and long duration are applied (Anumonwo et al. 1992). In the present experiments where depolarizing and hyperpolarizing electrotonic potentials were induced by current injections into smooth muscle cells, relative amplitudes of conducted electrotonic potentials observed in distant endothelial cells were independent of the direction of conduction. The myoendothelial couplings probably behave as ohmic resistors without rectification, although the possibility remains that when one of the layers is stimulated, transient asymmetrical conditions across the junction may induce some rectifying properties.
If the myoendothelial coupling is considered to be ohmic, the difference observed in the efficiencies with which these modulations of membrane potential induced by ACh, high Ba2+ solution or current injection into an endothelial cell are conducted could be explained by differences in the membrane resistances of the two cell types. Thus, the whole preparation could be expressed simply by a series connection of three resistors, namely total membrane resistance of the whole endothelial layer (Re), total myoendothelial junctional resistance (Rj), which is the parallel coupling of all myoendothelial junctional resistances, and total membrane resistance of the whole smooth muscle layer (Rs) with the extracellular ends of Re and Rs grounded (Fig. 10). The following equations describe this model. For current injection into an endothelial cell (point E in Fig. 10), the measured input resistance of the preparation (r) is expressed as Re in parallel with the series coupling of Rj and Rs:
When the equivalent smooth muscle cell is stimulated by high Ba2+ solution, the relative amplitude of conducted spikes (s) recorded in the equivalent endothelial cell (point E in Fig. 10) is expressed as a ratio of Re to the series coupling of Re and Rj:
Equation (2) is independent of Rs, the value of which might be changed by Ba2+ stimulation. When the equivalent endothelial cell is stimulated by ACh, the relative amplitude of the conducted hyperpolarization (h) recorded in the equivalent smooth muscle cell (point S in Fig. 10) is expressed as a ratio of Rs to the series coupling of Rs and Rj:
Equation (3) is independent of Re, the value of which might be changed by ACh stimulation. From the data, r = 4.6mω, s = 0.92 and h = 0.80. The relative amplitude of an electrotonic potential recorded in a muscle cell when current was injected into an endothelial cell was 0.84 and this value should be the same as h. As these two groups were not statistically different (Student's unpaired t test), h was recalculated to be 0.82 ± 0.01 by combining the two groups (n = 15). These equations can be expressed as:
and
Assuming the preparation to be a cylinder 700 μm long and 70 μm wide, the total area of membrane shared between the smooth muscle and endothelial layers was calculated to be about 150 000 μm2. This is not the actual area of myoendothelial junctions, which is much smaller than this value (see Fig. 1C). The myoendothelial junctional specific resistance would be 1.8 kΩ cm2. From scanning electron micrographs of rat mesenteric arterioles, Miller et al. (1986) estimated a smooth muscle cell to be about 100 μm long and 2 μm wide making the approximate surface area facing the endothelium 200 μm2. Assuming the size of a smooth muscle cell is comparable in rat and guinea-pig mesenteric arterioles, the total number of smooth muscle cells in our preparation would be 750. As Rs and Rj are parallel couplings of individual resistances, the membrane resistance of a single smooth muscle cell would be 4.2 GΩ and the myoendothelial junctional resistance per single smooth muscle cell 0.9 GΩ.
The value of 4.2 GΩ is smaller than the estimate of 10 GΩ offered by Hirst & Neild (1978) for the membrane resistance of a single smooth muscle cell in the submucosal arteriole of guinea-pig ileum. We treated some of our preparations with collagenase and removed the adventitia, and this process might have reduced the membrane resistance. In the same preparation used by Hirst & Neild (1978), Edwards & Hirst (1988) reported that the input resistance of a smooth muscle cell within a syncytium was some 60-120 MΩ. Although the dimensions of our preparation were different from theirs, the average input resistance of a smooth muscle cell in situ (99.4 MΩ) obtained in the present experiments was within this range. Combining all these observations, we concluded that the effect of removing adventitia was minor and the value of 4.2 GΩ for the membrane resistance of an isolated smooth muscle cell was reasonable.
The observed input resistance of a smooth muscle cell within the preparation with intact endothelium was about 100 MΩ. As the membrane capacitance of a single smooth muscle cell from this preparation is about 10 pF (Yamamoto et al. 1998), the smaller time constant (τ1) of about 1 ms in the rapid phase of the electrotonic potential could arise from charging or discharging the capacitance of the patched cell (10 pF) through the input resistance of 100 MΩ. The larger time constant (τ2) of about 10 ms could arise from the charging or discharging process of the capacitance of neighbouring smooth muscle cells. In preparations with the endothelium destroyed, the input resistance of a smooth muscle cell increased because of the removal of the shunting resistance provided by the endothelium. As the input resistance increased, both time constants (τ1 and τ2) increased and the contribution of the slower component (τ2) increased, indicating that the neighbouring smooth muscle cells retained charge which, in the endothelium-intact preparations, escaped into the endothelium. As the gradually falling phase observed in the preparation with intact endothelium was not evident after the endothelium had been destroyed, this phase might arise from the charging of the capacitance of the whole endothelial layer. On the other hand, the observed input resistance of an endothelial cell within a syncytium was 4.6 MΩ. When a hyperpolarizing current was injected into an endothelial cell, it conducted into the whole endothelial layer with virtually no electrotonic decrement and also conducted into the whole smooth muscle layer with little reduction. The relative amplitude in the smooth muscle cells was 84 %. The single time constant (τ1) of the electrotonic potential might arise from the charging process of the capacitance of the whole preparation through the input resistance of 4.6 MΩ.
When current was injected into a smooth muscle cell, conducted electrotonic potentials recorded from endothelial cells were small and considerably distorted (Fig. 7A and Fig. 8C). On the other hand, spike potentials induced by Ba2+ in smooth muscle cells conducted to endothelial cells with a high fidelity (Fig. 5). In experiments using Ba2+, the preparation could be represented by two large equivalent cells as shown in Fig. 10. So the total capacitance of the endothelial layer was charged through the parallel combination of the myoendothelial junctional resistances (Rj = 1.2 MΩ) while in experiments where current was injected into a smooth muscle cell, the same total capacitance was charged essentially through the myoendothelial junction resistance of a single smooth muscle cell (0.9 GΩ). The time constant in the former case is about 1/750 of that in the latter case.
When current was injected into a smooth muscle cell, the whole endothelial layer could again be treated as one large equivalent cell whereas the smooth muscle layer was not isopotential, so current flow between adjacent smooth muscle cells could not be ignored. In adventitia-removed preparations, attempts were made to locate two electrodes as close as possible so as to record from a single smooth muscle cell via both electrodes. In 4 out of the 14 trials, the two electrodes seemed to be on the same smooth muscle cell and the relative amplitudes of conducted electrotonic potentials were nearly unity. In the other 10 trials, the relative amplitudes were less than unity and the two electrodes seemed to be on different cells. Of these the largest relative amplitude was 0.57, a value obtained in two separate experiments, in one of which two electrodes were morphologically confirmed to be located on adjacent smooth muscle cells. Because the relative amplitude of conducted electrotonic potentials in the endothelial layer (0.07) was much smaller than 0.57, most of the current flow into these second smooth muscle cells presumably comes directly from the source smooth muscle cells. Thus, the resistance of the intercellular coupling between these two smooth muscle cells would be 90 MΩ, as the input resistances of these cells were each measured to be about 120 MΩ. The coupling resistance between smooth muscle cells may vary depending upon the size of the coupling area between the two cells and 90 MΩ was the minimum value we obtained.
Since the relative amplitude of the electrotonic potential in an adjacent smooth muscle cell was never greater than 0.57, it is unlikely that the signals conduct for long distances electrotonically within the smooth muscle layer. When an electrotonic potential was induced by current injection into a smooth muscle cell, it was conducted both to the neighbouring smooth muscle cells and to the whole endothelial layer. Electrotonic potentials could not be detected in smooth muscle cells more than 50 μm distant from the source cell after the endothelium had been destroyed. The small electrotonic potentials recorded from smooth muscle cells more than 25 μm distant from the source cell in preparations with intact endothelium presumably spread within the endothelial layer and then re-entered the muscle layer.
The value of 0.9 GΩ for myoendothelial coupling per smooth muscle cell was much larger than the value of 70 MΩ estimated morphologically by Sandow & Hill (2000). The difference might be due to differences in the methods or in the species used. Although there is no information about the conductance of single myoendothelial gap junction channels, the conductance of single gap junctional channels between vascular smooth muscle cells is reported to be 51-141 pS (Moore & Burt, 1995). If the myoendothelial channel has a similar conductance, the value of 0.9 GΩ (1.1 nS) would correspond to about 8-22 gap junctional channels. It may seem possible that the myoendothelial junction is of such high resistance that it is not physiologically significant. In fact, an electrotonic potential produced in a smooth muscle cell within a syncytium by current injection diminished steeply with distance as it spread, even with intact endothelium. In these experiments, the original change in polarization was induced in a single smooth muscle cell which, in turn, drove the whole syncytium. In physiological conditions, however, multiple smooth muscle cells are likely to be stimulated simultaneously by autonomic nerves. If 100 neighbouring smooth muscle cells were innervated by a single nerve fibre and produced simultaneous junction potentials, the myoendothelial coupling resistance would be only 9 MΩ. This would allow the junction potentials to be conducted effectively to the endothelial layer and thence to the smooth muscle cells in distant portions of the vessel facilitating coordinated vasomotion. This is also the case when multiple endothelial cells are stimulated simultaneously by substances such as ACh. ACh-induced hyperpolarization spreads through the endothelial layer and to smooth muscle cells via myoendothelial coupling producing coordinated vasodilatation (Welsh & Segal, 1997; Emerson & Segal, 2000a). Thus, the endothelial layer is able to function as a low resistance passage for electrical current and could therefore be important for coordinated vasoconstriction and dilatation.
Acknowledgments
The technical assistance of Hiromichi Takano is gratefully acknowledged. This work was supported by a research grant from the Japan Society for the Promotion of Science (grant no. 12670043).
References
- Anumonwo J M, Wang H Z, Trabka-Janik E, Dunham B, Veenstra R D, Delmar M, Jalife J. Gap junctional channels in adult mammalian sinus nodal cells: immunolocalization and electrophysiology. Circulation Research. 1992;71:229–239. doi: 10.1161/01.res.71.2.229. [DOI] [PubMed] [Google Scholar]
- Bény J-L, Connat J-L. An electron-microscopic study of smooth muscle cell dye coupling in the pig coronary arteries. Role of gap junctions. Circulation Research. 1992;70:49–55. doi: 10.1161/01.res.70.1.49. [DOI] [PubMed] [Google Scholar]
- Bény J-L, Pacicca C. Bidirectional electrical communication between smooth muscle and endothelial cells in the pig coronary artery. American Journal of Physiology. 1994;266:H1465–1472. doi: 10.1152/ajpheart.1994.266.4.H1465. [DOI] [PubMed] [Google Scholar]
- Corey D P, Stevens C F. Science and technology of patch-recording electrodes. In: Sakmann B, Neher E, editors. Single-Channel Recording. New York: Plenum Press; 1983. pp. 53–68. [Google Scholar]
- De Wit C, Roos F, Bolz S-S, Kirchhoff S, Krüger O, Willecke K, Pohl U. Impaired conduction of vasodilation along arterioles in connexin40-deficient mice. Circulation Research. 2000;86:649–655. doi: 10.1161/01.res.86.6.649. [DOI] [PubMed] [Google Scholar]
- Ebihara S, Shirato K, Harata N, Akaike N. Gramicidin-perforated patch recording: GABA response in mammalian neurones with intact intracellular chloride. Journal of Physiology. 1995;484:77–86. doi: 10.1113/jphysiol.1995.sp020649. [DOI] [PMC free article] [PubMed] [Google Scholar]
- Eckert R, Tillotson D L. Calcium-mediated inactivation of the calcium conductance in caesium-loaded giant neurones of Aplysia californica. Journal of Physiology. 1981;314:265–280. doi: 10.1113/jphysiol.1981.sp013706. [DOI] [PMC free article] [PubMed] [Google Scholar]
- Edwards F R, Hirst G D S. Inward rectification in submucosal arterioles of guinea-pig ileum. Journal of Physiology. 1988;404:437–454. doi: 10.1113/jphysiol.1988.sp017298. [DOI] [PMC free article] [PubMed] [Google Scholar]
- Emerson G G, Segal S S. Endothelial cell pathway for conduction of hyperpolarization and vasodilation along hamster feed artery. Circulation Research. 2000a;86:94–100. doi: 10.1161/01.res.86.1.94. [DOI] [PubMed] [Google Scholar]
- Emerson G G, Segal S S. Electrical coupling between endothelial cells and smooth muscle cells in hamster feed arteries. Role in vasomotor control. Circulation Research. 2000b;87:474–479. doi: 10.1161/01.res.87.6.474. [DOI] [PubMed] [Google Scholar]
- Furchgott R F, Zawadzki J V. The obligatory role of endothelial cells in the relaxation of arterial smooth muscle by acetylcholine. Nature. 1980;288:373–376. doi: 10.1038/288373a0. [DOI] [PubMed] [Google Scholar]
- Gabriels J E, Paul D L. Connexin43 is highly localized to sites of disturbed flow in rat aortic endothelium but connexin37 and connexin40 are more uniformly distributed. Circulation Research. 1998;83:636–643. doi: 10.1161/01.res.83.6.636. [DOI] [PubMed] [Google Scholar]
- Haas T L, Duling B R. Morphology favors an endothelial cell pathway for longitudinal conduction within arterioles. Microvascular Research. 1997;53:113–120. doi: 10.1006/mvre.1996.1999. [DOI] [PubMed] [Google Scholar]
- Hirst G D S, Neild T O. An analysis of excitatory junctional potentials recorded from arterioles. Journal of Physiology. 1978;280:87–104. doi: 10.1113/jphysiol.1978.sp012374. [DOI] [PMC free article] [PubMed] [Google Scholar]
- Kitamura K, Kuriyama H. Effects of acetylcholine on the smooth muscle cell of isolated main coronary artery of the guinea-pig. Journal of Physiology. 1979;293:119–133. doi: 10.1113/jphysiol.1979.sp012881. [DOI] [PMC free article] [PubMed] [Google Scholar]
- Little T L, Beyer E C, Duling B R. Connexin 43 and connexin 40 gap junctional proteins are present in arteriolar smooth muscle and endothelium in vivo. American Journal of Physiology. 1995a;268:H729–739. doi: 10.1152/ajpheart.1995.268.2.H729. [DOI] [PubMed] [Google Scholar]
- Little T L, Xia J, Duling B R. Dye tracers define differential endothelial and smooth muscle coupling patterns within the arteriolar wall. Circulation Research. 1995b;76:498–504. doi: 10.1161/01.res.76.3.498. [DOI] [PubMed] [Google Scholar]
- Miller B G, Gattone V H II, Overhage J M, Bohlen H G, Evan A P. Morphological evaluation of vascular smooth muscle cell: length and width from a single scanning electron micrograph of microvessels. Anatomical Record. 1986;216:95–103. doi: 10.1002/ar.1092160116. [DOI] [PubMed] [Google Scholar]
- Moore L K, Burt J M. Gap junction function in vascular smooth muscle: influence of cartooning. American Journal of Physiology. 1995;269:H1481–1489. doi: 10.1152/ajpheart.1995.269.4.H1481. [DOI] [PubMed] [Google Scholar]
- Nelson M T, Quayle J M. Physiological roles and properties of potassium channels in arterial smooth muscle. American Journal of Physiology. 1995;268:C799–822. doi: 10.1152/ajpcell.1995.268.4.C799. [DOI] [PubMed] [Google Scholar]
- Sandow S L, Hill C E. Incidence of myoendothelial gap junctions in the proximal and distal mesenteric arteries of the rat is suggestive of a role in endothelium-derived hyperpolarizing factor-mediated responses. Circulation Research. 2000;86:341–346. doi: 10.1161/01.res.86.3.341. [DOI] [PubMed] [Google Scholar]
- Segal S S, Bény J-L. Intracellular recording and dye transfer in arterioles during blood flow control. American Journal of Physiology. 1992;263:H1–7. doi: 10.1152/ajpheart.1992.263.1.H1. [DOI] [PubMed] [Google Scholar]
- Segal S S, Welsh D G, Kurjiaka D T. Spread of vasodilatation and vasoconstriction along feed arteries and arterioles of hamster skeletal muscle. Journal of Physiology. 1999;516:283–291. doi: 10.1111/j.1469-7793.1999.283aa.x. [DOI] [PMC free article] [PubMed] [Google Scholar]
- Welsh D G, Segal S S. Coactivation of resistance vessels and muscle fibers with acetylcholine release from motor nerves. American Journal of Physiology. 1997;273:H156–163. doi: 10.1152/ajpheart.1997.273.1.H156. [DOI] [PubMed] [Google Scholar]
- Welsh D G, Segal S S. Endothelial and smooth muscle cell conduction in arterioles controlling blood flow. American Journal of Physiology. 1998;274:H178–186. doi: 10.1152/ajpheart.1998.274.1.H178. [DOI] [PubMed] [Google Scholar]
- Xia J, Little T L, Duling B R. Cellular pathways of the conducted electrical response in arterioles of hamster cheek pouch in vitro. American Journal of Physiology. 1995;269:H2031–2038. doi: 10.1152/ajpheart.1995.269.6.H2031. [DOI] [PubMed] [Google Scholar]
- Yamamoto Y, Fukuta H, Nakahira Y, Suzuki H. Blockade by 18β-glycyrrhetinic acid of intercellular electrical coupling in guinea-pig arterioles. Journal of Physiology. 1998;511:501–508. doi: 10.1111/j.1469-7793.1998.501bh.x. [DOI] [PMC free article] [PubMed] [Google Scholar]
- Yamamoto Y, Imaeda K, Suzuki H. Endothelium-dependent hyperpolarization and intercellular electrical coupling in guinea-pig mesenteric arterioles. Journal of Physiology. 1999;514:505–513. doi: 10.1111/j.1469-7793.1999.505ae.x. [DOI] [PMC free article] [PubMed] [Google Scholar]
- Yeh H-I, Dupont E, Coppen S, Rothery S, Severs N J. Gap junction localization and connexin expression in cytochemically identified endothelial cells of arterial tissue. Journal of Histochemistry and Cytochemistry. 1997;45:539–550. doi: 10.1177/002215549704500406. [DOI] [PubMed] [Google Scholar]