

Abstract
Bitufted interneurons in layer 2/3 of the rat (P14) somatosensory cortex have elongated apical and basal dendritic arbors that can span the entire depth of the cortex. Simultaneous dendritic and somatic whole-cell voltage recordings combined with Ca2+ fluorescence measurements were made to quantify voltage and Ca2+ signalling in dendritic arbors of bitufted neurons.
Action potentials (APs) initiated close to the soma by brief current injection back-propagated into the apical and basal dendritic arbors and evoked a transient increase in volume-averaged dendritic Ca2+ concentration (Δ[Ca2+]i) of about 140 nM peak amplitude per AP. The AP evoked Ca2+ signal decayed with a time constant of about 200 ms.
A relatively high endogenous Ca2+ binding ratio of ≈285 determines the comparatively small rise in [Ca2+]i of bitufted cell dendrites evoked by a back-propagating AP.
The [Ca2+]i transient evoked by back-propagating dendritic APs decreased with distance (≤ 50 μm) from the soma in some neurons. At distances greater than 50 μm transients did not show a spatial gradient between the proximal and distal dendritic branches.
During trains of APs the mean amplitude of the steady-state increase in dendritic [Ca2+]i encoded the AP frequency linearly up to 40 Hz with a slope of 20 nM Hz−1.
The results suggest that APs initiated in the axon of bitufted neurons back-propagate and ‘copy’ the pattern of the axon's electrical activity also to the dendritic arbor. The AP pattern is transduced into a transient rise of dendritic [Ca2+]i which, presumably, can regulate the receptive properties of the dendritic arbor for synaptic input.
Most of the excitatory synaptic contacts in CNS neurons are located on dendrites. In pyramidal neurons of the neocortex and hippocampus the dendrites are electrically excitable because they contain voltage activated channels selective for Na+, K+ and Ca2+ (Johnston et al. 1996; Stuart et al. 1997, for review). Here APs, when initiated in the axon, back-propagate into the dendritic arbor and evoke a transient increase in dendritic calcium concentration (Δ[Ca2+]i) (Jaffe et al. 1992; Markram et al. 1995; Schiller et al. 1995; Helmchen et al. 1996). In pyramidal cells, back-propagating APs represent a global signal ‘binding’ those synaptic contacts which were active during coincident pre- and postsynaptic APs (Stuart & Sakmann, 1994; Spruston et al. 1995; Yuste & Denk, 1995; Markram et al. 1997; Magee & Johnston, 1997; Köster & Sakmann, 1998). A transient rise in dendritic [Ca2+]i can evoke long lasting changes in unitary EPSP amplitudes (Markram et al. 1997; Magee & Johnston, 1997) and in addition reduces, on a shorter time scale, the size of inhibitory and excitatory postsynaptic potentials (IPSPs and EPSPs) (Alger & Pitler, 1995; Marty & Llano, 1995; Zilberter et al. 1999).
Back-propagation of APs into dendrites of interneurons was documented for substantia nigra and the hippocampus (Häusser et al. 1995; Martina et al. 2000). The ‘bitufted’ interneurons in the neocortex which are GABAergic and somatostatin positive (Reyes et al. 1998) have their somata located predominantly in supragranular layers 2/3 and layer 4. They are characterized by elongated vertically oriented dendritic arbors often spanning the entire depth of the cortex (Peters, 1984). Bitufted neurons are target cells of axon collaterals from neighbouring pyramidal neurons and also for local inhibitory multipolar neurons (Reyes et al. 1998; A. Rozov & N. Burnashev, unpublished observation). Axon collaterals of bitufted cells in turn project to pyramidal cells, to neighbouring bitufted and to multipolar cells in the same layer and form inhibitory, GABAergic synaptic contacts (Reyes et al. 1998) which are located on the soma and dendrites of these target neurons (Peters & Harriman, 1988; Tamas et al. 1998).
The aim of the present experiments was to find out firstly whether the dendrites of bitufted neurons were electrically excitable and whether their excitation mediates dendritic Ca2+ influx. Secondly to delineate the determinants of size and time course of dendritic Ca2+ influx as we reported previously that a rise in dendritic [Ca2+]i triggers retrograde synaptic signalling (Zilberter et al. 1999). The results show that AP dependent dendritic [Ca2+]i transients are likely to be a part of a signalling pathway which can limit the excitatory synaptic input to bitufted neurons, depending on the rate of APs they elicit. Due to the relatively high Ca2+ binding ratio of their dendrites the retrograde Ca2+ signalling mechanism is less sensitive to differences in AP frequency than in pyramidal cells but it spans a wider range of frequencies.
METHODS
Slice preparation and selection of bitufted interneurons
Brain slices from 14- to 16-day-old (P14-16) Wistar rats were prepared as described previously (Markram et al. 1997). All animal procedures were carried out according to the animal welfare guidelines of the Max Planck Society. Briefly, rats were decapitated and 300 μm thick slices were cut from the somatosensory cortex. Slices were incubated for 30 min at 37 °C in oxygenated extracellular solution and then kept at room temperature until they were transferred to the recording chamber. The extracellular solution contained (mm): 125 NaCl, 2.5 KCl, 25 glucose, 25 NaHCO3, 1.25 NaCl2PO4, 2 CaCl2 and 1 MgCl2. Bitufted neurons in layer 2/3 were identified by their elongated somata with the aid of IR-DIC videomicroscopy (Zeiss Axioplan-FS2, Jena, Germany). Only those bitufted cells were chosen for further experiments which showed upon somatic current injection of 400 ms the characteristic firing pattern of somatostatin-positive bitufted interneurons with decreasing amplitude and slight adaptation (Reyes et al. 1998).
Electrophysiology
Whole-cell voltage recordings from the soma and proximal dendrites of bitufted neurons were made with patch pipettes (5-8 and 10-20 MΩ resistance, respectively). Signals were amplified using Axoclamp 2B amplifiers (Axon Instruments, Foster City, CA, USA). Records were sampled at intervals between 10-100 μs, digitized by an ITC-16 interface (Instrutech, Port Washington, NY, USA) and stored on the hard disk of a Macintosh computer for off-line analysis (Igor Wavemetrics, Lake Oswego, OR, USA). Experiments were done at 32-34 °C unless otherwise indicated. Membrane voltage was recorded with pipettes containing (mm): 105 potassium gluconate, 30 KCl, 4 ATP-Mg, 10 phosphocreatine, 0.3 GTP and 10 Hepes (pH 7.3). Single APs in bitufted neurons were evoked by brief (2 or 5 ms) current pulses delivered by the recording pipette. Short bursts of APs were either evoked by steps of 50 ms current injection into the soma or each AP was evoked separately by a single current pulse of 2 ms.
Morphology
Biocytin (1.5-3 mg ml−1) was added to the internal pipette solution, which for the Ca2+ imaging experiments also contained the calcium ion indicator fura-2. Neurons were filled with biocytin during the experiments. After electrical and optical recordings were finished, slices were fixed for 24-48 h in cold (4 °C) 100 mm phosphate-buffered solution (PB, pH 7.4) containing 4 % paraformaldehyde. After rinsing the slices in PB, blocking the endogenous peroxidases with phosphate-buffered 3 % H2O2 and rinsing again in PB, the slices were incubated for 2 h in biotinylated horseradish peroxidase conjugated to avidin (ABC-Elite, Vector Labs, Peterborough, UK) and developed. The outline of the neuron's dendritic arbor and axonal collaterals was traced by a Neurolucida tracing system (MicroBrightField, Colchester, VT, USA).
Ca2+ fluorescence imaging
Neurons were filled via somatic patch pipettes containing fura-2 (Molecular Probes, Eugene, OR, USA) at concentrations ranging from 50 to 500 μm in different experiments. A monochromatic light source was used for fluorescence excitation (T.I.L.L. Phototonics, Planegg, Germany) at the Ca2+ dependent and independent wavelengths of 356 and 380 nm, respectively, for ratioing. The fura-2 fluorescence was imaged with a × 60 Olympus immersion objective (Tokyo, Japan). A back-illuminated, frame transfer CCD camera with a pixel size of 15 μm × 15 μm (Princeton Instruments, Trenton, USA supported by Visitron, Puchheim, Germany) was used to acquire mean traces from up to nine regions of interest simultaneously, at a frequency of 100 Hz at 12 bit resolution. Regions of interest typically had a size of 2-4 μm × 3-10 μm. Mean Ca2+ traces were taken from 3-5 sweeps, if not mentioned otherwise. Loading curves were measured in the initial portion of apical or basal dendrites about 15-25 μm away from the soma of the neuron.
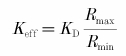
The ratio of fluorescence data was calculated according to R = (F356 - B356)/(F380 - B380), with F356 and F380 the fluorescence signals at 356 and 380 nm, respectively, and B356 and B380 the corresponding background signals acquired at a nearby region. The fluorescence ratio was converted to Ca2+ concentrations using the standard conversion formula (Grynkiewicz et al. 1985):
where Rmin is the ratio when no Ca2+ is bound to fura-2 and Rmax when fura-2 is completely bound to Ca2+. Rmin and Rmax were determined by loading neurons with the standard intracellular solution containing in addition 20 mm EGTA or 20 mm CaCl2, respectively, and had typical values of 0.8-1.1 and 3.5-5.5.
 |
is the effective dissociation constant of fura-2. For the dissociation constant KD of fura-2 for Ca2+ binding we used 286 nm (Helmchen et al. 1996).
Ca2+ binding ratio
The differential Ca2+ binding ratio of a Ca2+ buffer was calculated according to (Helmchen et al. 1996):
 |
An estimate for the Ca2+ buffer capacity of endogenous buffer was obtained as described elsewhere (Helmchen et al. 1996). Briefly, plots of the inverse of the [Ca2+]i amplitudes and the decay time constants versus the Ca2+ binding ratio give negative X-axis intercepts which are an estimate of the endogenous Ca2+ buffer capacity.
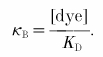
In some experiments neurons were filled with low affinity, non-ratiometric dyes Oregon Green 488 BAPTA-5N (dissociation constant KD of 20 μm; Molecular Probes) and Magnesium Green (KD of 6 μm; Molecular Probes) at concentrations of 500, 1250 and 2000 nm for independently estimating the time course of [Ca2+]i transients and the Ca2+ binding ratio of the endogenous buffers. The Ca2+ binding ratio for a given dye concentration was calculated as:
 |
Excitation wavelengths for these dyes were 488 nm.
Correction of [Ca2+]i amplitudes for exogenous fura-2
The measured [Ca2+]i amplitude A is given by eqn (4) in Helmchen et al. (1996):
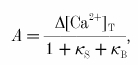 |
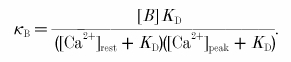
where Δ[Ca2+]T is the total change in Ca2+ concentration, and κS and κB are the Ca2+ binding ratios of endogenous and exogenous buffers, respectively. For κB = 0 the undistorted [Ca2+]i amplitude A0 is:
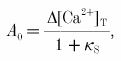 |
corrected for the additional Ca2+ buffer capacity of the Ca2+ indicator. Thus, the undistorted [Ca2+]i amplitude A0 is given by:
 |
Using eqn (1) for the incremental Ca2+ binding ratio, the corrected Ca2+ amplitude A0 can be written as:
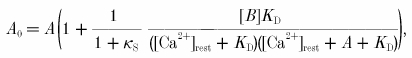 |
where the term in parentheses is the correction factor. Figure 1 shows the dependence of the correction factor for bitufted neurons on the measured peak [Ca2+]i amplitude for different fura-2 concentrations. For example, for experiments made with 250 μm fura-2 (KD = 286 nm) - using the measured values of 75 nm for mean [Ca2+]i resting level, an endogenous Ca2+ binding ratio of κS = 285 and an average [Ca2+]i amplitude of 58 nm (n = 24) - the amplitude of the undisturbed [Ca2+]i transient is calculated to be 154 nm.
Figure 1. Correction factors for measured peak [Ca2+]i amplitudes (Methods).
Dependence of the correction factor for [Ca2+]i amplitudes on the measured peak [Ca2+]i amplitude. Correction factors were calculated for bitufted neurons according to eqn (3) using the endogenous Ca2+ binding ratio of κS = 285 and the [Ca2+]i resting level of 75 nm. Correction factors were plotted for different fura-2 concentrations.
RESULTS
Dendritic and axonal arbors of bitufted cells
Bitufted interneurons were identified readily in layer 2/3 of sagittal and thalamocortical slices of the somatosensory cortex by their elongated somata and their principal primary dendrites which extend in the vertical direction both apically and basally (Reyes et al. 1998).
Reconstruction of the dendritic and axonal arbors of biocytin-filled neurons allowed visualization of dendritic branches and axon collaterals. In thalamocortical slices (Agmon & Connors, 1991) the location of bitufted cell dendrites and axon collaterals with respect to individual cortical columns can be identified (Fig. 2). Whereas the dendritic arbor often spanned the cortex but was restricted to the width of a column, the axonal arbor extended across the column borders. In sagittal slices this difference between the dendritic and axonal domains is more clearly seen (Fig. 3A and C). Their dendritic arbor corresponded to the somatostatin positive class of GABAergic inhibitory interneurons (Reyes et al. 1998). The axon often originated from the soma (Fig. 3B), but less frequently could also originate from a dendrite. The axonal arbor in all bitufted neurons examined extended vertically towards the pial surface with extensive collateralisation in layer 1, layer 2/3 and upper layer 4 (Fig. 3C). As bitufted neurons are targets of recurrent collaterals originating from axons of neighbouring pyramidal neurons in layer 2/3 (Reyes et al. 1998) and as one third of 29 pyramidal-to-bitufted cell connections were reciprocal (K. M. M. Kaiser & Y. Zilberter, unpublished observation) this could indicate that axon collaterals establish synapses predominantly on apical dendrites of pyramidal neurons. In addition, in all reconstructed neurons fewer axon collaterals also extended to infragranular cortical layers (Fig. 3C) in a columnar fashion. Lateral branching in the infragranular layers was infrequent, as axon collaterals were orientated vertically, often positioned in parallel to dendritic branches. The differences between supra- and infragranular domains of dendritic and axonal arbors of bitufted interneurons are summarized in Table 1. The field spans of the dendritic and axonal arbors suggest that bitufted interneurons integrate signals from all cortical layers and inhibit predominantly layer 2/3 cells (Reyes et al. 1998), presumably across several columns.
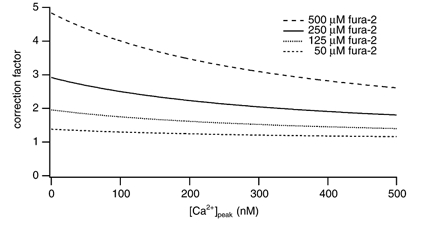
Figure 2. Location of a layer 2/3 bitufted interneuron in relation to individual cortical columns.
Superposition of an IR-DIC video image of a thalamocortical brain slice with recording pipette and reconstruction of a bitufted interneuron filled with biocytin. The dendritic arbor of the interneuron is shown in red, the axonal arbor in blue. Borders of barrels in layer 4 are outlined in black. Scale bar 200 μm.
Figure 3. Dendritic and axonal arbors of a layer 2/3 bitufted interneuron.
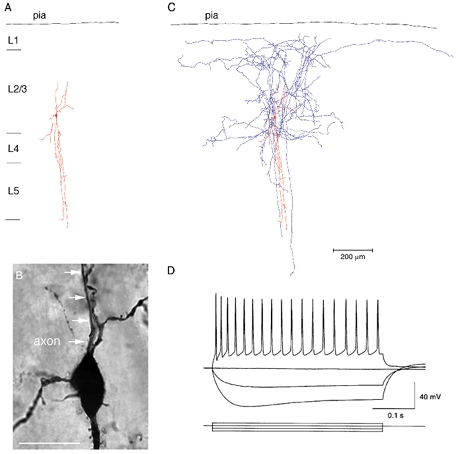
A, reconstruction of the dendritic arbor of a bitufted interneuron filled with biocytin. The dendritic arbor almost spans the width of the cortex and shows the arborization typical for bitufted cells. B, light microscopic image of the soma and initial parts of dendrites and axon of the bitufted cell shown in A. The axon originates from the soma and is indicated by white arrows. Note that some dendritic branches are spiny. Scale bar 20 μm. C, dendritic and axonal arbor of the same cell. Axon collaterals (blue) project predominantly to the supragranular layers. Some axon collaterals project in parallel with the basal dendritic branches to infragranular layers. D, characteristic firing pattern of a bitufted interneuron upon current injection. Resting membrane potential was −60 mV. Data are taken from a different neuron than that illustrated in A-C.
Table 1.
. Quantification of dendritic and axonal length of bitufted interneurons in layer 2/3
| Type | Parameter | Length (μm) | (n) |
|---|---|---|---|
| Soma | Vertical diameter | 25 ± 5 | (4) |
| Horizontal diameter | 10 ± 1 | (4) | |
| Dendrites: Apical | Vertical field span | 167 ± 16 | (4) |
| Horizontal field span | 209 ± 119 | (4) | |
| Basal | Vertical field span | 379 ± 143 | (4) |
| Horizontal field span | 150 ± 45 | (4) | |
| Axon collaterals | Total vertical field span | 1279 ± 396 | (4) |
| Horizontal field span in L2/3 | 970 ± 309 | (4) | |
| Horizontal field span in L5 | 193 ± 112 | (4) |
(n) is the number of neurons.
In addition to morphological criteria, bitufted interneurons showed a characteristic electrical response (Reyes et al. 1998). Upon depolarizing somatic current injection, they discharged APs at > 20 Hz which decreased in amplitude and accommodated only slightly in frequency (Fig. 3D). The resting potential of bitufted interneurons was -58.6 ± 3.0 mV (mean ± s.d.; n = 49).
Back-propagating APs in dendrites
Simultaneous somatic and dendritic whole-cell voltage recordings were made from the soma and either the apical or basal primary dendrites (Fig. 4A). Due to the relatively short distance between the two recording sites (< 100 μm), the time delay between the APs was short (less than 1 ms) and therefore these experiments were performed at 24 °C. To identify the site of axon origin, the recorded neurons were filled with biocytin during recording and their morphology was reconstructed.
Figure 4. Action potentials in soma and dendrites of bitufted neurons.
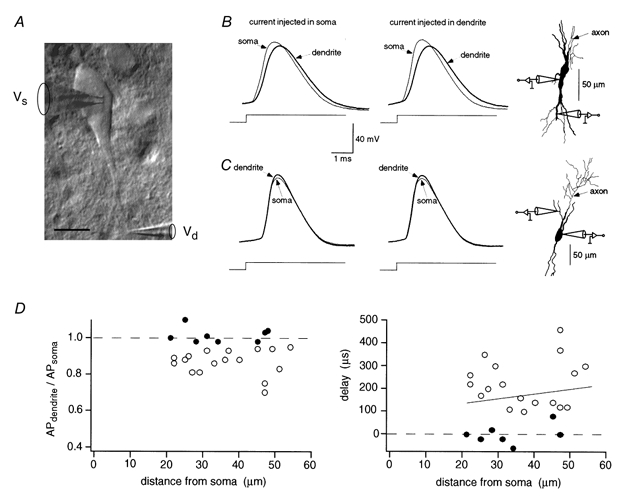
A, IR-DIC video image of soma and principal apical and basal dendrites and somatic and dendritic recording pipettes. The axon of this neuron originated from the soma. Scale bar 10 μm. B, simultaneous dual somatic and dendritic whole-cell voltage recording. APs evoked by current injection through either somatic (left) or dendritic (middle) recording pipette. Data are from a different neuron than shown in A. The axon originated from the soma as shown by the partial reconstruction of the interneuron (right). C, simultaneous somatic and dendritic APs. Stimulating protocols according to B. The axon of this neuron originated from an apical dendrite between the recording pipettes as shown in the partial reconstruction (right). D, relative amplitudes and delay between dendritic and somatic APs. Time delay of AP peaks is plotted as a function of distance between recording pipettes (right). Values from 25 paired recordings. The data for neurons which showed a delay between somatic and dendritic APs (○) were fitted by linear regression with a slope of 2 μs μm−1. In other experiments (•) the dendritic patch pipette was located close to the dendrite from which the axon originated. Comparison of amplitudes does not indicate a difference between somatic and dendritic APs up to 50 μm away from the soma.
Figure 4B shows APs recorded simultaneously at the soma and a basal dendrite, respectively. Following current injection via either the somatic or dendritic pipette, the somatic AP preceded the dendritic AP which had a slightly smaller amplitude (94 %). In this neuron, the axon originated from the soma, indicating that the AP was initiated in the soma-axon region and back-propagated into the basal dendrite. The same sequence of APs recorded from the soma and a main dendrite was observed in 17 neurons. The amplitude ratio of dendritic and somatic AP was 87 ± 7 % (P < 0.01, n = 17, paired t test) (Fig. 4D, left, open circles). The delay between peaks of dendritic and somatic APs increased with the distance between the two recording pipettes (Fig. 4D, right panel, open circles). In eight other experiments, the dendritic APs had an amplitude similar to the somatic AP and no delay was measurable (Fig. 4C and D, filled circles). Reconstruction of these neurons revealed that the axon originated from a dendrite close (< 50 μm) to the site of the dendritic recording pipette. Figure 4C (right) shows an example of a reconstruction of such a neuron.
Single AP evoked dendritic [Ca2+]i transient
Loading of dendrites with the Ca2+ indicator fura-2 via the somatic recording pipette and fluorescence imaging indicated that APs evoke dendritic [Ca2+]i transients. Addition of Cd2+ (100 μm) to the bath solution blocked [Ca2+]i transients completely, without affecting AP initiation, in four out of 12 dendritic regions from three different cells. In the other eight regions, which were located closer to the soma, [Ca2+]i transients were reduced to 16 ± 10 % of control. Regions were on average 21 ± 17 μm (n = 12) from the soma. This suggested that the Ca2+ signal is mediated by dendritic voltage-dependent Ca2+ channels (VDCC) that are activated during back-propagating APs. Addition of TTX (1 μm) blocked initiation of APs in the soma (n = 8). Concomitantly, somatic and dendritic [Ca2+]i transients were almost completely abolished. The remaining Ca2+ signal was restricted to regions close to the soma (up to 50 μm) and presumably was due to activation of VDCCs during passive spread of somatic depolarization.
Calcium buffering in dendrites
To quantify the amplitude and time course of [Ca2+]i transients in dendrites, we first estimated the endogenous Ca2+ binding ratio of dendrites (Neher & Augustine, 1992; Helmchen et al. 1996) by loading single cells with exogenous Ca2+ buffer (fura-2, 250 μm, Fig. 5A) and recording [Ca2+]i transients evoked by single APs during loading. Loading of dendrites close to the soma (20 μm away from the soma) was completed within 3-6 min after break-in (Fig. 5B). Bitufted neurons had a dendritic [Ca2+]i resting level of 84 ± 44 nm (n = 43). Single APs evoked [Ca2+]i transients that decreased in amplitude and decayed more slowly with loading (Fig. 5B, lower traces).
Figure 5. Endogenous Ca2+ binding ratio of dendrites of bitufted neurons.
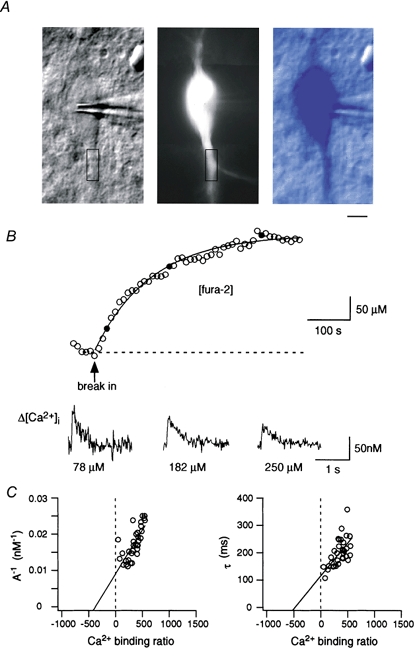
A, identification and fura-2 loading of bitufted interneurons in layer 2/3. Left, IR-DIC image of the soma and initial segments of principal apical and basal dendrites of a bitufted neuron. Note the elongated shape of the soma. The rectangle indicates a region selected on a primary basal dendrite which was used for the loading curve measurements. Middle, fluorescence image of the same neuron after complete loading with 250 μm fura-2. Right, digital superposition in pseudo-colour of the IR-DIC image and fluorescence image of the same neuron. Scale bar 5 μm. B, fura-2 (250 μm) loading curve of the proximal region of a primary basal dendrite. Fluorescence recordings were made from the dendritic region indicated by the rectangle in A at different times after pipette ‘break-in’. The loading curve was fitted with a single exponential (τ = 137 s). The half-loading time was about 2 min. Single APs were initiated by 8 ms step current injection via the somatic patch pipette. Traces (lower part) represent the ratiometrically calculated [Ca2+]i transients at different times during loading (• in graph). Continuous line indicates fitted exponential. The decay time constant of the Ca2+ transient was 137 ms at a fura-2 concentration of 78 μm and increased to 243 ms at 250 μm fura-2. Ca2+ traces are single sweeps. C, peak amplitude and decay time constant of [Ca2+]i transients of the same neuron evoked by a single AP were plotted versus the Ca2+ binding ratio calculated according to eqn (2) (Methods). Negative X-axis intercepts of 410 and 519 are estimates for the endogenous Ca2+ binding ratio of this neuron.
The concentration dependence of peak amplitude and decay time constant of [Ca2+]i transients measured during loading of neurons was used for estimating the endogenous Ca2+ binding ratio of bitufted cell dendrites from the negative X-axis intercepts (Fig. 5C and Fig. 6A). This ratio was on average 285 (n = 19 regions) for loading experiments. The extrapolated values for the amplitude and the decay time constant of a [Ca2+]i transient evoked by a single AP without adding exogenous buffer were 140 nm and 170 ms, respectively.
Figure 6. Amplitude and time course of dendritic [Ca2+]i transients in bitufted neurons.
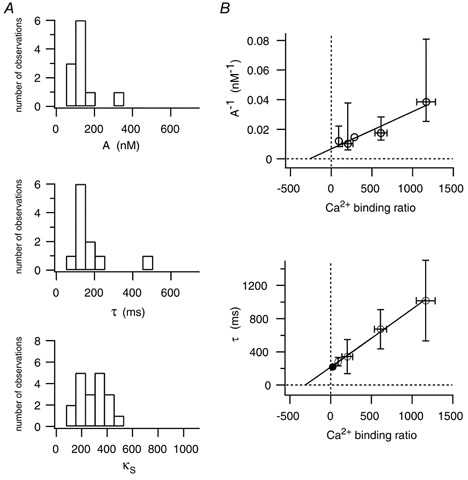
A, histograms for dendritic Ca2+ signalling of bitufted neurons obtained after loading single cells with fura-2. Data are from 11 recording sites of 7 different neurons. [Ca2+]i transients had a mean peak amplitude of 136 nm (top) and a decay time constant of 170 ms (middle). The average endogenous Ca2+ binding ratio was 285 (bottom). See also Table 2. B, dependence of dendritic [Ca2+]i amplitudes (top) and decay time constants (bottom) evoked by single APs on the Ca2+ binding ratio of bitufted neurons. Data are pooled from different neurons (n = 45) filled with different concentrations of fura-2 (○). Decay time constants from experiments with Oregon Green 488 BAPTA-5N (•, n = 4) are in line with those obtained with fura-2. The peak amplitude and decay time constant of [Ca2+]i amplitudes without exogenous buffer were 150 nm and 218 ms, respectively. Negative X-axis intercepts of the [Ca2+]i amplitudes and decay time constants give endogenous Ca2+ binding ratios of 263 and 302, respectively. See also Table 2.
Another method of estimating the endogenous Ca2+ binding ratio is by loading different neurons with different concentrations of fura-2 (ranging from 25 to 500 μm). Figure 6B shows the pooled data (open circles) for [Ca2+]i amplitudes (top) and decay time constants (bottom). These measurements give a Ca2+ binding ratio of approximately 288 for bitufted neurons and is consistent with the binding ratios obtained from loading experiments with single neurons (Fig. 6A). To get an independent estimate of the time course of dendritic Ca2+ signalling we also used the low affinity dye Oregon Green 488 BAPTA-5N (KD = 20 μm) at concentrations of 500 and 1250 μm. As Oregon Green 488 BAPTA-5N is a non-ratiometric Ca2+ indicator, we could use only the decay time constant of [Ca2+]i transients to estimate the Ca2+ binding ratio (Fig. 6B, bottom, filled circle). The decay time constants of [Ca2+]i transients measured with this indicator were consistent with those obtained with low concentrations of fura-2 (Fig. 6B, open circles). Experiments made with another low affinity dye Magnesium Green (KD = 6 μm) at concentrations of 100, 500 and 2000 μm showed, however, faster decay time constants of [Ca2+]i transients (not shown, Table 2) and probably indicate a faster on-rate of Magnesium Green (Markram et al. 1998).
Table 2.
[Ca2+]i dynamics in proximal dendrites of layer 2/3 neurons
| Bitufted interneuron | Layer 2/3 pyramid | ttest | ||||
|---|---|---|---|---|---|---|
| [Ca2+]i transients | ||||||
| A(nM) | from loading curves with fura−2 | 136 ± 77 | (11) | 190 ± 69 | (10) | P < 0.06 |
| from pool [fura−2] | 150 ± 57 | (45) | 243 ± 135 | (47) | NA | |
| ΔF/F(%) | from pool [Magnesium Green] | > 0.56 ± 0.14 | (34) | > 1.03 ± 0.62 | (12) | NA |
| τ (ms) | from loading curves with fura−2 | 170 ± 101 | (11) | 86 ± 38 | (13) | P < 0.01 |
| from pool [fura−2] | 218 ± 1 | (45) | 136 ± 1 | (47) | NA | |
| from pool [fura−2] and [OG-5N] | 212 ± 1 | (49) | 139 ± 1 | (57) | NA | |
| from pool [Magnesium Green] | < 146 ± 35 | (34) | 42 ± 18 | (60) | NA | |
| Ca2+ binding ratio | ||||||
| κS | from A−1 (loading with fura-2) | 265 ± 95 | (8) | 179 ± 42 | (5) | P = 0.12 |
| from τ (loading with fura-2) | 305 ± 129 | (11) | 190 ± 153 | (12) | P < 0.06 | |
| from A−1 (pool fura-2) | 263 ± 110 | (45) | 196 ± 83 | (25) | NA | |
| from ± (pool fura-2) | 313 ± 2 | (45) | 237 ± 2 | (47) | NA | |
| from ± (pool fura-2 and OG-5N) | 302 ± 2 | (49) | 243 ± 2 | (57) | NA | |
| from ± (pool Magnesium Green) | — | 80 ± 34 | (60) | NA | ||
| [Ca2+]i plateau levels | ||||||
| slope (nM Hz−1) | 21 ± 11 | (7) | 42 ± 22 | (13) | P < 0.006 | |
| range of linearity up to … (Hz) | 40 | (7) | 16 | (13) | NA | |
[Ca2+]i dynamics in dendrites of bitufted interneurons in layer 2/3 compared with pyramidal neurons in layer 2/3. A refers to the peak of the dendritic [Ca2+]i transient evoked by a single AP initiated by somatic current injection; ± refers to the decay time constant of this transient. Both A and ± are extrapolated to the zero fura-2 binding ratio. κS refers to the extrapolated Ca2+ binding ratio of the endogenous buffer; slope refers to the steady-state [Ca2+]i elevation during AP stimulation with different frequencies and the range of linearity gives the value up to which the slope is linear. Beyond this range the [Ca2+]i plateau levels saturate. All values are given as means ± S.D. The number of dendritic recording sites from different cells is given in parentheses. The [Ca2+]i transients were measured at proximal dendritic sites which were on average 20 μm away from the soma. Probability (P) values resulting from a t test are given in the right column.
In parallel experiments on apical dendrites of pyramidal neurons in layer 2/3, the dendritic [Ca2+]i transients evoked by a single back-propagating AP decreased more steeply in amplitude and the decay time constant increased severalfold during loading of pyramidal cells with fura-2 (data not shown). This difference in the effect of increasing fura-2 concentration on the amplitude and decay time constant of AP evoked [Ca2+]i transients implies a higher Ca2+ binding ratio of the endogenous buffer of bitufted neurons. The measurements on dendrites of layer 2/3 pyramidal neurons indicated a ratio of approximately 185 (n = 17 regions) (data not shown).
Table 2 summarizes the dendritic Ca2+ signalling of layer 2/3 bitufted and pyramidal neurons. The dynamics of [Ca2+]i transients in bitufted dendrites are characterized by smaller peak amplitudes and longer decay time constants in comparison with pyramidal neuron apical dendrites which is probably due to their higher endogenous Ca2+ binding ratio.
Frequency dependence of dendritic [Ca2+]i transients
When a train of APs was evoked, the individual AP-evoked [Ca2+]i transients summed to reach a plateau value and at an AP frequency of 8 Hz or higher, the [Ca2+]i transients evoked by individual APs merged to an oscillating [Ca2+]i plateau (Fig. 7A). The time of reaching this plateau in dendritic [Ca2+]i was about 550 ms (Fig. 7A). The amplitude of the [Ca2+]i plateau increased linearly with frequency (Fig. 7B) and is independent of the concentration of the used Ca2+ indicator (Helmchen et al. 1996). The slope of the relation between the AP frequency and [Ca2+]i plateau was, in most experiments, about 20 nm Hz−1 (Fig. 7C). For low and intermediate stimulation frequencies, the time course of the rise in [Ca2+]i could be fitted with a single exponential, whereas at high frequency stimulation (40 Hz) two time constants were apparent. This double exponential rise in [Ca2+]i was observed only in dendritic regions close to the soma (< 10 μm) (n = 2) and could reflect a Ca2+ dependent enhancement of intracellular [Ca2+]i either by Ca2+ release from internal stores or by Ca2+ activated Ca2+ influx.
Figure 7.
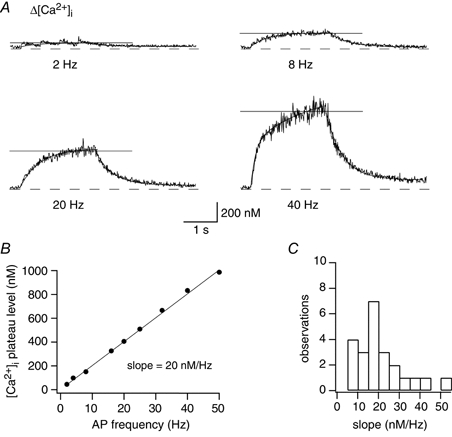
Dendritic [Ca2+]i transients evoked by trains of APs
A, dendritic [Ca2+]i transients evoked by a train of APs for 2 s: AP frequency was 2, 8, 20 and 40 Hz. Recordings were made 10 μm from the soma after loading the neuron for 10 min with 100 μm fura-2. Horizontal lines indicate the plateau value of [Ca2+]i calculated as the average value of the last second. Rise times were fitted by single exponentials and were 529 ms (2 Hz), 518 ms (8 Hz), 580 ms (20 Hz) and by double exponential for 40 Hz with time constants of 138 ms and 1891 ms. B, example of the dependence of dendritic [Ca2+]i plateau on frequency of APs (same neuron as in A). The data were fitted by a linear regression (slope: 20 nm Hz−1). C, histogram of linear regression slopes for all experiments. The data represent measurements from 10 dendritic regions (21 ± 13 μm from soma) of 4 different bitufted neurons. The mean increase of the [Ca2+]i plateau level was 23 ± 6 nm Hz−1 (n = 10).
Spatial profile of dendritic [Ca2+]i transients
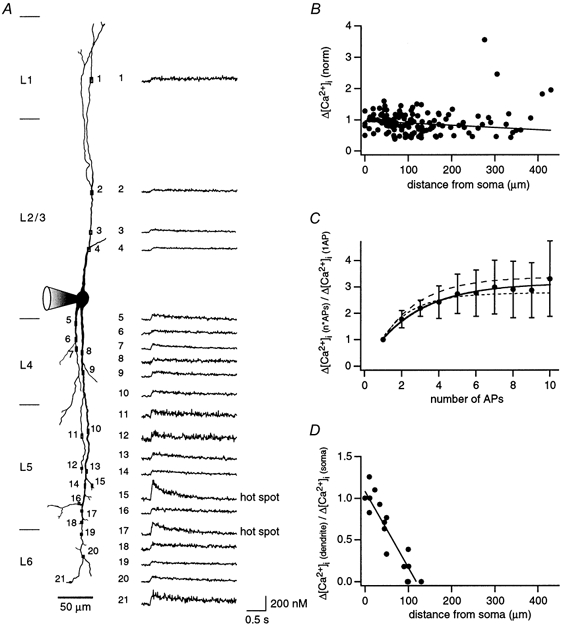
The spread of Ca2+ signals from the soma into apical and basal dendrites was determined by fluorescence imaging along dendritic trunks. Figure 8A (left panel) and Fig. 9A (left panel) show reconstructions of dendritic arbors of cells loaded with 100 and 500 μm fura-2, respectively. The corresponding spatial profiles of [Ca2+]i transients evoked by single APs (Fig. 8A) or by a short train of 4 APs (Fig. 9A) are shown on the right. Single APs evoked [Ca2+]i transients in the entire dendritic arbor in most cells. In a smaller fraction, where a single AP did not evoke a detectable Ca2+ signal in some dendritic regions (Fig. 8B, upper panel), trains of 2 or 4 APs always did (Fig. 8B, lower panel), probably indicating a low S/N ratio in these regions. In 6 of 17 cells a decrease of peak [Ca2+]i transients was observed in the initial dendritic portion close (≤ 50 μm) to the soma. Beyond this segment in these neurons and for the other neurons for the entire dendrite the amplitudes of [Ca2+]i transients did not show a spatial gradient up to about 400 μm distal to the soma, in both apical and basal dendrites. Infrequently, however, in distal dendritic regions the [Ca2+]i transient had a severalfold higher amplitude than in adjacent regions (Fig. 9A, region 15 and 17).
Figure 8. Spatial profile of dendritic [Ca2+]i transients evoked by a single AP and bursts of 4 APs.
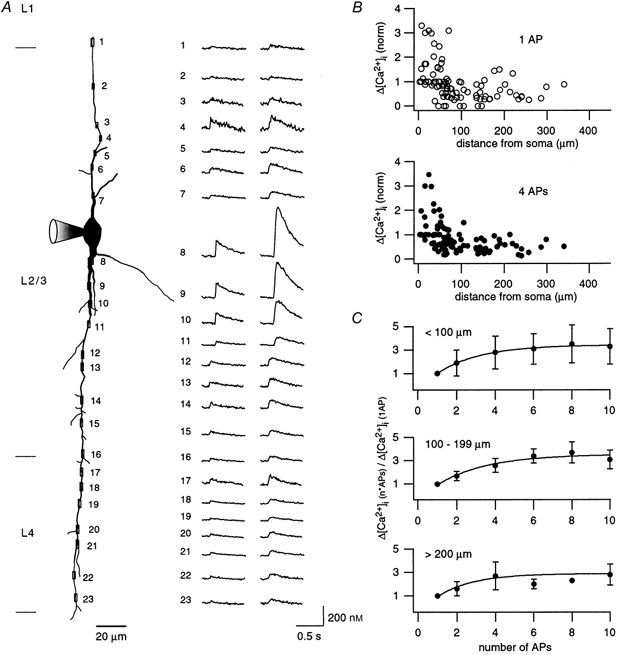
A, reconstruction from the fluorescence image of a bitufted neuron loaded with 100 μm fura-2. Location of selected regions for Ca2+ measurements on apical and basal dendrites at different distances from the soma are indicated by rectangles and numbers. The reconstruction is a montage from several fluorescence images taken successively. The corresponding dendritic [Ca2+]i transients evoked by either a single AP or a short burst of 4 APs at 80 Hz are shown on the right for each recording site. To account for the influence of fura-2 on the [Ca2+]i transients, [Ca2+]i amplitudes are underestimated by a factor of approximately 2. Note the decrease in amplitude in one of the initial dendritic segments. B, dependence of the peak [Ca2+]i amplitude evoked by a single AP (upper) and bursts of 4 APs (lower) on distance from the soma. Results from 10 dendrites from 6 neurons were normalized for dendrites without initial decrease to the amplitude of the dendritic [Ca2+]i transient nearest to the soma. For the other dendrites amplitudes were normalized to the [Ca2+]i amplitude beyond the initial decrease. For proximal regions (≤ 50 μm) large values illustrate dendrites which show decrease of [Ca2+]i amplitude in the initial portion. C, dependence of [Ca2+]i amplitudes on the number of APs for proximal (upper), intermediate (middle) and distal dendritic regions (lower). [Ca2+]i transients were evoked by a single or a short train of APs (up to 10) at 80 Hz. The corresponding [Ca2+]i amplitudes were normalized to the [Ca2+]i amplitude evoked by a single AP. Data for proximal, intermediate and distal regions were taken on average 38 ± 69 μm (n = 69 regions, 12 neurons), 148 ± 30 μm (n = 20 regions, 4 neurons) and 250 ± 42 μm (n = 11 regions, 2 neurons) distal from the soma, respectively.
Figure 9.
Dendritic [Ca2+]i hot spots and dependence of dendritic [Ca2+]i signals on active back-propagation
A, reconstruction from the fluorescence image of a bitufted neuron. Fura-2 concentration in the recording pipette was 500 μm. Location of selected regions for Ca2+ measurements on apical and basal dendrites at different distances from the soma are indicated by rectangles and numbers. The reconstruction is a montage from several fluorescence images taken successively. The corresponding dendritic [Ca2+]i transients evoked by a short burst of 4 APs at 80 Hz are shown on the right for each recording site. To account for the influence of fura-2 on the [Ca2+]i transients, [Ca2+]i amplitudes are underestimated by a factor of approximately 4. B, dependence of the peak [Ca2+]i amplitude on distance from the soma: Results from 11 neurons were normalized to the amplitude of the dendritic [Ca2+]i transient closest to the soma. In each neuron, [Ca2+]i transients were evoked by short bursts of 4 APs at 80 Hz. Data are approximated by linear regression (r = -0.14). C, dependence of [Ca2+]i amplitudes on the number of APs. [Ca2+]i transients were evoked by a single or short train of APs (up to 10) at 80 Hz. The corresponding [Ca2+]i amplitudes were normalized to the [Ca2+]i amplitude evoked by a single AP. A plateau value for the [Ca2+]i amplitude, which was 2.9-fold that of a single AP, was reached with 6 APs. Continuous line shows an exponential fit, dashed lines show the corresponding fits for experiments with 4 APs at 50 and 90 Hz (raw data not shown). Data were taken from 10 dendritic regions out of 5 neurons. Regions were located on average 15 ± 10 μm from the soma. D, effect of TTX on dendritic Ca2+ transients. Neurons (n = 3) were voltage clamped at the soma and the AP waveform was used as a voltage-clamp command. The [Ca2+]i transient measured at the soma before TTX application served as a control. In the presence of TTX the AP waveform voltage clamp command was increased until a similar somatic [Ca2+]i transient was obtained as in control. The line represents a linear regression (r = -0.93).
Figure 8B and Figure 9B show the dependence of [Ca2+]i transients on distance from the soma. Amplitudes of Ca2+ signals measured along the dendrites were normalized either to the amplitude of the [Ca2+]i transient in the region beyond the initial decrease (n = 6 neurons, Fig. 8B) or to the region closest to the soma (n = 11 neurons, Fig. 9B). For example, [Ca2+]i transients for the neuron shown in Fig. 9A were normalized to the peak [Ca2+]i amplitude measured at region 5. Here we observed two dendritic regions where the peak of the [Ca2+]i transients exceeded by 2-fold the mean peak transient of the neuron (Fig. 9A region 15 and 17). These regions are referred to as ‘hot spots’. Hot spots were distal and located on different branches. The decay time constants of [Ca2+]i transients at the two hot spots were about 2-fold smaller than the average decay time constant of the five adjacent dendritic regions.
Interneurons are often active in bursts of APs. To determine the dependence of the [Ca2+]i influx on the number and frequency of back-propagating APs, we evoked trains of APs. Short bursts of four APs at 80 Hz gave rise to a [Ca2+]i transient with an amplitude which was 2.5-fold higher than that evoked by a single AP (n = 10, Fig. 9C). Stimulating with 6 to 10 APs slightly increased the amplitude (2.9-fold of that to a single AP). Similar results were obtained for short bursts of four APs at 50 and 80 Hz, respectively (Fig. 9C, dashed lines). The dependence of the [Ca2+]i transients on the number of APs was comparable for proximal (< 100 μm), intermediate (100-199 μm) and distal dendritic regions (> 200 μm) (Fig. 8C).
Spatial profile of [Ca2+]i transients after block of Na+ channels
To find out whether active AP propagation into the dendrite is required to initiate [Ca2+]i transients in distal dendrites, dendritic [Ca2+]i transients were measured also following an AP or a burst of four APs at 80 Hz in control solution and during voltage clamping of the somatic membrane with the corresponding AP wave forms in the presence of TTX (1 μm). After block of Na+ channels, the spread of Ca2+ signals from the soma was limited to a dendritic segment of about 100 μm length (Fig. 9D), indicating that active propagation of APs in the dendrite is necessary for Ca2+ signalling into the distal part of the dendrites.
DISCUSSION
The results establish that bitufted interneurons that have their soma located in layer 2/3 of somatosensory cortex have unique dendritic and axonal arbors with characteristic morphology and functional properties. Their apical and basal dendrites are electrically excitable and can actively conduct Na+-dependent APs which lead to transient rises in dendritic [Ca2+]i via activation of voltage-gated Ca2+ channels. The geometry of their dendritic arbor is such that they receive inputs from all cortical layers restricted, however, to a single column. Their axonal arbor on the other hand can clearly cross the borders of the ‘home’ column with the axon collaterals projecting horizontally in supragranular layers. The [Ca2+]i transient evoked by a dendritic AP is smaller in amplitude and decayed more slowly than in pyramidal cells. The main reason for this difference is the substantially higher Ca2+ binding ratio of the bitufted neurons (κS≈ 285 versusκS≈ 200). This higher binding ratio accounts for the observation that the pattern of dendritic APs is transduced into a dendritic [Ca2+]i transient at a lower resolution than in pyramidal cells, but over a wider range of AP frequencies. The bitufted neurons thus have a broader linear frequency range (2-40 Hz) for the dendritic ‘calcium code’ (Johnston, 1996).
Electrical excitability and dendritic [Ca2+]i transients
APs that were initiated in the axon and then back-propagated into dendrites were reported previously in cortical and hippocampal pyramidal neurons and interneurons of the substantia nigra (Stuart et al. 1997, for review). Both anatomical and electrophysiological evidence suggest that in bitufted neurons, the site of AP initiation is close to the main axon which, however, frequently originated from one of the primary dendrites. Immunocytochemistry indicated that bitufted interneurons of the somatosensory cortex contain a high concentration of the calcium-binding proteins calbindin-D28k and/or calretinin (Kubota & Kawaguchi, 1997). The high Ca2+ binding ratio of bitufted neurons (κS≈ 285) is thus likely to be due to the co-expression of calbindin-D28k and calretinin.
Comparison to previous work
In substantia nigra principal dopaminergic and GABAergic interneurons somatically evoked APs back-propagate into the dendritic arbor (Häusser et al. 1995) as in the interneurons examined here. Also in hippocampal interneurons dendrites are electrically excitable (Martina et al. 2000). AP-dependent dendritic [Ca2+]i transients were reported in pyramidal neurons of layer 5 and in the hippocampus (Jaffe et al. 1992; Markram et al. 1995; Schiller et al. 1995; Spruston et al. 1995; Helmchen et al. 1996). The Ca2+ binding ratio in apical dendrites of layer 5 cortical pyramidal cells was in the range of 70-120 (Helmchen et al. 1996) and slightly higher Ca2+ binding ratios were found in dendrites of pyramidal cells in CA1 (Helmchen et al. 1996) and in basal dendrites of layer 2/3 pyramidal cells (Köster & Sakmann, 2000). The Ca2+ binding ratios of the cortical principal neurons are lower than the value we determined here for bitufted interneurons (≈285). The only other class of neurons for which a high Ca2+ binding ratio of the endogenous buffer (≈2000) was reported were the Purkinje cells of the cerebellum (Fierro & Llano, 1996). This cell type does not support Na+-dependent dendritic APs (Stuart & Häusser, 1994) and generates Ca2+ action potentials which are initiated locally in the dendrites (Llinas & Sugimori, 1980). Thus the binding ratios of the endogenous buffer in dendrites of different cell classes can vary over a tenfold range.
Functional significance of dendritic excitability
The high Ca2+ binding ratio of bitufted interneurons could have several consequences for their function in the cortical network. Firstly, interneurons can discharge APs at a considerably higher frequency and for a longer duration than pyramidal neurons. The Ca2+ inflow evoked by dendritic APs will not cause an excessively high rise of cytoplasmic [Ca2+]i because of the higher Ca2+ binding ratio. Secondly, the rise in cytoplasmic [Ca2+]i via activation of Ca2+ permeable AMPAR and NMDAR channels located on relatively thin (< 5 μm) dendrites is also limited effectively with respect to the size and lateral spread of the Ca2+ signal. Finally, dendritic APs can modulate both EPSPs and IPSPs via a rise in the dendritic [Ca2+]i, which triggers release of a retrograde messenger (Pitler & Alger, 1992; Zilberter et al. 1999; Zilberter, 2000). The high Ca2+ binding ratio of the bitufted cell dendrites probably limits the rise in dendritic [Ca2+]i and reduces the release of the retrograde messenger. This could prevent the inactivation of synaptic GluR and GABAR channels of the target neuron by long lasting increases in presynaptic [Ca2+]i. AP evoked Ca2+ accumulation in dendrites could control cellular signal cascades depending on the neuron's electrical activity that is transduced into an intracellular Ca2+ signal (Zucker, 1999). It will be interesting to delineate whether the efficacy and reliability as well as the short-term modification of these synapses are changed on the long term by the coincident pre- and postsynaptic activity.
Conclusion
Propagation of APs from the soma into the apical and basal dendritic arbor of cortical neurons is a widespread mechanism enabling signalling between different compartments of neurons. We demonstrate that it also occurs in at least one class of cortical GABAergic interneurons, the bitufted somatostatin positive cells. The main function of back-propagating dendritic APs in bitufted cells is, presumably, to provide a ‘copy’ of the neuron's electrical output to the dendritic arbor that is then transduced into a transient rise in dendritic [Ca2+]i. The size, time course and spatial extent of the dendritic Ca2+ signals, most likely, can adjust the ‘receptive’ properties of the neuron's dendritic arbor depending on its output activity.
Acknowledgments
We thank Dr D. Feldmeyer for providing us with thalamocortical slices. We also want to thank Dr D. Feldmeyer and Dipl. Phys. A. Roth for critically reading the manuscript.
References
- Agmon A, Connors B W. Thalamocortical responses of mouse somatosensory (barrel) cortex in vitro. Neuroscience. 1991;41:365–379. doi: 10.1016/0306-4522(91)90333-j. [DOI] [PubMed] [Google Scholar]
- Alger B E, Pitler T A. Retrograde signaling at GABAA-receptor synapses in the mammalian CNS. Trends in Neurosciences. 1995;18:333–340. doi: 10.1016/0166-2236(95)93923-l. [DOI] [PubMed] [Google Scholar]
- Fierro L, Llano I. High endogenous calcium buffering in Purkinje cells from rat cerebellar slices. Journal of Physiology. 1996;496:617–625. doi: 10.1113/jphysiol.1996.sp021713. [DOI] [PMC free article] [PubMed] [Google Scholar]
- Grynkiewicz G, Poenie M, Tsien R Y. A new generation of Ca2+ indicators with greatly improved fluorescence properties. Journal of Biological Chemistry. 1985;260:3440–3450. [PubMed] [Google Scholar]
- Häusser M, Stuart G, Racca C, Sakmann B. Axonal initiation and active dendritic propagation of action potentials in substantia nigra neurons. Neuron. 1995;15:637–647. doi: 10.1016/0896-6273(95)90152-3. [DOI] [PubMed] [Google Scholar]
- Helmchen F, Imoto K, Sakmann B. Ca2+ buffering and action potential-evoked Ca2+ signaling in dendrites of pyramidal neurons. Biophysical Journal. 1996;70:1069–1081. doi: 10.1016/S0006-3495(96)79653-4. [DOI] [PMC free article] [PubMed] [Google Scholar]
- Jaffe D B, Johnston D, Lasser-Ross N, Lisman J E, Miyakawa H, Ross W N. The spread of Na+ spikes determines the pattern of dendritic Ca2+ entry into hippocampal neurons. Nature. 1992;357:244–246. doi: 10.1038/357244a0. [DOI] [PubMed] [Google Scholar]
- Johnston D. The calcium code. Biophysical Journal. 1996;70:1095. doi: 10.1016/S0006-3495(96)79674-1. [DOI] [PMC free article] [PubMed] [Google Scholar]
- Johnston D, Magee J C, Colbert C M, Christie B R. Active properties of neuronal dendrites. Annual Review of Neuroscience. 1996;19:165–186. doi: 10.1146/annurev.ne.19.030196.001121. [DOI] [PubMed] [Google Scholar]
- Köster H J, Sakmann B. Calcium dynamics in single spines during coincident pre- and postsynaptic activity depend on relative timing of back-propagating action potentials and subthreshold excitatory postsynaptic potentials. Proceedings of the National Academy of Sciences of the USA. 1998;95:9596–9601. doi: 10.1073/pnas.95.16.9596. [DOI] [PMC free article] [PubMed] [Google Scholar]
- Köster H J, Sakmann B. Calcium dynamics associated with action potentials in single nerve terminals of pyramidal cells in layer 2/3 of the young rat neocortex. Journal of Physiology. 2000;529:625–646. doi: 10.1111/j.1469-7793.2000.00625.x. [DOI] [PMC free article] [PubMed] [Google Scholar]
- Kubota Y, Kawaguchi Y. Two distinct subgroups of cholecystokinin-immunoreactive cortical interneurons. Brain Research. 1997;752:175–183. doi: 10.1016/s0006-8993(96)01446-1. [DOI] [PubMed] [Google Scholar]
- Llinas R, Sugimori M. Electrophysiological properties of in vitro Purkinje cell dendrites in mammalian cerebellar slices. Journal of Physiology. 1980;305:197–213. doi: 10.1113/jphysiol.1980.sp013358. [DOI] [PMC free article] [PubMed] [Google Scholar]
- Magee J C, Johnston D. A synaptically controlled, associative signal for Hebbian plasticity in hippocampal neurons. Science. 1997;275:209–213. doi: 10.1126/science.275.5297.209. [DOI] [PubMed] [Google Scholar]
- Markram H, Helm P J, Sakmann B. Dendritic calcium transients evoked by single back-propagating action potentials in rat neocortical pyramidal neurons. Journal of Physiology. 1995;485:1–20. doi: 10.1113/jphysiol.1995.sp020708. [DOI] [PMC free article] [PubMed] [Google Scholar]
- Markram H, Lübke J, Frotscher M, Roth A, Sakmann B. Physiology and anatomy of synaptic connections between thick tufted pyramidal neurones in the developing rat neocortex. Journal of Physiology. 1997;500:409–440. doi: 10.1113/jphysiol.1997.sp022031. [DOI] [PMC free article] [PubMed] [Google Scholar]
- Markram H, Lübke J, Frotscher M, Sakmann B. Regulation of synaptic efficacy by coincidence of postsynaptic APs and EPSPs. Science. 1997;275:213–215. doi: 10.1126/science.275.5297.213. [DOI] [PubMed] [Google Scholar]
- Markram H, Roth A, Helmchen F. Competitive calcium binding: implications for dendritic calcium signaling. Journal of Computational Neuroscience. 1998;5:331–348. doi: 10.1023/a:1008891229546. [DOI] [PubMed] [Google Scholar]
- Martina M, Vida I, Jonas P. Distal initiation and active propagation of action potentials in interneuron dendrites. Science. 2000;287:295–300. doi: 10.1126/science.287.5451.295. [DOI] [PubMed] [Google Scholar]
- Marty A, Llano I. Modulation of inhibitory synapses in the mammalian brain. Current Opinion in Neurobiology. 1995;5:335–341. doi: 10.1016/0959-4388(95)80046-8. [DOI] [PubMed] [Google Scholar]
- Neher E, Augustine G J. Calcium gradients and buffers in bovine chromaffin cells. Journal of Physiology. 1992;450:273–301. doi: 10.1113/jphysiol.1992.sp019127. [DOI] [PMC free article] [PubMed] [Google Scholar]
- Peters A. Bipolar Cells. In: Peters A, Jones E G, editors. Cerebral Cortex vol. 1. New York and London: Plenum Press; 1984. [Google Scholar]
- Peters A, Harriman K M. Enigmatic bipolar cell of rat visual cortex. Journal of Comparative Neurology. 1988;267:409–432. doi: 10.1002/cne.902670310. [DOI] [PubMed] [Google Scholar]
- Pitler T A, Alger B E. Postsynaptic spike firing reduces synaptic GABAA responses in hippocampal pyramidal cells. Journal of Neuroscience. 1992;12:4122–4132. doi: 10.1523/JNEUROSCI.12-10-04122.1992. [DOI] [PMC free article] [PubMed] [Google Scholar]
- Reyes A, Lujan R, Rozov A, Burnashev N, Somogyi P, Sakmann B. Target-cell-specific facilitation and depression in neocortical circuits. Nature Neuroscience. 1998;1:279–285. doi: 10.1038/1092. [DOI] [PubMed] [Google Scholar]
- Schiller J, Helmchen F, Sakmann B. Spatial profile of dendritic calcium transients evoked by action potentials in rat neocortical pyramidal neurones. Journal of Physiology. 1995;487:583–600. doi: 10.1113/jphysiol.1995.sp020902. [DOI] [PMC free article] [PubMed] [Google Scholar]
- Spruston N, Schiller Y, Stuart G, Sakmann B. Activity-dependent action potential invasion and calcium influx into hippocampal CA1 dendrites. Science. 1995;268:297–300. doi: 10.1126/science.7716524. [DOI] [PubMed] [Google Scholar]
- Stuart G, Häusser M. Initiation and spread of sodium action potentials in cerebellar Purkinje cells. Neuron. 1994;13:703–712. doi: 10.1016/0896-6273(94)90037-x. [DOI] [PubMed] [Google Scholar]
- Stuart G J, Sakmann B. Active propagation of somatic action potentials into neocortical pyramidal cell dendrites. Nature. 1994;367:69–72. doi: 10.1038/367069a0. [DOI] [PubMed] [Google Scholar]
- Stuart G, Spruston N, Sakmann B, Häusser M. Action potential initiation and backpropagation in neurons of the mammalian CNS. Trends in Neurosciences. 1997;20:125–131. doi: 10.1016/s0166-2236(96)10075-8. [DOI] [PubMed] [Google Scholar]
- Tamas G, Somogyi P, Buhl E H. Differentially interconnected networks of GABAergic interneurons in the visual cortex of the cat. Journal of Neuroscience. 1998;18:4255–4270. doi: 10.1523/JNEUROSCI.18-11-04255.1998. [DOI] [PMC free article] [PubMed] [Google Scholar]
- Yuste R, Denk W. Dendritic spines as basic functional units of neuronal integration. Nature. 1995;375:682–684. doi: 10.1038/375682a0. [DOI] [PubMed] [Google Scholar]
- Zilberter Y. Dendritic release of glutamate suppresses synaptic inhibition of pyramidal neurons in rat neocortex. Journal of Physiology. 2000;528:489–496. doi: 10.1111/j.1469-7793.2000.00489.x. [DOI] [PMC free article] [PubMed] [Google Scholar]
- Zilberter Y, Kaiser K M M, Sakmann B. Dendritic GABA release depresses excitatory transmission between layer 2/3 pyramidal and bitufted neurons in rat neocortex. Neuron. 1999;24:979–988. doi: 10.1016/s0896-6273(00)81044-2. [DOI] [PubMed] [Google Scholar]
- Zucker R S. Calcium- and activity-dependent synaptic plasticity. Current Opinion in Neurobiology. 1999;9:305–313. doi: 10.1016/s0959-4388(99)80045-2. [DOI] [PubMed] [Google Scholar]