

Abstract
Differences in the effect of age on structure-function relationships of limb muscles of mdx (dystrophin null) and control mice have not been resolved. We tested the hypotheses that, compared with limb muscles from age-matched control mice, limb muscles of 6- to 17-month-old mdx mice are larger but weaker, with lower normalised force and power, whereas those from 24- to 28-month-old mdx mice are smaller and weaker.
The maximum isometric tetanic force (Po) and power output of limb muscles from 6-, 17-, 24- and 28-month-old mdx and control mice were measured in vitro at 25 °C and normalised with respect to cross-sectional area and muscle mass, respectively.
Body mass at 6 and 28 months was not signifcantly different in mdx and control mice, but that of control mice increased 16 % by 17 months and then declined 32 % by 28 months. The body masses of mdx mice declined linearly with age with a decrease of 25 % by 28 months. From 6 to 28 months of age, the range in the decline in the masses of EDL and soleus muscles of mdx and control mice was from 16 to 28 %. The muscle masses of mdx mice ranged from 9 % to 42 % greater than those of control mice at each of the four ages and, even at 28 months, the masses of EDL and soleus muscles of mdx mice were 17 % and 22 % greater than control values.
For mdx mice of all ages, muscle hypertrophy was highly effective in the maintenance of control values for absolute force for both EDL and soleus muscles and for absolute power of soleus muscles. Throughout their lifespan, muscles of mdx mice displayed significant weakness with values for specific Po and normalised power ≈20 % lower than values for control mice at each age. For muscles of both strains, normalised force and power decreased ≈28 % with age, and consequently weakness was more severe in muscles of old mdx than in those of old control mice.
Duchenne muscular dystrophy (DMD) is an X-linked recessive disorder resulting from mutations in the gene that encodes dystrophin (Koenig et al. 1987). Dystrophin and the dystrophin-associated proteins (DAP) form a complex that links the actin-based subsarcolemmal cytoskeleton to the extracellular matrix component laminin (merosin) (Campbell, 1995). The function of the dystrophin-DAP complex has not been determined definitively, but the complex appears to play a role in the stabilisation of the sarcolemma both in quiescent muscles and particularly during contractions (Campbell, 1995; Lynch et al. 2000b). DMD is characterised by progressive skeletal muscle degeneration (Moser, 1984). The mdx mouse has a point mutation in the dystrophin gene and a lack of dystrophin expression in muscle tissues (Bulfield et al. 1984). Consequently, the mdx mouse has been used in a wide range of investigations probing the underlying mechanisms of DMD (Dangain & Vrbova, 1984; Carnwath & Shotton, 1987; Stedman et al. 1991; Cox et al. 1993; Im et al. 1996).
Of the skeletal muscles studied in the mdx mouse (Anderson et al. 1988; Coulton et al. 1988a, b; Dupont-Versteegden & McCarter, 1992; Pastoret & Sebille, 1993, 1995), only the diaphragm muscle exhibits extensive and progressive degeneration, fibrosis and severe functional deficits comparable to the clinical symptoms observed in limb muscles of boys with DMD (Stedman et al. 1991; Dupont-Versteegden & McCarter, 1992; Petrof et al. 1993; Lynch et al. 1997; Coirault et al. 1999). Despite numerous studies of the structure-function relationships of the limb muscles of mdx mice, considerable controversy still exists as to the muscle mass and force development compared with data on age-matched control C57BL/10 mice (Faulkner et al. 1997; Gillis, 1999). Issues not addressed adequately are the highly variable muscle masses, the low values for maximum absolute and specific force (Po), and on occasion the inappropriate methods used to normalise force to a specific Po value (Anderson et al. 1988; Coulton et al. 1988a; Quinlan et al. 1992; Pastoret & Sebille, 1993, 1995; Hayes & Williams, 1998). In addition, limited data are available on power output of limb muscles of mdx mice (Deconinck et al. 1998; Lynch et al. 2000a), arguably the most important physiological measure of skeletal muscle function. Few studies have compared mdx and control mice beyond 18 months old (Pastoret & Sebille, 1993, 1995; Lefaucheur et al. 1995; Hayes & Williams, 1998) and hence the major issue of the interaction of ageing and the ongoing dystrophic process remains unresolved.
Partridge (1993) noted that the mdx mouse has been challenged as a model for structure-function studies of the dystrophic changes in limb muscles because of the tendency for the mdx mouse ‘to become sturdy and strong rather than wasted and weak’. In reality, where on the continuums between ‘sturdy’ and ‘wasted’ and ‘strong’ and ‘weak’ the muscles of mdx mice lie is not clear. The lack of clarity arises both from the variability in the published data on the structural and functional properties of muscles in mdx mice (Faulkner et al. 1997), and from the qualitative nature of the terms ‘weak’ and ‘strong’ and ‘wasted’ and ‘sturdy’ (Brooks & Faulkner, 1988; Phillips et al. 1991; Partridge, 1993; Pastoret & Sebille, 1995). The study was designed to measure the structural and functional properties of limb muscles of mdx mice at ages before and after deficits in specific force and normalised power occur for limb muscles of control mice (Brooks & Faulkner, 1988; Phillips et al. 1991). Our rationale was that with the progressive nature of the dystrophic process, major deficits in structure and function occur earlier in the lifespan of mdx than control mice. The hypothesis was that, compared with extensor digitorum longus (EDL) and soleus muscles from age-matched control mice, EDL and soleus muscles from 6- and 17-month-old mdx mice are larger but weaker, whereas those from 24- and 28-month-old mdx mice are smaller and weaker. A corollary to our primary hypothesis is that throughout their lifespan, EDL and soleus muscles of mdx mice demonstrate greater relative decreases in muscle mass and absolute and normalised force and power than control mice.
METHODS
Animal groups
Four age groups of male mdx and control C57BL mice were studied: ≈6, ≈17, ≈24 and ≈28 months old. The specific pathogen-free mice were obtained from Jackson Laboratories (Bar Harbor, ME, USA) and then housed in barrier-protected facilities of the Unit for Laboratory Animal Medicine at the University of Michigan. All experiments were conducted in accordance with the guidelines outlined in the Guide for the Care and Use of Laboratory Animals (USPHS, DHHS Publication Number 85-23 (NIH), Revised 1985, Bethesda, MD, USA).
Contractile properties
For the measurement of contractile properties, the mice were anaesthetised with sodium pentobarbitone (70 mg kg−1i.p.) with supplemental doses administered as necessary to maintain adequate anaesthesia such that the animals did not respond to tactile stimuli. EDL and soleus muscles were isolated and removed from the anaesthetised mdx and control mice. Mice were then given a lethal overdose of anaesthetic. The sample sizes for EDL and soleus muscles from mdx and control mice of each of the four age groups are indicated in Table 1. Contractile properties were measured on EDL and soleus muscles in vitro using techniques described previously (Lynch et al. 2000a). Silk suture was tied to each tendon of the isolated muscle. The muscles were placed in an experimental chamber filled with mammalian Ringer solution containing (mm): NaCl 137; NaHCO3 24; glucose 11; KCl 5; CaCl2 2; MgSO4 1; NaH2PO4 1; and tubocurarine chloride 0.025; adjusted to pH 7.4. The chamber was perfused continuously with 95 % O2-5 % CO2 and maintained at a temperature of 25 °C. One end of the muscle was attached to the lever arm of a position feedback servomotor (model 300H, Aurora Scientific Inc., Richmond Hill, Ontario, Canada). The other end of the muscle was tied to a steel hook of a force transducer (model BG-50, Kulite Semiconductor Products Inc., Leonia, NJ, USA). The muscles were stimulated by an electric field generated between two platinum electrodes placed longitudinally on either side of the muscle. Square wave pulses 0.2 ms in duration were generated by a stimulator (model S88, Grass Instruments, Quincy, MA, USA) and amplified (model DC-300A Series II, Crown International Inc., Elkhart, IN, USA) to provide a current intensity sufficient to produce a maximum isometric tetanic contraction (Po). Muscles were adjusted to the optimum length (Lo) for the development of isometric twitch force. Optimum fibre length (Lf) was determined by multiplying the value for Lo for each muscle by a previously determined fibre length to muscle length ratio of 0.44 for the EDL and 0.71 for the soleus muscle (Brooks & Faulkner, 1988). A frequency-force curve was established at frequencies of 10, 30, 50, 80, 100, 120, 150 and 180 Hz for EDL muscles and 10, 20, 30, 50, 80, 100, 120 and 150 Hz for soleus muscles. The absolute Po was determined from the plateau of the frequency-force relationship.
Table 1.
Sample sizes for numbers of mice, extensor digitorum longus (EDL) and soleus muscles in each of the four age groups for C57BL control mice and mdx mice
| 6 months | 17months | 24 months | 28 months | |||||||||
|---|---|---|---|---|---|---|---|---|---|---|---|---|
| Mice | EDL | Soleus | Mice | EDL | Soleus | Mice | EDL | Soleus | Mice | EDL | Soleus | |
| C57 mice | 15 | 15 | 11 | 11 | 12 | 6 | 7 | 7 | 7 | 19 | 19 | 15 |
| mdx mice | 16 | 16 | 11 | 11 | 16 | 4 | 12 | 16 | 10 | 5 | 10 | 10 |
Power output was determined during isovelocity shortening ramps from 105 to 95 %Lf with the muscle maximally activated. Shortening of the muscle an equal distance either side of Lf was designed to enhance force development (Lynch et al. 2000a). Initiation of the isovelocity shortening ramp and stimulation of the muscle occurred simultaneously. Stimulation was terminated at the end of the shortening ramp and the muscle was held isometric allowing it to relax before returning the muscle to resting length. The optimum velocity of shortening (Vopt) was defined as the velocity that resulted in the maximum development of power (Brooks & Faulkner, 1991). An initial velocity was set, based on previous data for Vopt for these muscles and then adjusted upwards and downwards until maximum power output was achieved. Maximum power was calculated as the product of the average force developed during the shortening ramp and the velocity of shortening. When a maximum power measurement had been determined, additional isovelocity shortenings were made from 100 to 90 %Lf. Frequently, a higher value for maximum power output was achieved employing this protocol, particularly for muscles from mdx mice. Maximum power output was determined from whichever of the two protocols gave the highest value.
Histological properties
Following the measurement of the contractile properties, the muscles were removed from the bath and trimmed of their tendons and any visible connective tissue. The muscles were blotted, weighed on an analytical balance and then frozen in isopentane cooled in dry ice and stored at -80 °C for histological analysis. The muscle to body mass ratio was obtained by dividing muscle mass by body mass. For the histological analysis, comparisons were made of cross-sections of muscles from 6- and 24-month-old mice. The 24- rather than the 28-month-old comparison was chosen because for control mice, age-related deficits in muscle mass and muscle force have not occurred at this age (Brooks & Faulkner, 1988). Furthermore, the histological sections at 24 months permitted comparisons with the data of Pastoret & Sebille (1995). For each EDL and soleus muscle of 6- and 24-month-old mdx and control mice, six to eight full cross-sections were fixed in Bouin's solution, embedded in paraffin, sectioned at 7 μm, and stained with Ehrlich's haematoxylin and eosin (H&E). A few hundred fibres were selected from random sections and planimetered to ensure that our data were comparable to previously published data on fibre areas (Anderson et al. 1988) or fibre widths (Tanabe et al. 1986; Coulton et al. 1988b) of EDL and/or soleus muscles of mdx and control mice. The total fibre cross-sectional areas (CSA) of the EDL and soleus muscles were determined by dividing muscle mass by the product of Lf and 1.06 mg mm−3, the density of mammalian skeletal muscle. For muscles of mdx and control mice, the total fibre CSA was divided by the mean CSA of single fibres to obtain an estimate of the number of fibres per muscle. The values for maximum force were divided by the total fibre CSA of the whole muscle to obtain the specific force (expressed in kN m−2). The power (W) was normalised with respect to muscle mass (expressed in W kg−1). The terms ‘weak’ or ‘weakness’ are restricted to references regarding a deficit in the development of specific force per unit of total fibre cross-sectional area, as used previously to describe the specific force of 28-month-old C57BL/6 mice (Brooks & Faulkner, 1988; Phillips et al. 1991).
Statistics
Data are presented in the text as means ±s.e.m. Differences between the experimental groups were determined by two-way analysis of variance (ANOVA). The two factors were the strain (mdx or control) and the age of the mice. When significance was detected, Tukey's post hoc comparison was used to assess the difference. Results were considered significant if P < 0.05 and significant differences between groups are indicated in the figures (see legends for details).
RESULTS
Histological sections
Cross-sections of the EDL and soleus muscles of 6- and 24-month-old C57BL control mice stained with H&E showed normal structure, with peripherally located myonuclei and only a slight increase in interstitial nuclear density between the two age groups (Fig. 1). In contrast, in the cross-sections of EDL and soleus muscles of 6- and 24-month-old mdx mice, ≈60 % of the fibres had centrally located nuclei. The presence of mononuclear cells in the epimysial space of the muscles of the mdx mice is consistent with that of an inflammatory response due to ongoing cycles of damage and regeneration (Anderson et al. 1988, 1998; Coulton et al. 1988; Lefaucheur et al. 1995; Pastoret & Sebille, 1995). By 24 months of age, the number of mononuclear cells in the cross-sections of EDL and soleus muscles of mdx mice had increased substantially, consistent with the progressive nature of the dystrophic condition (Anderson et al. 1998). Compared with sections from EDL and soleus muscles of 6-month-old mdx mice, sections from both muscles of 24-month-old mdx mice showed an increase in the number of mononuclear cells, amount of connective tissue and fibre degeneration. There were few mononuclear cells in the limb muscles of control mice at any of the ages studied.
Figure 1. Cross-sections of EDL (A-D) and soleus (E-H) muscles from 6- (A, B, E and F) and 24- (C, D, G and H) month-old mdx and control mice stained with haematoxylin and eosin (H&E).
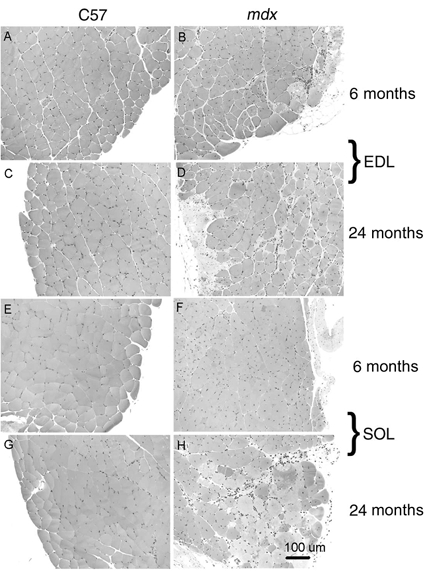
Note in cross-sections of muscles from mdx mice: (i) the variability in cross-sectional area of fibres, (ii) the large number of small atrophic fibres, (iii) the large number of central myonuclei, 50-70 %, in muscles of mdx mice.
For control and mdx mice, respectively, the mean single fibre CSAs for EDL muscles were 1290 ± 56 and 1087 ± 73 μm2 and for soleus muscles, 1224 ± 60 and 930 ± 74 μm2. Despite the relatively small sample of ≈400 fibres, our values are within the range for EDL and soleus muscles of mdx and control mice of similar ages reported by other investigators (Tanabe et al. 1986; Anderson et al. 1988; Coulton et al. 1988b), although Anderson et al. (1988) reported higher values, ≈2000 μm2, for soleus muscles of mdx and control mice. Each of these groups reported the presence of extremely large fibres and the small atrophic fibres in muscles of mdx mice as observed in Fig. 1B, D, F and H. For control mice, the estimate of the number of fibres was ≈1500 for EDL muscles and ≈1100 for soleus muscles. These values are in good agreement with the values of 1600 ± 715 and 940 ± 197, respectively, obtained by Burkholder et al. (1994) by the same method of dividing total fibre CSA by single fibre CSA. The numbers of fibres in EDL and soleus muscles of mdx mice were estimated to be ≈2000 and ≈1500, respectively, both of which are ≈35 % greater than values for control mice. This observation is consistent with reports of branching of fibres in the muscles of mdx mice (Head et al. 1992). We conclude that where comparisons were possible, the morphological characteristics of the EDL and soleus muscles of our mdx and control mice are in good agreement with previous observations of these muscles.
Body masses and muscle masses of EDL and soleus muscles
For control mice, the body masses increased 16 % from 6 to 17 months of age and then decreased 10 % between 17 and 24 months and 32 % by 28 months (Fig. 2). In contrast to the curvilinear relationship between body mass and age for the control mice, the body masses of the mdx mice declined linearly throughout the lifespan, with the value 25 % lower for 28-month-old mice compared with 6-month-old mice. Age had a differential effect on the body masses of mdx and control mice. The result was at 17 and 24 months of age, the body masses of mdx mice were 30 % lower than those of control mice, whereas for 6- and 28-month-old mice the body masses of mdx and control mice were not different.
Figure 2. Body mass of mdx and control C57BL male mice plotted at 6, 17, 24 and 28 months old.
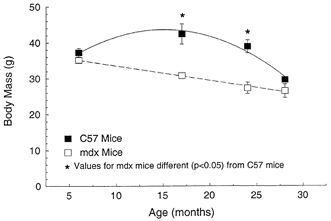
The effect of age (P < 0.001) and the strain of mouse (P < 0.001) were both significant. The effect of age was different for mdx compared with control mice with significant (P < 0.001) interactions. Here and in subsequent figures symbols and error bars indicate means ± 1 s.e.m; where no error bars are apparent they are masked by the symbol. Asterisks indicate significant differences between data for mdx and control C57 mice (P < 0.05).
The EDL muscle masses of 28- compared with 6-month-old mice were 28 % smaller for mdx mice and 22 % smaller for control mice (Fig. 3A). For soleus muscles, the differences between 28- and 6-month-old mice were 27 % smaller for the mdx mice and 16 % for the control mice (Fig. 3B). Despite the smaller body masses of the mdx mice, particularly at 17 and 24 months, the masses of the EDL and soleus muscles of the mdx mice were invariably greater than the comparable muscles in each of the four age-matched control groups. The greatest relative hypertrophy for muscles of mdx compared with control mice was observed at 6 months of age, when EDL muscles of mdx mice were 28 % larger than those of control mice and soleus muscles were 42 % larger. Despite the changes with age in both body and muscle masses, the muscle mass/body mass remained remarkably stable. From 6 to 28 months of age, EDL muscles of mdx and control mice maintained values of 0.46 ± 0.01 and 0.32 ± 0.01, respectively, and soleus muscles values of 0.41 ± 0.01 and 0.29 ± 0.01, respectively. For each muscle, the muscle mass/body mass of the mdx mice was ≈40 % greater than that of the control mice and the EDL muscles of mdx and control mice had a ≈15 % greater ratio than the soleus muscles.
Figure 3. Mass of EDL (A) and soleus (B) muscles of mdx and control male mice plotted against age.
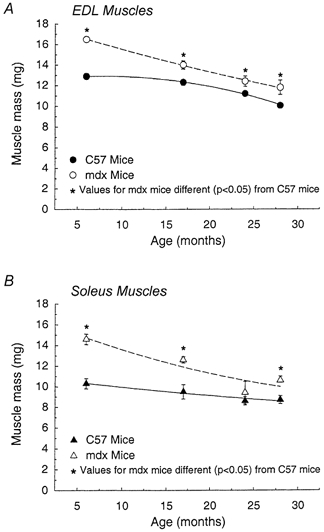
For both EDL and soleus muscles, the effect of age (P < 0.001) and the strain of mouse (P < 0.001) were significant. For both muscles the effect of age was different for mdx compared with control mice; significant interactions were observed for the EDL muscles (P < 0.013) and for the soleus muscles (P < 0.034). Asterisks indicate significant differences between data for mdx and control C57 mice (P < 0.05).
Contractile properties of the EDL muscle
For EDL muscles from mdx and control mice, the values for absolute Po are presented in Fig. 4. From 6 to 28 months of age, the absolute Po of the EDL muscles of control mice declined 35 % and those of the mdx mice 37 %. Although the EDL muscles of the mdx mice had greater masses than the age-matched control groups at each of the four ages, the absolute Po of the EDL muscles of the mdx and control mice did not differ. The specific Po of EDL muscles of mdx and control mice showed no effect of age through to 24 months of age, but between 24 and 28 months, the specific Po of mdx mice declined 25 % and that of the control mice 26 % (Fig. 5A). For each of the three youngest age groups, the specific Po of the EDL muscles of the mdx mice were 13, 16 and 10 % lower than values for muscles of control mice, whereas the values for 28 month old mice were not different (Fig. 5A).
Figure 4. Maximum isometric tetanic force (Po) of EDL and soleus muscles of mdx and control mice plotted against age.
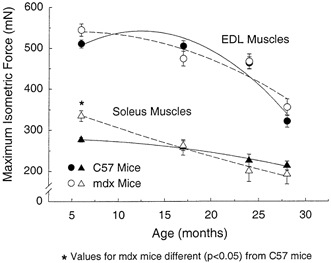
The effect of age was significant (P < 0.001) for each muscle, but the strain of mouse had no significant effect for EDL (P < 0.41) or for soleus (P < 0.86) muscles. No significant interactions were observed for the EDL muscles (P < 0.15), but the effect of age was significantly greater (P < 0.031) for soleus muscles of mdx mice with a significant difference by 24 months old, whereas absolute Po of soleus muscles of control mice showed no significant decrease with age. Asterisks indicate significant differences between data for mdx and control C57 mice (P < 0.05).
Figure 5. Maximum isometric specific force (Po) of EDL muscles (A) and soleus muscles (B) plotted against age.
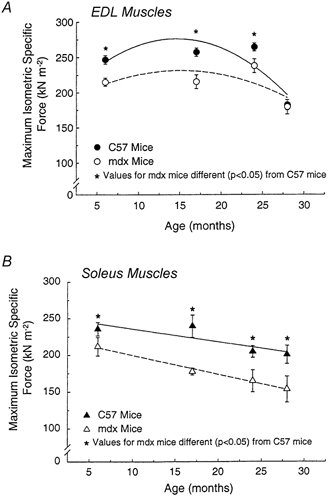
For EDL muscles, the specific Po of both mdx and control mice decline with age (P < 0.05). Effect of age was not significacntly different for the two strains (P < 0.13 for interactions). For soleus muscles, the specific Po of both mdx and control mice declined with age (P < 0.05). Effect of age was not signifcantly different for the two strains (P < 0.64 for interactions). Asterisks indicate significant differences between data for mdx and control C57 mice (P < 0.05).
For the EDL muscles of control mice, the loss in absolute power was 31 % between 17 and 24 months of age and 21 % between 17 and 28 months of age (Fig. 6). The absolute power of the EDL muscles of the mdx mice declined continuously throughout the lifespan and by 28 months of age the loss in absolute power was 43 %. For 6- and 24-month-old mice, the absolute power of EDL muscles of mdx and control mice did not differ, but for 17- and 28-month-old mdx mice, the power was 18 and 36 % lower than the age-matched control value (Fig. 6). For EDL muscles of both mdx and control mice, normalised power decreased dramatically after 17 months of age. The normalised power of EDL muscles of control mice was 24 % lower at 24 than at 17 months and that of mdx mice, 32 % lower at 28 than at 17 months. The normalised power of EDL muscles of mdx mice ranged from 22 to 41 % lower than that of control mice. The greatest difference was between 28-month-old mdx and control mice (Fig. 6). Compared with control mice, at each age EDL muscles of mdx mice had a greater deficit in normalised power than in normalised force. Despite this discrepancy in normalised power, at each age the Vopt was not different. Consequently, although the greater impairment in normalised power than force could be explained by the presence of slower myosin isoforms, as proposed by Coulton et al. (1988a), the interaction between force and velocity is complex, particularly in muscles of mdx mice.
Figure 6. Absolute power output of EDL and soleus muscles of mdx and control mice plotted against age.
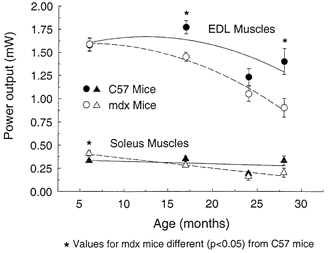
The effect of age was significant (P < 0.001) for both muscles and the effect of the strain of mouse was significant for EDL muscles (P < 0.001), but not for soleus muscles (P < 0.19). Significant interactions between age and strain were observed for the EDL (P < 0.028) and soleus (P < 0.02) muscles. Asterisks indicate significant differences between data for mdx and control C57 mice (P < 0.05).
Contractile properties of the soleus muscle
For the soleus muscles of both the mdx and control mice, the absolute Po and specific Po declined linearly with age. From 6 to 28 months of age, the decline in the absolute Po was 43 % for the mdx mice and 23 % for control mice and the decline in the specific Po was 27 % for mdx mice and 15 % for control mice (Fig. 4 and Fig. 5B). As with the EDL muscle, the greater muscle mass of the soleus muscle of mdx mice did not translate into a greater absolute Po for the soleus muscle (Fig. 4). The one exception was the 21 % higher value for the absolute Po of soleus muscles of 6-month-old mdx compared with control mice. At none of the other three ages did the absolute Po of soleus muscles of mdx and control mice differ. At each of the four ages, the specific Po of the soleus muscles of the mdx mice was 10, 26, 19 and 24 % lower than control mice.
For the absolute power of soleus muscles, both strains of mouse demonstrated an age effect, but no effect of the strain of mouse was observed (Fig. 6). From 6 to 24 months of age, the absolute power of the soleus muscles of mdx mice decreased 61 % and that of the control soleus muscles decreased 46 % between 17 and 24 months. For normalised power, effects attributable to both strain and age were significant (Fig. 7). For control mice, the normalised power of the soleus muscles at 24 months was 36 % lower than the normalised power at 17 months (Fig. 6). As mdx mice aged from 6 to 24 months, the normalised power of the soleus muscles decreased 52 %. At 6 months of age, the normalised power of the soleus muscles of mdx and control mice did not differ. In contrast, at 17, 24 and 28 months of age the normalised power of mdx mice were 39, 36 and 53 % lower than age-matched values for the control mice.
Figure 7. Normalised power output of EDL and soleus muscles of mdx and control mice plotted against age.
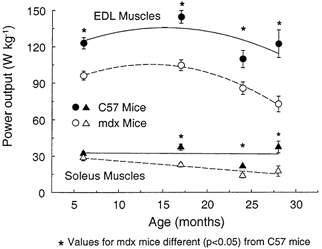
The effect of age (P < 0.001) and the strain of mouse (P < 0.001) were each significant for both muscles. The interaction between age and strain was not significant for EDL muscles (P < 0.15) with the normalised power of EDL muscles of both strains decreasing after 17 months of age. For soleus muscles a significant (P < 0.037) interaction between age and strain was observed. Asterisks indicate significant differences between data for mdx and control C57 mice (P < 0.05).
DISCUSSION
Despite the widespread use of the mdx mouse as an animal model of DMD (Partridge, 1993), most investigations have focused on single data points on young mdx mice (for review see Gillis, 1999). Even studies of multiple age groups have been limited to the first 18 months, or the early adult portion, of the lifespan (Anderson et al. 1988; Coulton et al. 1988a, b; Dupont-Versteegden & McCarter, 1992; Wineinger et al. 1998). Pastoret & Sebille (1995) initiated the first serious attempt to investigate the time course of degeneration-regeneration of leg muscles with histological and immunostaining techniques and measures of body and muscle mass throughout the 24 month lifespan of the mdx mice. They reported that only 8 % of their mdx cohort and 70 % of their control cohort mice survived to 24 months. In a second study from the same group, no mdx mice survived beyond 23 months of age compared with a 45 % survival rate for control mice (Lefaucheur et al. 1995). For our mdx and control C57BL mice 40 and 80 %, respectively, of the cohort survived to 24 months and 15 and 50 %, respectively, survived to 28 months. The major discrepancies in lifespan between the two data sets are probably attributable to the conventional housing conditions of the mice of Pastoret & Sebille (1995) and Lefaucheur et al. (1995), whereas our mice were specific pathogen free. A lifetime of exposure to a variety of unknown pathogens in conventional animal housing facilities appears to shorten the lifespan particularly of mdx mice (Florini, 1987).
The body masses of young mice, both mdx and control, were not affected by the conventional housing conditions. The body masses of mdx and control mice stabilised between 4 and 6 months of age, an age at which Coulton et al. (1988b) noted 17 % greater body mass for mdx than control mice. In the present study, the body masses of mdx and control mice are in reasonable agreement with other published data at 6 months of age. Neither we nor Pastoret & Sebille (1995) found any difference between the two strains at this young age. For mice older than 6 months, the conventional compared with the barrier-facility housing had a dramatic effect on body mass with the mdx mice more affected than the control mice. By 24 months of age, body mass of control mice decreased from 39 to 31 g, a 21 % loss, and for mdx mice from 34 to 13 g, a 65 % loss (Pastoret & Sebille, 1995). At 24 months, the body mass of our mdx mice, 27.3 g, was twofold greater than that of the mdx mice of Pastoret & Sebille (1995). Even though specific pathogen free, both mdx and control mice in our study experienced an ≈30 % loss in body mass by 28 months. The decline in body mass with age was linear for mdx mice and curvilinear for control mice.
Throughout the lifespan of the mdx mouse the dystrophic process in skeletal muscles involves a continual cycle of skeletal muscle fibre degeneration and regeneration (Zacharias & Anderson, 1991; Beilharz et al. 1992; Grounds & McGeachie, 1992; Lefaucheur et al. 1995; Pastoret & Sebille; 1995). Pastoret & Sebille (1995) concluded that for muscles of mdx mice up to 12 months, fibre necrosis was compensated for by a ‘vigorous’ regeneration, whereas for muscles of old mdx mice the necrotic process persisted, but regeneration declined. The degenerative changes in muscles of 24-month-old mdx mice were likened to those observed in patients with DMD (Lefaucheur et al. 1995; Pastoret & Sebille, 1995). Considerable support for fibre necrosis exists, even in muscles of young mdx mice (Carnwath & Shotton, 1987; Anderson et al. 1988; Coulton et al. 1988b; Zacharias & Anderson, 1991; Lefaucheur et al. 1995; Pastoret & Sebille, 1995). In the present study, ‘extensive myopathic lesions’ as described by Coulton et al. (1988b) or even a resemblance to pathological changes associated with DMD (Lefacheur et al. 1995; Pastoret & Sebille, 1995) were not observed, but histological sections of muscles from 24-month-old mdx mice showed clear disruptions of fibre morphology. The most compelling observations of the ongoing degeneration-regeneration cycle in limb muscles of mdx mice are the high percentage of central nuclei in fibres, the variability in the shapes and cross-sectional areas of fibres, and the large number of small atrophic fibres (Bulfield et al. 1984; Carnwath & Shotton, 1987; Coulton et al. 1988b; Zacharias & Anderson, 1991; Pastoret & Sebille, 1995). These phenomena were also evident in our histological sections of EDL and soleus muscles from 6-, but particularly 24-, month-old mdx mice. As observed previously and in the present study, the processes of degeneration and regeneration produce no difference in the mean single fibre CSAs of muscles of mdx and control mice, but a greater distribution of fibre diameters (Tanabe et al. 1986; Coulton et al. 1988b), or fibre CSAs (Anderson et al. 1988).
For muscles of young mdx compared with age-matched control mice, a number of investigators have reported a hypertrophy of 20-30 % for EDL and soleus muscles (Coulton et al. 1988b; Dupont-Versteegden & McCarter, 1992; Pastoret & Sebille, 1993, 1995) and 20 % (Quinlan et al. 1992) to as much a 58 % (Pastoret & Sebille, 1995) for tibialis anterior (TBA) muscles. In agreement with these data, EDL and soleus muscle masses of our 6-month-old mdx mice demonstrated a hypertrophy of 28 and 42 %, respectively. The limb muscles of the mdx mice appear to hypertrophy through the hypertrophy of viable fibres contracting synergistically with muscle fibres damaged by the dystrophic process. Compensatory hypertrophy is most commonly observed in response to chronic impairment or removal of synergistic muscles (Roy et al. 1982) and has not been described previously in response to sustained damage to fibres within the same muscle. The unusual nature of the dystrophic damage is that it extends over the whole lifespan of the mdx mouse (Pastoret & Sebille, 1995 and the present study) and consequently provides a consistent stimulus for the sustained hypertrophy. In contrast, most types of damage to muscle fibres in control animals are repaired quickly and consequently the stimulus is transient (Brooks & Faulkner, 1990). Pastoret & Sebille (1995) observed a complete reversal of the hypertrophy of the TBA muscle mass of mdx mice by 24 months old, with the mass reduced to 50 % of the control value. In contrast, in the present study, the EDL and soleus muscles of the 28-month-old mdx mice sustained a hypertrophy of 17 and 22 % greater, respectively, than the muscle masses of control mice. The maintenance of a ≈20 % hypertrophy throughout the lifespan of the mdx mouse is impressive, particularly in the face of a continuing cycle of degeneration and regeneration (Coulton et al. 1988b; Grounds & McGeachie, 1992; Beilharz et al. 1992; Pastoret & Sebille, 1995).
The muscle hypertrophy was not restricted to only a few small limb muscles, since eight muscles from the lower limbs and trunk of dystrophic mice demonstrated a similar range of generalised hypertrophy (data not shown). The maintenance of a generalised muscle hypertrophy in the face of an ongoing cycle of degeneration and regeneration (Grounds & McGeachie, 1992; Beilharz et al. 1992, Pastoret & Sebille, 1995) is at considerable metabolic cost to mdx mice (MacLennan & Edwards, 1990; Even et al. 1994). The muscle hypertrophy constitutes a possible detriment to the structure-function relationships of other tissues, since a generalised muscle hypertrophy coupled with a 30 % smaller body mass necessitates atrophy of other tissues.
The concept that the mdx mouse has a ‘tendency to become sturdy and strong’ (Partridge, 1993) was not supported by our data on the structure-function relationships of EDL and soleus muscles of 6-, 17-, 24- and 28-month-old mdx mice compared with age-matched control mice. Our hypothesis that limb muscles of mdx mice are larger but weaker, evidenced by a lesser specific Po and lesser normalised power output than control muscles, was supported, not only for both EDL and soleus muscles of young mice, but for each of the four age groups. The one exception, the EDL muscles of old mdx mice, that were larger, but with no difference in Po or specific Po, was something of an anomaly. Despite the success of the hypertrophy in the maintenance of absolute Po and power output of the dystrophic muscles, a significant weakness was evident in both limb muscles. Throughout the lifespan, the values for specific Po of the muscles of the mdx mice averaged 25 % less than the age-matched control values and normalised power output averaged 33 % less.
The low values for normalised force and power arise from the increased amount of non-contractile tissue or tissue with a decreased capability for force development present in the dystrophic muscles. The non-contractile tissue includes connective and fibrotic tissue (Carnwath & Shotton, 1987; Anderson et al. 1988; Coulton et al. 1988a, b; Lefaucheur et al. 1995; Pastoret & Sebille, 1995), whereas damaged fibres or regenerating fibres (Zacharias & Anderson, 1991; Beilharz et al. 1992; Grounds & McGeachie, 1992; Lefaucheur et al. 1995; Pastoret & Sebille; 1995) develop less force per unit of cross-sectional area or less power per unit mass as evidenced by force deficits after contraction-induced injury to control muscles (Brooks & Faulkner, 1990). The lack of dystrophin and concurrent downregulation of the proteins in the dystrophin associated glycoprotein complex results in damage to even passive fibres (Straub et al. 1997) and even more severe damage when fibres contract (Deconinck et al. 1998; Brooks, 1998; Gillis, 1999). The hypertrophy of viable fibres synergistic to the damaged fibres in muscles in mdx mice, resulted in a hypertrophy that ranged from ≈10 to ≈40 % throughout the lifespan of the mdx mice. The hypertrophy constituted a highly successful adaptation to the continuous damage to muscle fibres. The success of the muscle hypertrophy was evidenced at each of the four ages by the lack of any difference between mdx and control mice in the absolute Po of EDL and soleus muscles and in the absolute power output of soleus muscles.
Considerable evidence supports an aggravation of the dystrophic process in the older mice (Pastoret & Sebille, 1995; present study). Pastoret & Sebille (1995) also reported greater damage to soleus muscles than EDL muscles of mdx mice, attributing the greater damage to the continual activity of the soleus muscle in posture and locomotion. In the present study, the histological sections of muscles from 24-month-old mdx mice, particularly soleus muscles, show greater evidence of degeneration and regeneration of fibres than observed at 6 months of age, although the greater damage observed histologically was not accompanied by a dramatic loss of force or power. We find some morphological, but no functional, evidence of any major difference in the amount of damage incurred by the two muscles.
As reported by us (Brooks & Faulkner, 1988, 1991) and many others (Phillips et al. 1991; Holloszy, 1995), age has a profound effect on the structure and function of skeletal muscles of control mice with an increasing atrophy, weakness, fatigue and susceptibility to injury. The data on EDL and soleus muscles of the control mice in the present study are in good agreement with the decreases with age in muscle masses, forces and powers of these same muscles of control mice reported previously (Brooks & Faulkner, 1988, 1990, 1991; Phillips et al. 1991). Our hypothesis that EDL and soleus muscles of 28-month-old mdx mice are smaller and weaker than muscles from 28-month-old control mice was partially rejected. The limb muscles of the 28-month-old mdx mice were definitely not smaller! Although the overall hypothesis was not supported, for most variables the slopes of the relationship with age were steeper for data on muscles of mdx than for control mice. Consequently, the corollary to our primary hypothesis that EDL and soleus muscles of 28-month-old mdx mice compared with 6-month-old mdx mice demonstrate decreases in muscle mass and absolute and normalised force and power was supported. We concur with Lefaucheur et al. (1995) that old mdx mice offer exciting new perspectives for investigations of the pathophysiology of DMD and potential therapies for successful treatment.
Acknowledgments
This work was supported by grants from the National Institute of Health P0-1 AG-15434 and the Muscular Dystrophy Association. From the Nathan Shock Center (P-30 AG-13283), the Mutant Transgenic Rodent Core maintained the old mice and the Contractility Core aided in the measurements of force and power. During this investigation, GSL was supported by a C. J. Martin Research Fellowship from the National Health and Medical Research Council of Australia.
References
- Anderson JE, Bressler BH, Ovalle WK. Functional regeneration in the hindlimb skeletal muscle of the mdx mouse. Journal of Muscle Research and Cell Motility. 1988;9:499–515. doi: 10.1007/BF01738755. [DOI] [PubMed] [Google Scholar]
- Anderson JE, McIntosh LM, Moor AN, Yablonka-Reuveni Z. Levels of MyoD protein expression following injury of mdx and normal limb muscle are modified by thyroid hormone. Journal of Histochemistry and Cytochemistry. 1998;46:59–67. doi: 10.1177/002215549804600108. [DOI] [PubMed] [Google Scholar]
- Beilharz M, Lareu R, Garrett KL, Grounds MD, Fletcher S. Quantitation of muscle precursor cell activity in skeletal muscle by Northern analysis of MyoD and myogenin probes: application to dystrophic (mdx) mouse muscles. Molecular and Cellular Neuroscience. 1992;3:326–333. doi: 10.1016/1044-7431(92)90029-2. [DOI] [PubMed] [Google Scholar]
- Brooks SV. Rapid recovery following contraction-induced injury to in situ skeletal muscles in mdx mice. Journal of Muscle Research and Cell Motility. 1998;19:179–187. doi: 10.1023/a:1005364713451. [DOI] [PubMed] [Google Scholar]
- Brooks SV, Faulkner JA. Contractile properties of skeletal muscles from young, adult and aged mice. Journal of Physiology. 1988;404:71–82. doi: 10.1113/jphysiol.1988.sp017279. [DOI] [PMC free article] [PubMed] [Google Scholar]
- Brooks SV, Faulkner JA. Contraction-induced injury: recovery of skeletal muscles in young and old mice. American Journal of Physiology. 1990;258:C436–442. doi: 10.1152/ajpcell.1990.258.3.C436. [DOI] [PubMed] [Google Scholar]
- Brooks SV, Faulkner JA. Maximum and sustained power of extensor digitorum longus muscles from young, adult, and old mice. Journal of Gerontology: Biological Sciences. 1991;46:B28–33. doi: 10.1093/geronj/46.1.b28. [DOI] [PubMed] [Google Scholar]
- Bulfield G, Siller WG, Wight PA, Moore KJ. X chromosome-linked muscular dystrophy (mdx) in the mouse. Proceedings of the National Academy of Sciences of the USA. 1984;81:1189–1192. doi: 10.1073/pnas.81.4.1189. [DOI] [PMC free article] [PubMed] [Google Scholar]
- Burkholder TJ, Fingado B, Baron S, Lieber RL. Relationship between muscle fiber types and sizes and muscle architectural properties in the mouse hindlimb. Journal of Morphology. 1994;221:177–190. doi: 10.1002/jmor.1052210207. [DOI] [PubMed] [Google Scholar]
- Campbell KP. Three muscular dystrophies: loss of cytoskeleton-extracellular matrix linkage. Cell. 1995;80:675–679. doi: 10.1016/0092-8674(95)90344-5. [DOI] [PubMed] [Google Scholar]
- Carnwath JW, Shotton DM. Muscular dystrophy in the mdx mouse: histopathology of the soleus and extensor digitorum longus muscles. Journal of the Neurological Sciences. 1987;80:39–54. doi: 10.1016/0022-510x(87)90219-x. [DOI] [PubMed] [Google Scholar]
- Coirault C, Lambert F, Marchand-Adam S, Attal P, Chemla D, Lecarpentier Y. Myosin molecular motor dysfunction in dystrophic mouse diaphragm. American Journal of Physiology. 1999;277:C1170–1176. doi: 10.1152/ajpcell.1999.277.6.C1170. [DOI] [PubMed] [Google Scholar]
- Coulton GR, Curtin NA, Morgan JE, Partridge TA. The mdx mouse skeletal muscle myopathy: II. Contractile properties. Neuropathology and Applied Neurobiology. 1988a;14:299–314. doi: 10.1111/j.1365-2990.1988.tb00890.x. [DOI] [PubMed] [Google Scholar]
- Coulton GR, Morgan JE, Partridge TA, Sloper JC. The mdx mouse skeletal muscle myopathy: I. A histological, morphometric and biochemical investigation. Neuropathology and Applied Neurobiology. 1988b;14:53–70. doi: 10.1111/j.1365-2990.1988.tb00866.x. [DOI] [PubMed] [Google Scholar]
- Cox GA, Cole NM, Matsumura K, Phelps SF, Hauschka SD, Campbell KP, Faulkner JA, Chamberlain JS. Overexpression of dystrophin in transgenic mdx mice eliminates dystrophic symptoms without toxicity. Nature. 1993;364:725–729. doi: 10.1038/364725a0. [DOI] [PubMed] [Google Scholar]
- Dangain J, Vrbova G. Muscle development in mdx mutant mice. Muscle and Nerve. 1984;7:700–704. doi: 10.1002/mus.880070903. [DOI] [PubMed] [Google Scholar]
- Deconinck N, Rafael JA, Beckers-Bleukx G, Kahn D, Deconinck AE, Davies KE, Gillis JM. Consequences of the combined deficiency in dystrophin and utrophin on the mechanical properties and myosin composition of some limb and respiratory muscles of the mouse. Neuromuscular Disorders. 1998;8:362–370. doi: 10.1016/s0960-8966(98)00048-0. [DOI] [PubMed] [Google Scholar]
- Dupont-Versteegden EE, McCarter RJ. Differential expression of muscular dystrophy in diaphragm versus hindlimb muscles of mdx mice. Muscle and Nerve. 1992;15:1105–1110. doi: 10.1002/mus.880151008. [DOI] [PubMed] [Google Scholar]
- Even PC, Decrouy A, Chinet A. Defective regulation of energy metabolism in mdx-mouse skeletal muscles. Biochemical Journal. 1994;304:649–654. doi: 10.1042/bj3040649. [DOI] [PMC free article] [PubMed] [Google Scholar]
- Faulkner JA, Brooks SV, Dennis RG, Lynch GS. The functional status of dystrophic muscles and functional recovery by skeletal muscles following myoblast transfer. Basic and Applied Myology. 1997;7:257–264. [Google Scholar]
- Florini JR. Effect of ageing on skeletal muscle composition and function. In: Rothstein M, editor. Review of Biological Research in Aging. New York: Alan R. Liss, Inc; 1987. pp. 337–358. [Google Scholar]
- Gillis JM. Understanding dystrophinopathies: an inventory of the structural and functional consequences of the absence of dystrophin in muscles of the mdx mouse. Journal of Muscle Research and Cell Motility. 1999;20:605–625. doi: 10.1023/a:1005545325254. [DOI] [PubMed] [Google Scholar]
- Grounds MD, McGeachie JK. Skeletal muscle regeneration after crush injury in dystrophic mdx mice: an autoradiographic study. Muscle and Nerve. 1992;15:580–586. doi: 10.1002/mus.880150508. [DOI] [PubMed] [Google Scholar]
- Hayes A, Williams DA. Contractile function and low-intensity exercise effects of old dystrophic (mdx) mice. American Journal of Physiology. 1998;274:C1138–1144. doi: 10.1152/ajpcell.1998.274.4.C1138. [DOI] [PubMed] [Google Scholar]
- Head SI, Williams DA, Stephenson DG. Abnormalities in structure and function of limb skeletal muscle fibres of dystrophic mdx mice. Proceedings of the Royal Society. 1992;248:B163–169. doi: 10.1098/rspb.1992.0058. [DOI] [PubMed] [Google Scholar]
- Holloszy JO. Workshop on sarcopenia: muscle atrophy in old age. Journal of Gerontology. 1995;50A:1–161. [PubMed] [Google Scholar]
- Im WB, Phelps SF, Copen EH, Adams EG, Slightom JL, Chamberlain JS. Differential expression of dystrophin isoforms in strains of mdx mice with different mutations. Human and Molecular Genetics. 1996;5:1149–1153. doi: 10.1093/hmg/5.8.1149. [DOI] [PubMed] [Google Scholar]
- Koenig M, Hoffman EP, Bertelson CJ, Monaco AP, Feener C, Kunkel LM. Complete cloning of the Duchenne muscular dystrophy (DMD) cDNA and preliminary genomic organization of the DMD gene in normal and affected individuals. Cell. 1987;50:509–517. doi: 10.1016/0092-8674(87)90504-6. [DOI] [PubMed] [Google Scholar]
- Lefaucheur JP, Pastoret C, Sebille A. Phenotype of dystrophinopathy in old mdx mice. Anatomical Record. 1995;242:70–76. doi: 10.1002/ar.1092420109. [DOI] [PubMed] [Google Scholar]
- Lynch GS, Hinkle RT, Faulkner JA. Power output of fast and slow skeletal muscles of mdx (dystrophic) and control mice after clenbuterol treatment. Experimental Physiology. 2000a;85:295–299. [PubMed] [Google Scholar]
- Lynch GS, Rafael JA, Chamberlain JS, Faulkner JA. Contraction-induced injury to single permeabilized muscle fibers from mdx, transgenic mdx, and control mice. American Journal of Physiology. 2000b;279:C1290–1294. doi: 10.1152/ajpcell.2000.279.4.C1290. [DOI] [PubMed] [Google Scholar]
- Lynch GS, Rafael JA, Hinkle RT, Cole NM, Chamberlain JS, Faulkner JA. Contractile properties of diaphragm muscle segments from old mdx and old transgenic mdx mice. American Journal of Physiology. 1997;272:C2063–2068. doi: 10.1152/ajpcell.1997.272.6.C2063. [DOI] [PubMed] [Google Scholar]
- MacLennan PA, Edwards RH. Protein turnover is elevated in muscle of mdx mice in vivo. Biochemical Journal. 1990;268:795–797. doi: 10.1042/bj2680795. [DOI] [PMC free article] [PubMed] [Google Scholar]
- Moser H. Duchenne muscular dystrophy: pathogenetic aspects and genetic prevention. Human Genetics. 1984;66:17–40. doi: 10.1007/BF00275183. [DOI] [PubMed] [Google Scholar]
- Partridge TE. Molecular and Cell Biology of Muscular Dystrophy. 1. London: Chapman & Hall; 1993. [Google Scholar]
- Pastoret C, Sebille A. Time course study of the isometric contractile properties of mdx mouse striated muscles. Journal of Muscle Research and Cell Motility. 1993;14:423–431. doi: 10.1007/BF00121294. [DOI] [PubMed] [Google Scholar]
- Pastoret C, Sebille A. mdx mice show progressive weakness and muscle deterioration with age. Journal of the Neurological Sciences. 1995;129:97–105. doi: 10.1016/0022-510x(94)00276-t. [DOI] [PubMed] [Google Scholar]
- Petrof BJ, Shrager JB, Stedman HH, Kelly AM, Sweeney HL. Dystrophin protects the sarcolemma from stresses developed during muscle contraction. Proceedings of the National Academy of Sciences of the USA. 1993;90:3710–3714. doi: 10.1073/pnas.90.8.3710. [DOI] [PMC free article] [PubMed] [Google Scholar]
- Phillips SK, Bruce SA, Woledge RC. In mice, the muscle weakness due to age is absent during stretching. Journal of Physiology. 1991;437:63–70. doi: 10.1113/jphysiol.1991.sp018583. [DOI] [PMC free article] [PubMed] [Google Scholar]
- Quinlan JG, Johnson SR, Mckee MK, Lyden SP. Twitch and tetanus in mdx mouse muscle. Muscle and Nerve. 1992;15:837–842. doi: 10.1002/mus.880150713. [DOI] [PubMed] [Google Scholar]
- Roy RR, Meadows ID, Baldwin KM, Edgerton VR. Functional significance of compensatory overloaded rat fast muscle. Journal of Applied Physiology. 1982;52:473–478. doi: 10.1152/jappl.1982.52.2.473. [DOI] [PubMed] [Google Scholar]
- Stedman HH, Sweeney HL, Shrager JB, Maguire HC, Panettieri RA, Petrof B, Narusawa M, Leferovich JM, Sladky JT, Kelly AM. The mdx mouse diaphragm reproduces the degenerative changes of Duchenne muscular dystrophy. Nature. 1991;352:536–539. doi: 10.1038/352536a0. [DOI] [PubMed] [Google Scholar]
- Straub V, Rafael JA, Chamberlain JS, Campbell KP. Animal models for muscular dystrophy show different patterns of sarcolemmal disruption. Journal of Cell Biology. 1997;139:375–385. doi: 10.1083/jcb.139.2.375. [DOI] [PMC free article] [PubMed] [Google Scholar]
- Tanabe Y, Esaki K, Nomura T. Skeletal muscle pathology in X chromosome-linked muscular dystrophy (mdx) mouse. Acta Neuropathologica. 1986;69:91–95. doi: 10.1007/BF00687043. [DOI] [PubMed] [Google Scholar]
- Wineinger MA, Abresch RT, Walsh SA, Carter GT. Effects of ageing and voluntary exercise on the function of dystrophic muscle from mdx mice. American Journal of Physical Medicine and Rehabilitation. 1998;77:20–27. doi: 10.1097/00002060-199801000-00004. [DOI] [PubMed] [Google Scholar]
- Zacharias JM, Anderson JE. Muscle regeneration after imposed injury is better in younger than older mdx dystrophic mice. Journal of the Neurological Sciences. 1991;104:190–196. doi: 10.1016/0022-510x(91)90309-u. [DOI] [PubMed] [Google Scholar]