Abstract
Our aim was to identify the small-conductance Ca2+-activated K+ channel(s) (SK) underlying the apamin-sensitive afterhyperpolarization (AHP) in rat superior cervical ganglion (SCG) neurones.
Degenerate oligonucleotide primers designed to the putative calmodulin-binding domain conserved in all mammalian SK channel sequences were employed to detect SK DNA in a cDNA library from rat SCG. Only a single band, corresponding to a fragment of the rSK3 gene, was amplified.
Northern blot analysis employing a PCR-generated rSK3 fragment showed the presence of mRNA coding for SK3 in SCG as well in other rat peripheral tissues including adrenal gland and liver.
The same rSK3 fragment enabled the isolation of a full-length rSK3 cDNA from the library. Its sequence was closely similar to, but not identical with, that of the previously reported rSK3 gene.
Expression of the rSK3 gene in mammalian cell lines (CHO, HEK cells) caused the appearance of a K+ conductance with SK channel properties.
The application of selective SK blocking agents (including apamin, scyllatoxin and newer non-peptidic compounds) showed these homomeric SK3 channels to have essentially the same pharmacological characteristics as the SCG afterhyperpolarization, but to differ from those of homomeric SK1 and SK2 channels.
Immunohistochemistry using a rSK3 antipeptide antibody revealed the presence of SK3 protein in the cell bodies and processes of cultured SCG neurones.
Taken together, these results identify SK3 as a major component of the SK channels responsible for the afterhyperpolarization of cultured rat SCG neurones.
As with many neurones, action potentials in sympathetic ganglion cells are followed by a slow post-spike afterhyperpolarization (AHP). Early ion substitution experiments (Blackman et al. 1963) suggested that this AHP reflected an increase in K+ conductance and it is now known that the K+ channels involved open in response to an influx of Ca2+ ions during the preceding action potential (McAfee & Yarowsky, 1979; see Sah, 1996, for additional references and a review). These Ca2+-activated K+ channels have a small conductance (∼2 pS under physiological conditions; Selyanko, 1996) and are blocked by apamin (Kawai & Watanabe, 1986), indicating that they belong to the SKCa subfamily of potassium channels (for reviews see Haylett & Jenkinson, 1990; Sah, 1996; Vergara et al. 1998; Castle, 1999; Sah & Davies, 2000).
Recently, molecular cloning studies have revealed three distinct genes (SK1, SK2 and SK3) that code for SKCa channel subunits in the CNS (Kohler et al. 1996; Joiner et al. 1997; Bond et al. 2000). Northern blot analysis and in situ hybridization studies have shown that SK channel mRNA is widely distributed in both the brain and peripheral tissues. These genes, and in particular SK1 and SK2, have overlapping patterns of tissue expression (Kohler et al. 1996; Stocker et al. 1999; Stocker & Pedarzani, 2000). In vitro studies have shown that each SK channel gene can form functional homomeric SKCa channels when expressed in either Xenopus oocytes or mammalian cell lines (Kohler et al. 1996; Shah & Haylett, 2000). Further, in the mammalian cell lines each of these channels is sensitive to apamin (Shah & Haylett, 2000; Strøbæk et al. 2000). Finally, SK1 and SK2 subunits have been shown, in vitro, to combine and form heteromeric channels with a unique pharmacological profile (Ishii et al. 1997). It is clear from these findings that native AHP currents might be carried by a variety of different SKCa channels, so that there is a need for direct evidence to determine which subunits are involved. This is addressed in the present study in which our aim was to identify the molecular components of channels mediating the AHP in rat superior cervical ganglion (SCG) neurones. A preliminary account of some of our findings has been given by Hosseini et al. (1999).
METHODS
Cloning of the rSK3 gene and stable cell expression
Degenerate oligonucleotides were designed to the amino acid sequences KAEKHVH (primer sequence aargcigaraarcaygtnca) and VHNFMMD (primer sequence gticayaayttyatgatgga), where r represents a or g, y represents c or t, i represents deoxyinosine and n represents a, t, g or c. These amino acid sequences were chosen because they are absolutely conserved in all vertebrate SK/IK channel genes found to date and are central to the putative SK channel calmodulin-binding region identified by Xia et al. (1998). Nested PCR reactions with these degenerate primers and T7/M13-20 reverse primers were then used in 30-cycle PCR amplifications (cycling parameters of 95 °C for 30 s, 55 °C for 30 s and extension at 72 °C for 1 min). These reactions amplified a single band from a rat SCG cDNA (Unizap) library (kindly provided by Dr D. Lipscombe, Department of Neuroscience, Brown University, RI, USA). Sequencing of this band identified it as coding for a 600 bp 3′ fragment of the rSK3 gene. This fragment was then labelled by random priming with α-[32P]dCTP using the Mega Prime DNA labelling system (Amersham) to a specific activity of 108 d.p.m. μg−1 and was subsequently used to probe the SCG cDNA library. Positive plaques (24 in total) were identified and replated at a lower density. They were then rescreened with an α-[32P]dCTP-labelled 5′ 1.1 kb fragment of rSK3 (obtained by PCR using rSK3-specific oligonucleotides) to select for full-length clones. Seven positive plaques were isolated and single clones were excised into the pBluescript vector. The sizes of the clones were initially determined by EcoR I-Xho I digestion. Three of the longest clones were subsequently sequenced using the automated ABI Prism sequencer and two provided full-length clones. For expression studies, the largest of these cDNAs (clone 24a) was subcloned into the pcDNA 3.1 Zeo+ plasmid (Invitrogen) for transfection into mammalian cells. Chinese hamster ovary cells (CHO cell line) or human embryonic kidney cells (HEK 293 cell line) were stably transfected (by the calcium phosphate method) with this construct and were then selected for by adding Zeocin to the growth media (0.5-1.0 mg ml−1).
Northern blot analysis
Total RNA was isolated from tissues (liver, dorsal root ganglion (DRG), SCG, whole ventricle (right and left) and whole adrenal gland) of male, adult Sprague-Dawley rats killed by inhalation of a steadily rising concentration of CO2. RNA extraction was performedusing the one-step acid guanidinium thiocyanate-phenol-chloroform extraction method of Chomczynski & Sacchi (1987). For each tissue approximately 10 μg of the RNA was used for formaldehyde gel electrophoresis and blotting onto a Hybond-XL nylon membrane (Amersham). After UV crosslinking, the membrane was blocked and probed with an α-[32P]dCTP-labelled 1.1 kb BamH I fragment of mouse β-actin to check the quality as well as relative abundance of the mRNA. The membrane was then stripped and reprobed with a rSK3 1100 bp 5′ PCR fragment.
Tissue culture
Maintenance of cell lines
HEK 293 and CHO cells were maintained in Dulbecco's modified Eagle's medium (DMEM) and alpha minimal essential medium (alpha MEM), respectively, each supplemented with 10 % fetal calf serum (FCS) 2 mm l-glutamine, penicillin (100 units ml−1) and streptomycin (100 μg ml−1). For recording, cells were plated on 35 mm Petri dishes and used within 2 days of plating. For antibody staining the cells were plated on glass coverslips.
SCG neurones
SCG neurones were cultured from 17-day-old Sprague-Dawley rats using the procedure described by Dunn (1994). Briefly, superior cervical ganglia were removed from rats killed by inhalation of a steadily increasing concentration of CO2 (in accordance with Home Office and Institution guidelines). The ganglia were dissociated by incubation with collagenase followed by trypsin and cultured in L-15 medium (Sigma L5520, supplemented with 10 % FCS and 50 ng ml−1 nerve growth factor (NGF)) for 5-7 days. For electrophysiological recording the cells were plated on laminin-coated 35 mm Petri dishes (Falcon) and for antibody staining on poly-d-lysine (0.1 mg ml−1)-coated glass coverslips.
Antibody staining
Cultures of SCG neurones and HEK 293 cells were rinsed 3 times with PBS and fixed with freshly prepared 4 % paraformaldehyde for 10 min at room temperature. After rinsing with PBS, cells were permeabilized with methanol at room temperature for a further 10 min. After rinsing again with PBS, they were blocked with blocking buffer (2 % bovine serum albumin (BSA), 2 % horse serum in PBS) at room temperature for 60 min. The cells were then incubated with a 1:200 dilution of rSK3 antipeptide antibody (Chemicon; 0.3 μg μl−1) in blocking buffer at room temperature for 4 h. After washing 3 times (10 min each) with PBS containing 0.1 % Tween-20, they were incubated with a 1:100 dilution of goat anti-rabbit secondary antibody (IgG fraction, conjugated to TRITC (tetramethyl rhodamine isothiocyanate) fluorophore, Molecular Probes) in blocking buffer. After three further washes with PBS-Tween-20 (as before), and a final wash with PBS alone, the coverslips were mounted on ethanol-cleaned slides using a small drop of antifade mount (Vector Laboratories Inc.) and viewed under a Leica confocal microscope.
Electrophysiology
Cell lines
Conventional whole-cell patch-clamp methods were used to record currents from stably transfected CHO and HEK 293 cells expressing rSK3 and rSK2, respectively. The bathing solution contained (mm): NaCl 150, KCl 5, MgCl2 1, CaCl2 2, glucose 10 and Hepes 10, and the pH was adjusted to 7.4 with NaOH. The pipette-filling solution contained (mm): KCl 140, Hepes 10, K2HEDTA 5 and either CaCl2 1.2 (free Ca2+ 1 μm) or no added Ca2+ (free Ca2+ < 10 nm). The pH was adjusted to 7.2 with KOH. Free Ca2+ concentrations were calculated using stability constants from Martell & Smith (1974). Patch pipettes were fabricated from 1.5 mm o.d. borosilicate glass (Clark Electromedical), fire polished and coated with Sylgard resin. They had resistances of 2-4 MΩ when filled with the above solution. Experiments were conducted at room temperature (24 °C).
Membrane currents were recorded with a List EPC7 patch-clamp amplifier. Data were digitized at 5 kHz using a Digidata 1200 interface and pCLAMP 6.0 software (Axon Instruments). Routinely, cells (CHO or HEK 293) were held at -80 mV and current-voltage relationships generated by applying 100 ms voltage steps to potentials between -120 and +40 mV.
Recording the AHP from SCG neurones
For experiments on isolated SCG neurones the bathing solution contained (mm): NaCl 118, KCl 3.8, CaCl2 2.5, MgSO4 1.2, KH2PO4 1.2, NaHCO3 25 and glucose 11, and was gassed with 95 % O2-5 % CO2 to maintain a pH of 7.4. Recordings were made at a temperature of 30-31 °C using intracellular microelectrodes (90-140 MΩ) pulled from 1.0 mm o.d. glass and filled with 1 m KCl. Membrane potential measurement and current injection were performed using a Neurolog NL102G amplifier and the data acquired and analysed using a Digidata 1200 interface and pCLAMP 6.0 software. Single action potentials, followed by AHPs, were evoked by injecting brief (20-40 ms) pulses of depolarising current at intervals of 5 s.
Data analysis
In experiments on stably transfected cell lines the effects of blockers were expressed as the current at 0 mV (CHO cells) or -20 mV (HEK 293 cells) in the presence of blocker as a percentage of that in its absence. Similarly, in studies of the AHP in SCG neurones inhibition was calculated from the reduction in the magnitude of the AHP, measured at the time at which the inhibition was maximal (see Dunn, 1994). The resulting concentration-inhibition curves were fitted by the Hill equation in the form:
 |
where y is the percentage inhibition, [I] is the concentration of inhibitor, nH is the Hill coefficient and IC50 is the concentration of blocker that reduces the current to 50 % of the control value. Curve fitting was performed by the method of least squares minimization (with points weighted by the inverse of their variance) using the program CVFIT (written by Professor D. Colquhoun, University College London; available from http://www.ucl.ac.uk/pharmacol/dc.html), which provides an approximate standard deviation for the parameter estimates (see Colquhoun et al. 1974, for further explanation). Comparison of the currents developed in the presence and almost complete absence of free intracellular Ca2+ suggested that under the conditions used virtually all (> 95 %) of the current was due to activation of SK channels (see Results). The curves were, therefore, fitted assuming that complete inhibition of the current was possible. This was in keeping with the observed results although the presence of a small (< 10 %) non-inhibitable component cannot be excluded. It would, however, scarcely affect the IC50 values obtained. Where appropriate, other values are quoted as the mean ±s.e.m. with the number of observations in parentheses.
Drugs and reagents
All oligos and materials used for tissue culture were obtained from Gibco except for Zeocin (Cayla, Toulouse, France) and L15 medium, laminin, poly-d-lysine, collagenase and trypsin, which were obtained from Sigma.
UCL 1848 (8,14-diaza-1,7(1,4)-diquinolinacyclotetradecaphanedium di-trifluoroacetate), UCL 1684 (6,10-diaza-1,5(1,4)-diquinolina-3(1,3),8(1,4)-dibenzenacyclodecaphanedium tritrifluoroacetate hydrate) and UCL 1530 (8,19-diaza-1,7(1,4)diquinolina-3,5(1,4)-dibenzenacyclononadecanephanedium) tetratrifluoroacetate hydrate) were synthesized in the department of Chemistry, UCL as previously described (Campos Rosa et al. 1998, 2000; Chen et al. 2000). Apamin, gallamine, dequalinium and scyllatoxin were purchased from Sigma. Hepes and HEDTA were from Calbiochem. All other reagents were of Analar quality and obtained from Merck.
RESULTS
Isolation of the full-length clone
Degenerate oligos were used to perform nested PCR amplifications on a rat SCG library yielding a single band of ∼600 bp, which, after sequencing, was identified to be a fragment of the rSK3 gene. By subsequently using gene-specific oligos an extended rSK3 fragment was cloned from the library and used in Northern blot analysis to examine mRNA levels in SCG, DRG and other tissues. A clear signal of ∼4 kb in size was seen in mRNA isolated from SCG, confirming that the SK3 mRNA is abundant therein (Fig. 1). In contrast, only a weak signal was observed in DRG, suggesting that other subunits may underlie the apamin-sensitive AHPs reported to be present in these cells (Lüscher et al. 1994). Interestingly we found mRNA for SK3 to be present in a number of peripheral tissues in the rat, even where there was no evidence of functional SK channel protein (see Discussion).
Figure 1. Northern blot analysis of mRNA for rSK3 in rat tissues.
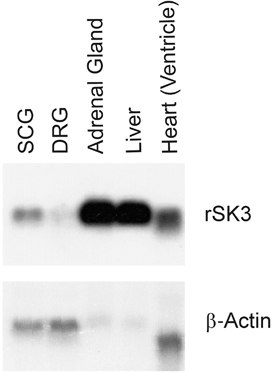
rSK3 mRNA (a single band of ∼4 kb in size) is abundant in SCG but not in DRG. It is also highly expressed in adrenal gland and, more surprisingly, in liver and heart (upper panel). For each lane approximately 10 μg of total RNA from each tissue was loaded onto the gel, blotted, fixed and probed with a 32P-labelled SK3 gene fragment. The blot was then stripped and re-probed with β-actin to compare loading (lower panel).
To obtain a working clone of rSK3, 24 positive plaques were isolated from the SCG library and the clone containing the longest insert was selected for further study. This clone contained a cDNA of ∼2.6 kb with in-frame stop codons present at the 5′ end and a reasonable Kozak consensus sequence (the sequence for initiation of transcription; see Kozak, 1987), making us confident in identifying the start methionine. (This sequence has been submitted to GenBank with accession number AF292389.) This clone thus represents the entire coding region of rSK3 as well as a 297 bp 5′ untranslated region (UTR) and a 22 bp 3′ UTR followed by a 19 bp poly-A tail. This sequence is approximately 175 amino acids longer than that initially reported by Kohler and colleagues and used for their first expression studies (Kohler et al. 1996). This extended sequence shows a high degree of identity with the human SK3 gene reported by Chandy et al. (1998) (Fig. 2) and is also very similar, although not identical, to the sequence of rSK3 as updated by Kohler and colleagues (GenBank accession no. U69884).
Figure 2. Alignment of predicted amino acid sequences from the rat SK3 gene (rSK3), the human SK3 gene (hSK3, accession number NM_002249) and the rat SK2 (accession number U69881) and SK1 (accession number AF000973) genes.
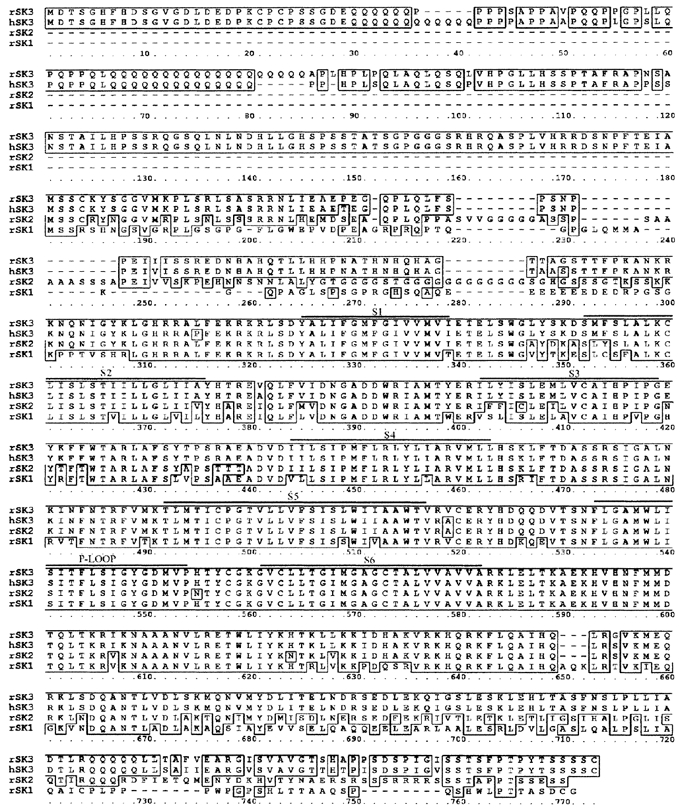
Boxes highlight amino acids that are conserved between rSK3 and one or more of the other sequences. The human and rat genes show greater similarity than originally reported, particularly at the amino-terminal end. Putative transmembrane elements (S1-6) and the potassium channel pore-forming ‘P-loop’ are indicated with bars. This alignment was made using the BLOSUM weight matrix with a gap open penalty of 8.0 and a gap extension penalty of 2.0.
Expression studies
Since the pharmacology of the homomeric SK1 channel expressed in mammalian cell lines may differ from that in Xenopus oocytes (Kohler et al. 1996; Shah & Haylett, 2000; Strøbæk et al. 2000; Grunnet et al. 2001), we have examined the properties of the full-length rSK3 gene stably expressed in CHO cells. In this mammalian-derived cell line whole-cell patch-clamp recordings using a 1 μm free calcium concentration in the pipette typically activated 0.5-2 nA of current at 0 mV (Fig. 3A). As would be expected for an SK channel the current was not voltage activated and reversed close to the predicted potassium equilibrium potential (EK, -85 mV; Fig. 7A-C). In experiments on transfected cells but with a calcium-free pipette-filling solution (Fig. 3B), and in wild-type cells with 1 μm Ca2+ in the pipette (Fig. 3C), the current observed was much smaller (16 ± 2 pA (n = 4) and 16 ± 1 pA (n = 3), respectively) suggesting that more than 97 % of the current seen in transfected cells was attributable to Ca2+ activation of SK3 channels. The Ca2+-activated K+ current developed rapidly after patch rupture as indicated by a fall in input resistance during the first minute of recording. It was usually possible to obtain recordings that were stable for up to 20 min although some cells showed either run-up or run-down. Cells were only used for pharmacological studies if the currents remained steady for at least 4 min prior to the application of drugs and in all such recordings the current had stabilized within 10 min of patch rupture (approximately 25 % of all cells met these criteria).
Figure 3. Expression of the full-length rSK3 gene in CHO cells produces high levels of SK channel current.
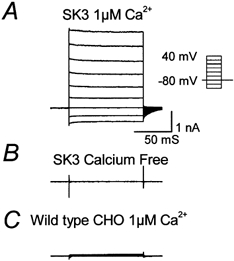
Large voltage-independent currents are seen when the patch pipette contains 1 μm free calcium (A). These currents are not observed when calcium is omitted (B). Wild-type cells do not show any endogenous SK current when 1 μm free calcium is included in the pipette (C). The inset shows the pulse protocol used in these experiments. Currents were recorded 1-2 min after patch rupture.
Figure 7. Block of SK3 current by apamin, UCL 1848 and UCL 1684 is not voltage dependent.
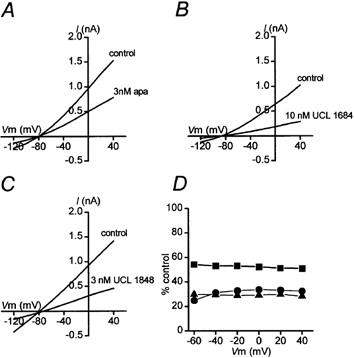
Current-voltage relationships showing control curves and partial block of rSK3 current by apamin (A), UCL 1684 (B) and UCL 1848 (C). In each case the inhibited current reverses close to the predicted value of EK (-85 mV). D, the block by these compounds (▪, apamin; •, UCL 1848; ▴, UCL 1684) was not significantly voltage dependent. Current in the presence of blocker, as a percentage of control, has been plotted as a function of membrane potential (Vm).
Similar currents were observed with a HEK 293 cell line stably expressing rSK2. Because wild-type HEK 293 cells possess an endogenous outwardly rectifying current that at more positive potentials might have contaminated the Ca2+-activated current, we measured the inhibition of current by pharmacological agents with the membrane potential stepped to -20 mV (rather than 0 mV as with CHO cells).
Pharmacology
We found that rSK3 channels expressed in CHO cells were blocked by apamin at concentrations that also inhibited the AHP recorded from rat SCG neurones (Fig. 4). However, these actions of apamin were only slowly reversible, taking many minutes to wane. Though this limited the amount of information that could be obtained, parts of the concentration-inhibition relationships for the two actions were established as shown in Fig. 4C. These homomeric SK3 channels were also blocked by other potent inhibitors of the AHP such as scyllatoxin, UCL 1684 (Campos Rosa et al. 1998, 2000; Dunn, 1999) and UCL 1848 (Benton et al. 1999; Chen et al. 2000). Each of these agents acted quickly and their effects reversed much more rapidly than those of apamin so that recovery was complete within 4-7 min of washout. As illustrated for UCL 1848 in Fig. 5C and for scyllatoxin in Fig. 6C, the concentration-inhibition curves for SK3 and the AHP accord well (although exact correspondence is not to be expected because of the different quantities being measured). Here it is important to note that the block of SK3 channels by these agents is not voltage dependent, as shown in Fig. 7 for apamin, UCL 1684 and UCL 1848. The same holds for scyllatoxin block (data not shown), so voltage dependencies do not distort the comparison with AHP inhibition.
Figure 4. SK3 current and the AHP are blocked by apamin with comparable potency.
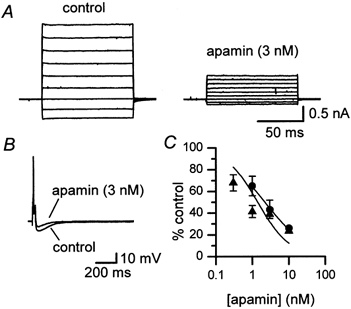
A, SK3 current recorded from a transfected CHO cell in the absence (control) and presence (after 8 min exposure) of apamin (3 nm). B, 3 nm apamin causes a similar degree of inhibition of the AHP as measured by intracellular recording from a rat SCG neurone; each trace is the mean of 3 successive action potentials. The cell was exposed to apamin for 5 min and had a resting membrane potential of -57 mV. C, concentration-inhibition relationships for block of the AHP (•) and of SK3 current (▴). Each point is the mean of 3 observations and the vertical bars indicate the s.e.m. The fitted lines were drawn using the Hill equation with nH constrained to unity for the SK3 values, for consistency with our observations (Figs 5, 6 and 8) with other SK3 blockers. The IC50 values obtained thereby are given in Table 1.
Figure 5. UCL 1848 blocks rSK3 and the AHP with similar potency but exhibits a marked selectivity for rSK2.
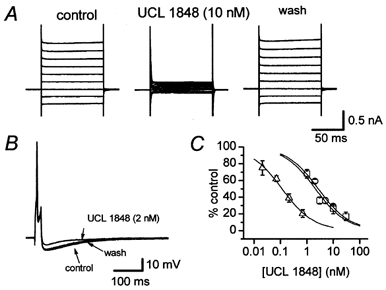
A, the effect of 10 nm UCL 1848 on SK3 current recorded from a stably transfected CHO cell. Block was maximal after 3 min exposure to UCL 1848 and the current recovered after 4 min washout. B, inhibition of the AHP by 2 nm UCL 1848. The superimposed traces show the mean of 3 action potentials and AHPs recorded from a rat SCG neurone before (control), at the end of a 70 s application of 2 nm UCL 1848 and 4 min after washout when recovery was almost complete. The resting membrane potential of the cell was -59 mV. C, concentration-inhibition curves for inhibition by UCL 1848 of rSK2 current (▵), rSK3 current (□) and the AHP (○). Each point is the mean of 3-5 observations and vertical bars indicate the s.e.m. Continuous lines are best fits of the Hill equation to the data and the IC50 values have been included in Table 1.
Figure 6. The effect of scyllatoxin on SK3 current and the AHP.
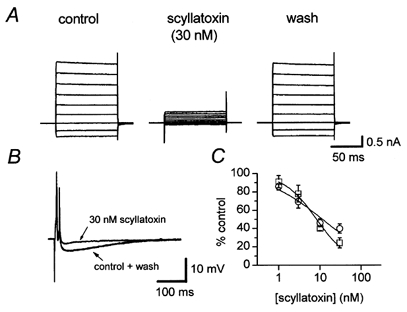
A, SK3 current recorded from a transfected CHO cell immediately before (control) and after 3 min exposure to 30 nm scyllatoxin. Recovery was complete 2 min after washout. B, 30 nm scyllatoxin caused a similar degree of inhibition of the AHP recorded from a rat SCG neurone. Each trace is the mean of 3 successive action potentials and AHPs recorded before (control), after 3 min exposure to scyllatoxin and 7 min after washout. The traces before and after application of scyllatoxin are almost identical. The membrane potential of this cell was -57 mV. C, concentration-inhibition curves for block of SK3 current (□) and the AHP (○) by scyllatoxin. The fitted lines were drawn using the Hill equation and the estimates of IC50 are given in Table 1. Each point is the mean of 3-4 observations and the vertical bars indicate the s.e.m.
In contrast to the pharmacology of the SK3 current, the block of either SK2 (Fig. 5C, Table 1) or SK1 channels (Table 1) correlates poorly with AHP inhibition. This is best seen by comparing the rank order of potencies and the IC50 values for four selective SK channel blockers; apamin, scyllatoxin, UCL 1848 and UCL 1684 (Table 1). All four agents caused a half-maximal block of SK2 channels at concentrations that would produce little or no reduction in the AHP. The distinction is clearest with scyllatoxin, which has an IC50 for SK2 block that is 40-fold lower than that for inhibition of the AHP (IC50 values of 0.29 vs. 11 nm). Similarly, the IC50 values for apamin, UCL 1848 and UCL 1684 are 29-fold (0.08 vs. 2.3 nm), 23-fold (0.12 vs. 2.7 nm) and 11-fold (0.36 vs. 4.1 nm) lower, respectively. A second revealing comparison can be made of the relative potencies of these compounds in inhibiting SK1 and SK3 currents and the AHP. As can be seen from Table 1, there is an ∼100-fold difference in the potencies of scyllatoxin and UCL 1684 on SK1 channels (IC50 values of 80 vs. 0.8 nm), but only a 2- to 3-fold difference is found in either SK3 or AHP block. Further, while apamin is a less active blocker of SK1 channels than either UCL 1684 or UCL 1848 (which are approximately 7-9 times more effective), the reverse order of potency is seen with the SCG AHP, SK3 and SK2 channels, i.e. apamin is more potent than either of the UCL compounds.
Table 1.
The potency of blocking agents tested on the SCG AHP and on SK channels
| Blocker | SCG neurones | rSK3 | rSK2 | hSK1 |
|---|---|---|---|---|
| Apamin (nM) | 2.3 ± 0.7 | 1.4 ± 0.2 | 0.08 ± 0.01† | 7.7 ± 1.7* |
| Scyllatoxin (nM) | 11.4 ± 2.5 | 8.3 ± 1.2 | 0.287 ± 0.013† | 80 ± 23 † |
| UCL 1848 (nM) | 2.7 ± 0.2 | 2.1 ± 0.3 | 0.12 ± 0.04 | 1.1 ± 0.4* |
| UCL 1684 (nM) | 4.1 ± 0.2‡ | 5.8 ± 0.3 | 0.36 ± 0.08† | 0.8 ± 0.2† |
IC50 values for the inhibitory action of apamin, UCL 1848 and UCL 1684 on the AHP, human (h)SK1, rat (r)SK2 or rSK3 channels were determined as described in Methods, except where specifically noted. The pharmacology of block for the SCG AHP closely matches the profile of SK3 but not SK1 and SK2 channels.
From Shah & Haylett (2000).
From Strøbæk et al. (2000).
From Malik-Hall et al. (2000).
Taken together, these observations confirm that the pharmacology of the expressed rSK3 channel closely resembles that of the AHP whereas that of the SK1 and SK2 channels is very different. We extended this analysis by comparing the block of SK3 channels and of the AHP by other agents with a wider range of potencies. The results are shown in Fig. 8A. Each of these agents inhibited the AHP in SCG neurones as well as the current carried by the expressed SK3 channels. Furthermore, the IC50 values are well correlated (r = 0.99± 0.21) over the entire 100 000-fold range, with a slope close to unity (1.06 ± 0.05; Fig. 8B). This is clearly in keeping with the idea that SK3 channels determine the pharmacology of block for the AHP in SCG neurones.
Figure 8. The pharmacology of AHP block matches that of rSK3 block for a wide range of compounds.
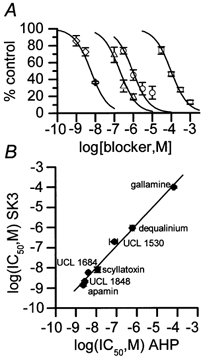
A, concentration-inhibition curves for block of rSK3 current in transfected CHO cells by UCL 1684 (⋄), UCL 1530 (▵), dequalinium (○) and gallamine (□). Each point is the mean of 3 observations and the vertical bars indicate the s.e.m. The lines were drawn by fitting the Hill equation to the data with nH= 1. The IC50 values were: UCL 1684 5.8 ± 0.3 nm, UCL 1530 195 ± 34 nm, dequalinium 920 ± 140 nm and gallamine 97.5 ± 0.7 μm. B, correlation between log IC50 for block of rSK3 current (ordinate) and of the AHP (abscissa). The regression line shows a close correlation (r = 0.99± 0.21) between the potency of the compounds in the two test systems with a slope close to unity (1.06 ± 0.05). IC50 values for inhibition of the AHP in SCG neurones for UCL 1530, dequalinium and gallamine are taken from Dunn et al. (1996); all other values are shown above and in Table 1. With the exception of UCL 1530, the error in each point was less than the size of the symbol.
Immuno-staining of SCG neurones
Finally, we have studied the distribution of these channels in a preparation of cultured SCG neurones. This is particularly important given that Northern blot mRNA levels do not seem to correspond to levels of functional protein for several tissues. We have used a commercially available antibody (Chemicon) that produces strong staining in our stable HEK 293 cell line expressing the rSK3 gene (Fig. 9A). Furthermore, this staining is at or near the cell membrane. No such signal was detected when this antibody was applied to a similar HEK cell line stably expressing SK2 (Fig. 9B), or when the anti-SK3 antibodies were replaced with normal rabbit serum (data not shown).
Figure 9. Anti-SK3 antibodies specifically recognize the SK3 protein and stain both cell bodies and processes in SCG neurones.
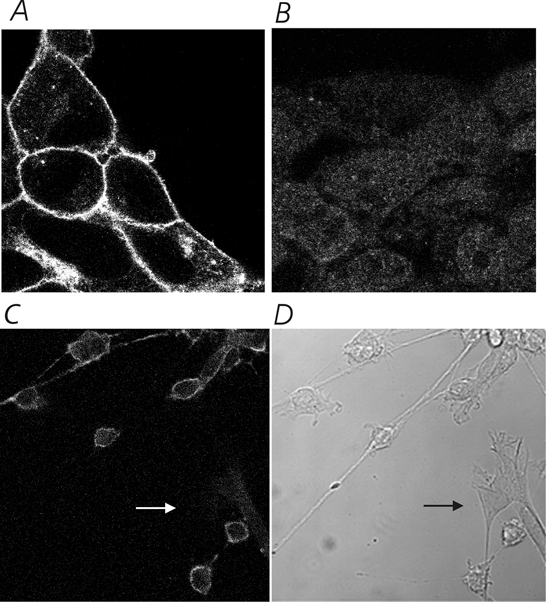
A, HEK cells (high magnification) stably transfected with the rSK3 gene show strong membrane staining for the SK3 protein. B, no specific staining is seen in HEK cells similarly transfected with rSK2. Both stably transfected cell lines produced large calcium-dependent currents in whole-cell patch-clamp experiments. C, application of the anti-rSK3 antibody to SCG cells (shown at low magnification) reveals membrane staining in the neurones but not the surrounding fibroblasts (an example of which is highlighted by the arrow in both C and D). D, bright-field image of the cells shown in C.
A clear signal was also seen when SCG neurones were stained with the same anti-SK3 antibody. The staining is specific to neurones and does not show up on neighbouring fibroblasts (see Fig. 9C and D). These results indicate that the SK3 mRNA detected in our Northern blot does reflect expressed protein in the SCG neurones. Further, whilst it must be remembered that these are cultured neurones and the same may not apply to cells in vivo, it is interesting that SK3 protein appears to be in both the cell bodies and processes (Fig. 9C).
DISCUSSION
We used PCR with degenerate oligonucleotides as a starting point for determining the molecular components that might underlie the AHP in sympathetic cells. By this route we identified and cloned the rat gene for SK3. Our sequence extends by approximately 175 amino acids that first reported by Kohler and colleagues (Kohler et al. 1996) but is now in close though not exact agreement with their sequence as updated in GenBank (accession no. U69884). Northern blot analysis confirmed that the SCG shows a clear signal for rSK3 mRNA. However it has to be kept in mind that mRNA levels do not always correspond to levels of functional protein and SK proteins are no exception. For example, we see a substantial signal in liver, in keeping with recent evidence for the presence of mRNA for SK3, and SK3 immunoreactivity (albeit mainly intracellular) in rat liver (Barfod et al. 2001). However, electrophysiological studies, and measurements of the binding of labelled apamin, show no evidence for SK channel expression in rat hepatocytes isolated from males of normal weight, as used in the present work (Burgess et al. 1981; Cook & Haylett, 1985; Takanashi et al. 1992). This has been reported only in the liver of old, obese, female rats (Yamashita et al. 1996) though the hepatocytes of most other mammalian species do exhibit a calcium-activated potassium permeability (see Burgess et al. 1981, for references). Also in keeping with the work of others (Imbert et al. 1996), we find that SK3 mRNA can be detected in both heart (Fig. 1) and skeletal muscle (data not shown) of adult rats even though extensive study of these tissues has provided little evidence for SKCa function under physiological conditions. Interestingly, Pribnow et al. (1999) reported a similar dissociation between mRNA levels and protein expression in experiments with L6 myoblasts and differentiated L6 myotubes: both produce high levels of SK3 mRNA, but only the myotubes appear to produce functional SK3 protein.
We have shown that SK3 channels are present on both the cell body and the processes of SCG neurones. Using selective agents we have also demonstrated that the pharmacology of these channels is essentially identical to that of the neuronal AHP. A comparison of the block of the AHP by apamin, scyllatoxin, UCL 1684 and UCL 1848 with that of homomeric SK2 or SK1 channels reveals a quite different pattern to the one seen with SK3 (Table 1). Furthermore, our preliminary results for apamin, gallamine and dequalinium block of SK3 channels expressed in a second mammalian cell line (HEK 293 cells, see Hosseini et al. 1999) agree well with those reported here for CHO cells, as does the limited SK3 expression data in oocytes (Kohler et al. 1996; Ishii et al. 1997). Taken together, the present findings strongly suggest that SK3 subunits form an important molecular component of the channels that underlie the AHP in rat SCG neurones. Moreover, they largely or wholly determine the pharmacological characteristics of the native channels. Our results do not, however, rule out either the possible involvement of additional, auxiliary, subunits (e.g. see Wadsworth et al. 1994, 1997) or some co-assembly with other SK subunits. Indeed, preliminary Western blot experiments (using antibodies to the C-terminal regions of SK1 and SK2 that we are presently characterizing) suggest that these protein subunits are present in the whole ganglion (R. Hosseini & G. W. J. Moss, unpublished observations). Thus more work will be needed to determine whether or not SK1 and SK2 are present in the neurones and contribute to the AHP current. However, if these genes are expressed in the SCG neurones, and if the subunits do co-assemble with SK3, our results show that their presence does not seem to greatly affect those properties of the channels that we have examined.
Our work adds to the considerable progress that is now being made in relating cloned SK channels to their native counterparts. It appears likely that the SK4 gene (also referred to as IK1) is responsible for the charybdotoxin-sensitive potassium channels in red blood cells and T lymphocytes (Logsdon et al. 1997; Jensen et al. 1998; Vandorpe et al. 1998; Khanna et al. 1999). In the Jurkat cell line, SK2 mediates the apamin-sensitive currents (Jäger et al. 2000), as in cochlear hair cells (Dulon et al. 1998). In cultured and denervated skeletal muscle it has been found that the native SK channels correspond to homomultimers of SK3 (Pribnow et al. 1999).
Though in the present study the primary comparison is between the pharmacology of the rat SCG AHP and that of heterologously expressed rat SK3 channels, two of the compounds used (dequalinium and UCL 1530) have previously been tested for their blocking action on isolated SCG neurones prepared from adult guinea-pigs (Dunn et al. 1996). The potencies observed were similar to those seen with rat tissue, suggesting that guinea-pig SCG neurones also express SK3 channels. Similarly, in bullfrog sympathetic neurones (Goh et al. 1992), the slow component of the AHP is blocked by scyllatoxin with an IC50 of 7.5 nm, which is of the same order as that seen in the present work (11.4 nm in SCG; 8.3 nm with expressed SK3), again suggesting the involvement of SK3 channels. Further, while our preliminary report provided the first evidence for a role of SK3 in neuronal AHPs (Hosseini et al. 1999), recent work by Pedarzani et al. (2000) suggests a similar function for the channel in dorsal vagal neurones. Thus, SK3 channels may be important in the control of the excitability of several kinds of neurone. However, it is interesting that the sympathetic ganglion cells studied in the present work appear to be quite different from hippocampal pyramidal neurones, where the apamin-sensitive AHP is probably mediated by SK1 and/or SK2 channels (Stocker et al. 1999). These differences are likely to be important for the regulation of neuronal activity and also for therapeutic strategies targeting the SK channel family in neurones.
Acknowledgments
This work was supported by the MRC and the Wellcome Trust. We are grateful to Dr W. J. Joiner and Professor L. K. Kaczmarek for generously supplying both the SK2 clone and cell line and for help in constructing the SK3 cell lines. We also thank Dr D. G. Haylett and Dr Mala Shah for many helpful discussions. D.H.J. thanks the Leverhulme Trust for the award of a Fellowship.
References
- Barfod ET, Moore AL, Lidofsky SD. Cloning and functional expression of a liver isoform of the small conductance Ca2+-activated K+ channel SK3. American Journal of Physiology - Cell Physiology. 2001;280:C836–842. doi: 10.1152/ajpcell.2001.280.4.C836. [DOI] [PubMed] [Google Scholar]
- Benton DCH, Dunn PM, Chen JQ, Galanakis D, Ganellin CR, Malik-Hall M, Shah M, Haylett DG, Jenkinson DH. UCL 1848: A novel bis-quinolinium cyclophane which blocks apamin-sensitive K+ channels with nanomolar affinity. British Journal of Pharmacology. 1999;128:P39. [Google Scholar]
- Blackman JG, Ginsborg BL, Ray C. Some effects of changes in ionic concentration on the action potential of sympathetic ganglion cells in the frog. Journal of Physiology. 1963;167:374–388. doi: 10.1113/jphysiol.1963.sp007156. [DOI] [PMC free article] [PubMed] [Google Scholar]
- Bond CT, Sprengel R, Bissonnette JM, Kaufmann WA, Pribnow D, Neelands T, Storck T, Baetscher M, Jerecic J, Maylie J, Knaus HG, Seeburg PH, Adelman JP. Respiration and parturition affected by conditional overexpression of the Ca2+-activated K+ channel subunit, SK3. Science. 2000;289:1942–1946. doi: 10.1126/science.289.5486.1942. [DOI] [PubMed] [Google Scholar]
- Burgess GM, Claret M, Jenkinson DH. Effects of quinine and apamin on the calcium-dependent potassium permeability of mammalian hepatocytes and red cells. Journal of Physiology. 1981;317:67–90. doi: 10.1113/jphysiol.1981.sp013814. [DOI] [PMC free article] [PubMed] [Google Scholar]
- Campos Rosa J, Galanakis D, Ganellin CR, Dunn PM, Jenkinson DH. Bis-quinolinium cyclophanes: 6,10-diaza-3(1,3),8(1,4)-dibenzena-1,5(1,4)-diquinolinacyclodecaphane (UCL 1684), the first nanomolar, non-peptidic blocker of the apamin-sensitive Ca2+-activated K+ channel. Journal of Medicinal Chemistry. 1998;41:2–5. doi: 10.1021/jm970571a. [DOI] [PubMed] [Google Scholar]
- Campos Rosa J, Galanakis D, Piergentili A, Bhandari K, Ganellin CR, Dunn PM, Jenkinson DH. Synthesis, molecular modeling, and pharmacological testing of bis-quinolinium cyclophanes: potent, non-peptidic blockers of the apamin-sensitive Ca2+-activated K+ channel. Journal of Medicinal Chemistry. 2000;43:420–431. doi: 10.1021/jm9902537. [DOI] [PubMed] [Google Scholar]
- Castle NA. Perspectives in Drug Discovery and Design. 15/16. 1999. Recent advances in the biology of small conductance calcium-activated potassium channels; pp. 131–154. [Google Scholar]
- Chandy KG, Fantino E, Wittekindt O, Kalman K, Tong LL, Ho TH, Gutman GA, Crocq MA, Ganguli R, Nimgaonkar V, Morrisrosendahl DJ, Gargus JJ. Isolation of a novel potassium channel gene hSKCa3 containing a polymorphic CAG repeat: a candidate for schizophrenia and bipolar disorder. Molecular Psychiatry. 1998;3:32–37. doi: 10.1038/sj.mp.4000353. [DOI] [PubMed] [Google Scholar]
- Chomczynski P, Sacchi N. Single-step method of RNA isolation by acid guanidinium thiocyanate phenol chloroform extraction. Analytical Biochemistry. 1987;162:156–159. doi: 10.1006/abio.1987.9999. [DOI] [PubMed] [Google Scholar]
- Colquhoun D, Rang HP, Ritchie JM. The binding of tetrodotoxin and α-bungarotoxin to normal and denervated mammalian muscle. Journal of Physiology. 1974;240:199–226. doi: 10.1113/jphysiol.1974.sp010607. [DOI] [PMC free article] [PubMed] [Google Scholar]
- Cook NS, Haylett DG. Effects of apamin, quinine and neuromuscular blockers on calcium-activated potassium channels in guinea-pig hepatocytes. Journal of Physiology. 1985;358:373–394. doi: 10.1113/jphysiol.1985.sp015556. [DOI] [PMC free article] [PubMed] [Google Scholar]
- Dulon D, Luo L, Zhang C, Ryan AF. Expression of small-conductance calcium-activated potassium channels (SK) in outer hair cells of the rat cochlea. European Journal of Neuroscience. 1998;10:907–915. doi: 10.1046/j.1460-9568.1998.00098.x. [DOI] [PubMed] [Google Scholar]
- Dunn PM. Dequalinium, a selective blocker of the slow afterhyperpolarization in rat sympathetic neurons in culture. European Journal of Pharmacology. 1994;252:189–194. doi: 10.1016/0014-2999(94)90596-7. [DOI] [PubMed] [Google Scholar]
- Dunn PM. UCL1684: a potent blocker of Ca2+-activated K+ channels in rat adrenal chromaffin cells in culture. European Journal of Pharmacology. 1999;368:119–123. doi: 10.1016/s0014-2999(99)00029-1. [DOI] [PubMed] [Google Scholar]
- Dunn PM, Benton DCH, Campos Rosa J, Ganellin CR, Jenkinson DH. Discrimination between subtypes of apamin-sensitive Ca2+-activated K+ channels by gallamine and a novel bis-quaternary quinolinium cyclophane, UCL 1530. British Journal of Pharmacology. 1996;117:35–42. doi: 10.1111/j.1476-5381.1996.tb15151.x. [DOI] [PMC free article] [PubMed] [Google Scholar]
- Goh JW, Kelly ME, Pennefather PS, Chicchi GG, Cascieri MA, Garcia ML, Kaczorowski GJ. Effect of charybdotoxin and leiurotoxin I on potassium currents in bullfrog sympathetic ganglion and hippocampal neurons. Brain Research. 1992;591:165–170. doi: 10.1016/0006-8993(92)90992-i. [DOI] [PubMed] [Google Scholar]
- Grunnet M, Jensen BS, Olesen SP, Klaerke DA. Apamin interacts with all subtypes of cloned small-conductance Ca2+-activated K+ channels. Pflügers Archiv. 2001;441:544–550. doi: 10.1007/s004240000447. [DOI] [PubMed] [Google Scholar]
- Haylett DG, Jenkinson DH. Calcium-activated potassium channels. In: Cook NS, editor. Potassium Channels. Chichester: Ellis Horwood; 1990. pp. 70–95. [Google Scholar]
- Hosseini R, Benton DCH, Haylett DG, Moss GWJ. Cloning of an SK channel from rat sympathetic neurones. Journal of Physiology. 1999;518P:122P. [Google Scholar]
- Imbert G, Saudou F, Yvert G, Devys D, Trottier Y, Garnier JM, Weber C, Mandel JL, Cancel G, Abbas N, Durr A, Didierjean O, Stevanin G, Agid Y, Brice A. Cloning of the gene for spinocerebellar ataxia 2 reveals a locus with high sensitivity to expanded CAG/glutamine repeats. Nature Genetics. 1996;14:285–291. doi: 10.1038/ng1196-285. [DOI] [PubMed] [Google Scholar]
- Ishii TM, Maylie J, Adelman JP. Determinants of apamin and d-tubocurarine block in SK potassium channels. Journal of Biological Chemistry. 1997;272:23195–23200. doi: 10.1074/jbc.272.37.23195. [DOI] [PubMed] [Google Scholar]
- Jäger H, Adelman JP, Grissmer S. SK2 encodes the apamin-sensitive Ca2+-activated K+ channels in the human leukemic T cell line, Jurkat. FEBS Letters. 2000;469:196–202. doi: 10.1016/s0014-5793(00)01236-9. [DOI] [PubMed] [Google Scholar]
- Jensen BS, Strøbæk D, Christophersen P, Jorgensen TD, Hansen C, Silahtaroglu A, Olesen SP, Ahring PK. Characterization of the cloned human intermediate-conductance Ca2+-activated K+ channel. American Journal of Physiology. 1998;275:C848–856. doi: 10.1152/ajpcell.1998.275.3.C848. [DOI] [PubMed] [Google Scholar]
- Joiner WJ, Wang LY, Tang MD, Kaczmarek LK. hSK4, a member of a novel subfamily of calcium-activated potassium channels. Proceedings of the National Academy of Sciences of the USA. 1997;94:11013–11018. doi: 10.1073/pnas.94.20.11013. [DOI] [PMC free article] [PubMed] [Google Scholar]
- Kawai T, Watanabe M. Blockade of Ca-activated K conductance by apamin in rat sympathetic neurons. British Journal of Pharmacology. 1986;87:225–232. doi: 10.1111/j.1476-5381.1986.tb10175.x. [DOI] [PMC free article] [PubMed] [Google Scholar]
- Khanna R, Chang MC, Joiner WJ, Kaczmarek LK, Schlichter LC. hSK4/hIK1, a calmodulin-binding K-Ca channel in human T lymphocytes - Roles in proliferation and volume regulation. Journal of Biological Chemistry. 1999;274:14838–14849. doi: 10.1074/jbc.274.21.14838. [DOI] [PubMed] [Google Scholar]
- Kohler M, Hirschberg B, Bond CT, Kinzie JM, Marrion NV, Maylie J, Adelman JP. Small-conductance, calcium-activated potassium channels from mammalian brain. Science. 1996;273:1709–1714. doi: 10.1126/science.273.5282.1709. [DOI] [PubMed] [Google Scholar]
- Kozak M. An analysis of 5′-noncoding sequences from 699 vertebrate messenger RNAs. Nucleic Acids Research. 1987;15:8125–8148. doi: 10.1093/nar/15.20.8125. [DOI] [PMC free article] [PubMed] [Google Scholar]
- Logsdon NJ, Kang JS, Togo JA, Christian EP, Aiyar J. A novel gene, hKCa4, encodes the calcium-activated potassium channel in human T lymphocytes. Journal of Biological Chemistry. 1997;272:32723–32726. doi: 10.1074/jbc.272.52.32723. [DOI] [PubMed] [Google Scholar]
- Lüscher C, Streit J, Lipp P, Lüscher HR. Action-potential propagation through embryonic dorsal-root ganglion-cells in culture. 2. Decrease of conduction reliability during repetitive stimulation. Journal of Neurophysiology. 1994;72:634–643. doi: 10.1152/jn.1994.72.2.634. [DOI] [PubMed] [Google Scholar]
- McAfee DA, Yarowsky PT. Calcium-dependent potentials in the mammalian sympathetic neurone. Journal of Physiology. 1979;290:507–523. doi: 10.1113/jphysiol.1979.sp012787. [DOI] [PMC free article] [PubMed] [Google Scholar]
- Malik-Hall M, Ganellin CR, Galanakis D, Jenkinson DH. Compounds that block both intermediate-conductance (IKCa) and small-conductance (SKCa) calcium-activated potassium channels. British Journal of Pharmacology. 2000;129:1431–1438. doi: 10.1038/sj.bjp.0703233. [DOI] [PMC free article] [PubMed] [Google Scholar]
- Martell AE, Smith RM. Critical Stability Constants. III. New York: Plenum Press; 1974. p. 199. [Google Scholar]
- Pedarzani P, Kulik A, Muller M, Ballanyi K, Stocker M. Molecular determinants of Ca2+-dependent K+ channel function in rat dorsal vagal neurones. Journal of Physiology. 2000;527:283–290. doi: 10.1111/j.1469-7793.2000.t01-1-00283.x. [DOI] [PMC free article] [PubMed] [Google Scholar]
- Pribnow D, Johnson-Pais T, Bond CT, Keen J, Johnson RA, Janowsky A, Silvia C, Thayer M, Maylie J, Adelman JP. Skeletal muscle and small-conductance calcium-activated potassium channels. Muscle and Nerve. 1999;22:742–750. doi: 10.1002/(sici)1097-4598(199906)22:6<742::aid-mus11>3.0.co;2-1. [DOI] [PubMed] [Google Scholar]
- Sah P. Ca2+-activated K+ currents in neurones: Types, physiological roles and modulation. Trends in Neurosciences. 1996;19:150–154. doi: 10.1016/s0166-2236(96)80026-9. [DOI] [PubMed] [Google Scholar]
- Sah P, Davies P. Calcium-activated potassium currents in mammalian neurons. Clinical and Experimental Pharmacology and Physiology. 2000;27:657–663. doi: 10.1046/j.1440-1681.2000.03317.x. [DOI] [PubMed] [Google Scholar]
- Selyanko AA. Single apamin-sensitive, small conductance calcium-activated potassium channels (SKCa) in membrane patches from rat sympathetic neurones. Journal of Physiology. 1996;494.P:52P. [Google Scholar]
- Shah M, Haylett DG. The pharmacology of hSK1 Ca2+-activated K+ channels expressed in mammalian cell lines. British Journal of Pharmacology. 2000;129:627–630. doi: 10.1038/sj.bjp.0703111. [DOI] [PMC free article] [PubMed] [Google Scholar]
- Stocker M, Krause M, Pedarzani P. An apamin-sensitive Ca2+-activated K+ current in hippocampal pyramidal neurons. Proceedings of the National Academy of Sciences of the USA. 1999;96:4662–4667. doi: 10.1073/pnas.96.8.4662. [DOI] [PMC free article] [PubMed] [Google Scholar]
- Stocker M, Pedarzani P. Differential distribution of three Ca2+-activated K+ channel subunits, SK1, SK2 and SK3, in the adult rat central nervous system. Molecular and Cellular Neuroscience. 2000;15:476–493. doi: 10.1006/mcne.2000.0842. [DOI] [PubMed] [Google Scholar]
- Strøbæk D, Jorgensen TD, Christophersen P, Ahring PK, Olesen SP. Pharmacological characterization of small-conductance Ca2+-activated K+ channels stably expressed in HEK 293 cells. British Journal of Pharmacology. 2000;129:991–999. doi: 10.1038/sj.bjp.0703120. [DOI] [PMC free article] [PubMed] [Google Scholar]
- Takanashi H, Sawanobori T, Kamisaka K, Maezawa H, Hiraoka M. Ca2+-activated K+ channel is present in guinea-pig but lacking in rat hepatocytes. Japanese Journal of Physiology. 1992;42:415–430. doi: 10.2170/jjphysiol.42.415. [DOI] [PubMed] [Google Scholar]
- Vandorpe DH, Shmukler BE, Jiang LW, Lim B, Maylie J, Adelman JP, de Franceschi L, Cappellini MD, Brugnara C, Alper SL. cDNA cloning and functional characterization of the mouse Ca2+-gated K+ channel, mIK1 - Roles in regulatory volume decrease and erythroid differentiation. Journal of Biological Chemistry. 1998;273:21542–21553. doi: 10.1074/jbc.273.34.21542. [DOI] [PubMed] [Google Scholar]
- Vergara C, Latorre R, Marrion NV, Adelman JP. Calcium-activated potassium channels. Current Opinion in Neurobiology. 1998;8:321–329. doi: 10.1016/s0959-4388(98)80056-1. [DOI] [PubMed] [Google Scholar]
- Wadsworth JDF, Doorty KB, Strong PN. Comparable 30-kDa apamin binding polypeptides may fulfill equivalent roles within putative subtypes of small conductance Ca2+-activated K+ channels. Journal of Biological Chemistry. 1994;269:18053–18061. [PubMed] [Google Scholar]
- Wadsworth JDF, Torelli S, Doorty KB, Strong PN. Structural diversity among subtypes of small-conductance Ca 2+-activated potassium channels. Archives of Biochemistry and Biophysics. 1997;346:151–160. doi: 10.1006/abbi.1997.0280. [DOI] [PubMed] [Google Scholar]
- Xia XM, Fakler B, Rivard A, Wayman G, Johnsonpais T, Keen JE, Ishii T, Hirschberg B, Bond CT, Lutsenko S, Maylie J, Adelman JP. Mechanism of calcium gating in small-conductance calcium-activated potassium channels. Nature. 1998;395:503–507. doi: 10.1038/26758. [DOI] [PubMed] [Google Scholar]
- Yamashita Y, Ogawa H, Akaike N. ATP-induced rise in apamin-sensitive Ca2+-dependent K+ conductance in adult rat hepatocytes. American Journal of Physiology. 1996;270:G307–313. doi: 10.1152/ajpgi.1996.270.2.G307. [DOI] [PubMed] [Google Scholar]


