

Abstract
The suction pipette technique was combined with laser spot fluorescence microscopy to record simultaneously odour-induced current responses and intraciliary Ca2+ concentration from isolated salamander olfactory receptor cells loaded with the fluorescent Ca2+ indicator fluo-3.
When exposed for 1 s to increasing odour concentrations both the suction pipette current and fluo-3 fluorescence increased dynamically, rising with a similar time course. Thereafter, the fluorescence signal decayed more slowly, outlasting the current response by 0.56 ± 0.12 s.
The fluo-3 fluorescence evoked by progressively increasing odour concentrations varied in an approximately linear manner with the magnitude of the suction pipette current.
Prolonged odour stimulation evoked synchronous oscillations in both suction pipette current and intraciliary calcium concentration with a mean period of 4.5 ± 0.3 s.
When external Na+ was omitted from the stimulating solution the oscillation period for both the current and fluorescence signals was lengthened by a factor of 1.9 ± 0.2 in comparison with the oscillation period when stimulated in Ringer solution.
These results support the currently accepted mechanism for Ca2+ homeostasis within the olfactory cilia, and are consistent with the notion that the oscillations induced by prolonged odour exposure represent the coupled oscillation of Ca2+ and cyclic nucleotide concentrations.
Signal transduction in olfactory receptor cells commences with the binding of an odour molecule to a receptor protein in the ciliary membrane, which leads to the activation of a G protein-coupled cascade and an increase in intraciliary cAMP concentration (for review see Breer, 1994; Schild & Restrepo, 1998; Gold, 1999). This opens cyclic nucleotide-gated channels, which mainly conduct Ca2+ under normal external ionic conditions (Frings et al. 1995; Dzeja et al. 1999), thereby allowing Ca2+ to enter the cilia. The ensuing increase in intraciliary Ca2+ concentration initiates two further processes. First, it opens a Ca2+-activated Cl− conductance, which carries an additional inward component of the receptor current (Kleene & Gesteland, 1991; Kurahashi & Yau, 1993; Lowe & Gold, 1993; Zhainazarov & Ache, 1995; Reuter et al. 1998), and which is believed to remain open until Ca2+ is extruded from the cilia via Na+-Ca2+ exchange (Reisert & Matthews, 1998). Second, Ca2+ has a number of negative feedback actions on the signal transduction cascade, which help to terminate the response (for review see Menini, 1999; Zufall & Leinders-Zufall, 2000). They include actions via Ca2+-calmodulin to desensitise the cyclic nucleotide-gated channel (Chen & Yau, 1994; Liu et al. 1994) and activate phosphodiesterase (Borisy et al. 1992; Yan et al. 1995), and the inhibition of adenylyl cyclase III by phosphorylation via calmodulin kinase II (Wayman et al. 1995; Wei et al. 1998; Leinders-Zufall et al. 1999).
This dual role of Ca2+ in olfactory transduction has made the measurement of odour-induced changes in intracellular Ca2+ concentration an important goal, which has been addressed by a number of investigators using Ca2+-sensitive fluorescent dyes. However, a major stumbling block has proved to be the small size of the olfactory cilia, and the consequent difficulty of obtaining a sufficiently large fluorescence signal. Therefore most reports have concentrated on changes in Ca2+ concentration in the larger cell body (see e.g. Sato et al. 1991; Hirono et al. 1992; Restrepo et al. 1993; Bozza & Kauer, 1998; Gomez et al. 2000) from which both increases and decreases in intracellular Ca2+ concentration have been observed, often with very slow kinetics outlasting stimulation by some minutes. Hitherto, only Leinders-Zufall and her colleagues have succeeded in recording odour-induced Ca2+ indicator fluorescence signals from amphibian olfactory cilia (Leinders-Zufall et al. 1998) using laser scanning confocal microscopy. In response to short, 1 s, odour stimuli they observed a fast rise in fluorescence followed by a slow decline over the next ≈5 s. However, they were unable to investigate the relationship between these Ca2+ signals and the underlying receptor current response, which was not recorded in their experiments.
In this study we have combined electrical recording from isolated olfactory receptor cells using the suction pipette technique (Baylor et al. 1979; Lowe & Gold, 1991; Reisert & Matthews, 1998) with optical recordings of Ca2+ indicator fluorescence from the cilia using a spatially precise laser spot technique (Escobar et al. 1994; Sampath et al. 1998; Matthews & Fain, 2000). This approach has enabled us to relate for the first time the receptor current response to the accompanying changes in intraciliary Ca2+ concentration evoked by both short and long odour stimuli, and to investigate the influence of ionic manipulations believed to modify the removal of Ca2+ ions from the cilia on the time course of the Ca2+ signal.
METHODS
Tissue preparation and dye loading
Terrestrial tiger salamanders (Ambystoma tigrinum) were killed by stunning, followed by decapitation and rostral and caudal pithing according to Home Office regulations. The basal olfactory epithelia were dissected and stored at 4 °C in oxygenated amphibian Ringer solution containing 10 mm glucose until required (Reisert & Matthews, 1998). To aid tissue dissociation the epithelium was first incubated for 30 min in a low-Na+, 1 μm Ca2+ solution and then mechanically dissociated in normal Ringer solution by carefully cutting the tissue with a piece of razor blade. Cells were loaded for 30 min with the Ca2+-sensitive dye fluo-3 AM (Teflabs, Austin, TX, USA) in Ringer solution that included 18 μm of the dye and 0.4 % DMSO-20 % Pluronic (Molecular Probes, Leiden, The Netherlands). Isolated cells were allowed to settle in the recording chamber for a further 30 min before excess dye was removed by commencing chamber perfusion.
Suction pipette recording
The suction pipette technique was used to record odour-induced electrical responses (Baylor et al. 1979; Lowe & Gold, 1991; Reisert & Matthews, 1999). Pipettes were pulled from soft glass haematocrit tubes (Camlab, Cambridge, UK), fire polished to an inner diameter of around 6 μm and baked at 200 °C in a Petri dish containing 15 μl tri-n-butylchlorosilane. The cell body of an isolated olfactory receptor cell was drawn into the tip of the suction pipette leaving the cilia exposed to the superfusing solution and thereby optically accessible for measurement of fluo-3 fluorescence (see Fig. 1). Suction pipettes with very thin-walled tips were used to avoid the cilia sticking to the tip of the pipette during recording. This tip geometry compromised the suction pipette recordings somewhat, since the cells were not held as tightly within the pipette as would have been the case with a thicker wall. Consequently, only a 2- to 3-fold increase in resistance was achieved when the cell was drawn into the suction pipette, and cells could change their position slightly within the tip over a period of a few minutes. Furthermore, due to the low seal resistance, exposure to low-Na+, choline solution evoked junction currents too large to be subtracted reliably, so junction current correction was not attempted. The suction pipette current was recorded with a patch clamp amplifier (Warner PC-501A, Warner Instruments, Hamden, CT, USA), digitised at 100 Hz and filtered DC to 10 Hz with an 8-pole Bessel filter (model VBF8 Mk 4, Kemo Ltd, Beckenham, UK). The data were digitised by an IBM PC-compatible microcomputer equipped with an intelligent interface card (Cambridge Research Systems, Rochester, UK). In a minority of early recordings the suction pipette current was accidentally filtered over the wider bandwidth of DC to 250 Hz. However, power spectral analysis of suction pipette recordings digitised at 1 kHz and filtered at DC to 250 Hz indicated that 85 % of the signal power fell below 50 Hz, demonstrating that little aliasing of higher frequencies will have taken place in the incorrectly filtered recordings.
Figure 1. Simultaneous measurement of intraciliary Ca2+ concentration and receptor current using laser spot fluorescence microscopy and suction pipette recording.

Schematic diagram of the experimental arrangement. The beam of an argon ion laser illuminated a pinhole and entered the inverted microscope through the epi-fluorescence port. A dichroic mirror reflected the recollimated beam through a ×40 oil-immersion objective, which formed an image of the pinhole with a diameter of 10 μm on the cilia protruding from the dendritic knob of an isolated salamander olfactory receptor cell loaded with the fluorescent Ca2+ indicator fluo-3 AM. The cell body was drawn into the orifice of a suction pipette, which not only recorded the receptor current but also held the cell in a fixed position relative to the laser spot. Movement of the cilia was constrained by a constant streamline flow of solution emerging from a manifold built into the back of the recording chamber, which delivered solution from one of seven inlet tubes. The solution superfusing the olfactory cilia was exchanged by activating one of the seven inlet tubes via computer-controlled solenoid valves, allowing odour stimulation or ionic exchanges. Ca2+-dependent fluo-3 fluorescence evoked by laser illumination passed through an emission filter and was relayed via a multimode optical fibre to the photomultiplier.
Solutions and solution changes
Amphibian Ringer solution contained 111 mm NaCl, 2.5 mm KCl, 1.6 mm MgCl2, 1 mm CaCl2, 0.01 mm EDTA, 3 mm Hepes and 10 mm glucose, and pH was adjusted to 7.7 with NaOH. Choline-substituted low-Na+ solution contained 111 mm choline chloride instead of NaCl; the pH was adjusted to 7.7 with around 2 mm NaOH. Cineole solutions were made by a single dilution from a 1 mm stock in either Ringer or low-Na+, choline solution.
Solutions were delivered through a bundle of seven plastic-coated thin-walled silica tubes mounted into a common 1 mm-square outlet built into the back of the recording chamber. Solutions were delivered by gravity at a flow of around 2 ml min−1; each of the seven perfusion lines could be controlled independently using solenoid valves (Type LFAA, The Lee Company, Westbrook, CT, USA). Solution changes were carried out by activating individual perfusion lines in turn under computer control. The time required to change the solution bathing the cilia was estimated from the junction current that accompanied the change from low-Na+, choline solution back to Ringer solution, which rose from 10-90 % in 0.3 s (average from 5 cells). This relatively gradual rise probably resulted from a poorly stirred layer of solution surrounding the cilia, since optical recording had to be performed close to the base of the recording chamber, due to the restricted working distance of the oil-immersion objective. In addition, the small dead volume between the individual tubes and their common outlet into the recording chamber resulted in an additional delay of 0.37 s between the command to the valve and the initial rise of the junction current to 10 % of its final value.
ca2+ measurements
Intraciliary Ca2+ concentration was measured using a laser spot technique, which was originally developed to record Ca2+ signals from single sarcomeres in skeletal muscle (Escobar et al. 1994) and later adapted to record light-induced changes in Ca2+ concentration from vertebrate photoreceptors (Sampath et al. 1998; Matthews & Fain, 2000). The experimental arrangement is illustrated schematically in Fig. 1. An argon ion laser (model 60, American Laser Corporation, Salt Lake City, UT, USA) illuminated a pinhole, the beam was recollimated and entered a Nikon Eclipse inverted microscope (Nikon UK, Kingston, UK) through the epi-fluorescence port via a dichroic mirror. An image of the pinhole with a diameter of 10 μm was formed using a ×40 oil-immersion objective (1.3 NA, CFI 60, Nikon UK), which had a working distance of 200 μm above the chamber floor. The spot was focused on the cilia protruding from the dendritic knob of an isolated olfactory receptor cell, whose cell body was drawn into the tip of the suction pipette. The constant flow of solution from the outlet at the back of the chamber constrained the normally motile cilia, so that a substantial proportion of them fell within the 10 μm diameter of the laser spot (Fig. 1, circle).
The fluo-3 fluorescence excited by the laser spot passed through an emission filter and was recorded with a restricted-photocathode photomultiplier (model 9130/100A, Electron Tubes Ltd, Ruislip, UK) whose output was amplified by a low-noise current to voltage converter (model PDA700, Terahertz Technology Inc., Oriskany, NY, USA). The signal was filtered over a bandwidth of DC to 10 Hz, and sampled and stored in the same way as the suction pipette current signal.
In early experiments the laser was tuned to 514 nm and the transition wavelengths of the dichroic mirror and emission filter were 525 and 530 nm, respectively (525DRLP and 530EFLP, Omega Optical Inc., Brattleboro, VA, USA). In later experiments, in an attempt to optimise the magnitude of the fluorescence signal, the laser was retuned to 488 nm and the dichroic mirror and emission filter had transition wavelengths of 505 and 510 nm, respectively (505DRLP and 510ALP, Omega Optical Inc.). Although the change to a shorter transition wavelength for the long-pass emission filter would be expected to have resulted in a larger proportion of the emitted fluorescence peak being collected, in practice no substantial increase in the fluorescence signal was observed. Laser intensities were 7.6 × 10¹¹ and 6.1 × 10¹¹ photons μm−2 s−1 at 514 and 488 nm, respectively. The ratio of the odour-induced increase in fluorescence to the pre-existing pedestal (ΔF/F) was measured from the first prolonged odour exposure that evoked an oscillatory response, to yield a value of 1.85 ± 0.26 (mean ±s.e.m., 25 cells).
It was important when comparing responses over a range of odour concentrations to avoid movement of the cilia relative to the laser spot, which most commonly resulted from slight changes in the position of the cell in the tip of the suction pipette. To minimise the effects of such drift, experiments were performed in a time-symmetrical manner using a cineole concentration sequence of (μm): 300, 100, 30, 30, 100 and 300, and corresponding sweeps were averaged. A larger range of cineole concentrations was not attempted, since it would have necessitated a longer experimental duration, thereby compromising stability.
Data analysis
The time course of the suction pipette current response and of the fluo-3 fluorescence increase evoked by odour stimulation were compared by normalising each signal to its peak amplitude. In the case of the fluo-3 signal, the pre-existing pedestal of fluorescence in the absence of odour stimulation was subtracted prior to normalisation. The pedestal was calculated as the average photomultiplier current during the 0.9 s period immediately preceding the onset of the stimulus. In order to compare the receptor current and fluorescence signals over a range of odour concentrations, their magnitudes were normalised to the values measured at the highest cineole concentration applied (normally 300 μm). Linear regression lines were fitted using a least-squares algorithm (Origin, Microcal Inc., Natick, MA, USA).
RESULTS
Responses to brief odour stimuli
The relationship between the suction pipette current response and fluo-3 fluorescence was investigated by exposing isolated salamander olfactory receptor cells for 1 s to the odour cineole. The potential problem of cell movement made it impractical to apply more than three cineole concentrations, with the consequence that a full dose-response relationship could not be recorded from any given cell. To circumvent this limitation Fig. 2 therefore compares the responses of two olfactory receptor cells, one with a low (Fig. 2A) and the other with a high (Fig. 2B) sensitivity to cineole.
Figure 2. Dose-response relationships for receptor current and fluo-3 fluorescence in response to brief odour stimulation.

Stimuli of concentration 0, 30, 100 and 300 μm cineole were delivered to a low sensitivity (A) and a high sensitivity (B) olfactory receptor cell. Upper panel, suction pipette current; lower panel, photomultiplier current evoked by fluo-3 fluorescence. Topmost traces denote laser and solution monitors. Laser shutter opened at time -1 s, evoking a basal level of fluorescence from the olfactory cilia (continuous trace is laser monitor). Odour stimuli were delivered for 1 s, nominally commencing at time zero (filled bar); flow delays retarded the actual onset of the solution change by nearly 400 ms after the nominal time of application (see Methods). Dashed lines in the lower panels denote the photomultiplier current recorded in the absence of the cilia or any other part of the cell from within the laser spot, which probably represents a small amount of back-reflected laser light that was not blocked by the emission filter. Each trace is the average of 2 responses.
The upper panels of Fig. 2 show the suction pipette currents evoked from these two cells by increasing concentrations of cineole, while the lower panels plot the corresponding fluo-3 fluorescence signals. The laser shutter was opened 1 s before the nominal onset of the odour stimulus (see upper laser monitor), evoking a constant pedestal of fluo-3 fluorescence. When the cells were exposed to cineole, nominally at time zero (filled bar; see Methods), both the suction pipette current and the fluo-3 fluorescence increased; each panel also includes a baseline trace in the absence of odour stimulation.
For the relatively insensitive cell of Fig. 2A, 30 μm cineole just reached response threshold, eliciting a small receptor current response and only a modest rise in fluo-3 fluorescence. Higher cineole concentrations of 100 and 300 μm evoked progressively larger increases in both suction pipette current and fluo-3 fluorescence, both of which reached their peak values at an earlier time after the onset of stimulation. In the more sensitive cell of Fig. 2B, even the lowest cineole concentration nearly saturated both the receptor current and fluorescence responses, higher odour concentrations leading not so much to a further increase in response amplitude as to a prolongation of the responses until later times after the termination of the odour stimulus.
Comparison of receptor current and fluorescence signals
Intraciliary Ca2+ levels are believed to be closely linked to the magnitude of the receptor current, not only since Ca2+ enters via the cyclic nucleotide-gated channels but also through its action on the Ca2+-activated Cl− conductance present in olfactory cilia. The temporal relationship between receptor current and the Ca2+ signal is compared for the same two cells in Fig. 3. Each panel shows, superimposed, the suction pipette response (thin trace) and fluo-3 fluorescence (thick trace) evoked by a given odour concentration, normalised to their peak values to facilitate comparison between the waveforms of the two signals. Responses from the insensitive cell of Fig. 2A are plotted in Fig. 3A. At the lowest concentration of 30 μm cineole these normalised traces appear quite noisy, since the cell had just attained threshold and the ensuing responses were small. Nevertheless, it can be seen that the two signals rose along a comparable trajectory and reached their peak at a similar time, whereas the falling phase of the suction pipette current slightly preceded the decline of the fluorescence signal. At the higher odour concentrations of 100 and 300 μm although both responses were larger and rose more rapidly, a similar relationship pertained between them: a near-common rising phase and a delay between the recovery of the receptor current and the decay of fluo-3 fluorescence.
Figure 3. Comparison of the time course of fluo-3 fluorescence signal and receptor current.
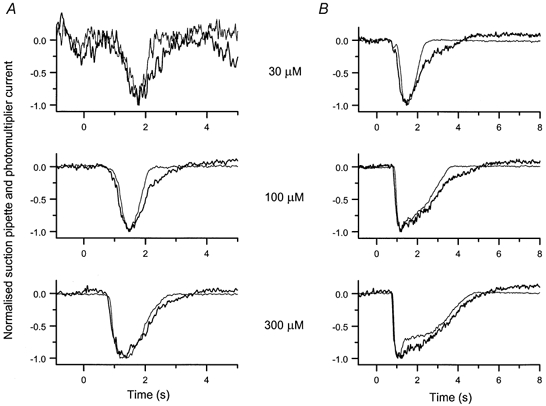
Superimposed and normalised fluo-3 fluorescence (thick trace) and suction pipette current (thin trace) responses at each cineole concentration for the cells of Fig. 2A and B (shown in A and B, respectively). Traces have been normalised to their peak values to allow comparison of their time courses. Each trace is the average of 2 responses.
These traces were analysed quantitatively by measuring the difference between the time taken for the receptor current and fluorescence signals to fall to 25 % of their peak values. In the relatively insensitive cell of Fig. 3A the decline in the fluorescence signal was prolonged by 0.28 s relative to the recovery of the receptor current when averaged across the three odour concentrations. In the more sensitive cell of Fig. 3B, from which the available range of cineole concentrations evoked responses that outlasted the 1 s odour stimulus by several seconds, a similar relationship pertained, the fluorescence signal being prolonged by an average of 0.42 s in comparison to the suction pipette current. Comparable results were obtained from a total of 14 cells, yielding an average delay between the time for recovery of the two signals to 25 % of their peak values of 0.56 ± 0.12 s (mean ±s.e.m.), a value significantly different from zero (Student's t test, 5 % level). Although in the cells of Fig. 3 the Ca2+ signal appeared to rise slightly before the receptor current, a similar comparative analysis yielded a mean lead time of 0.14 ± 0.07 s (mean ±s.e.m.), which is not significantly different from zero (Student's t test, 5 % level).
The relationship between the magnitudes of the odour-induced rise in Ca2+ concentration and the receptor current is investigated in Fig. 4, which plots the peak value of the fluorescence signal against the peak suction pipette current, each normalised to their values at the highest cineole concentration (see Methods, n = 14 cells). Despite a degree of scatter between the data from individual cells, it is clear that on odour stimulation the fluo-3 fluorescence signal rose in proportion to the increase in receptor current. The increase in fluorescence signal could be fitted with a regression line of slope 0.84 and intercept 0.16 at zero current at the time of the response peak (correlation coefficient of 0.94). This non-zero intercept may indicate that the Ca2+ concentration needs to rise significantly above its resting level in order to open the Ca2+-activated Cl− conductance.
Figure 4. Relationship between receptor current and fluo-3 fluorescence.

Normalised peak fluo-3 fluorescence signal plotted against the normalised peak suction pipette current for 14 cells, each represented by a different symbol. Pre-existing pedestal of fluorescence in the absence of odour stimulation has been subtracted before normalisation (see Methods). Filled symbols denote the cells of Fig. 2 (▪) and B (•). Data were fitted with a regression line of slope 0.84 and intercept 0.16 of the maximum evoked fluorescence at zero current using a least-squares algorithm.
Responses to prolonged odour stimuli
When exposed to odour for an extended period, olfactory receptor cells respond in an oscillatory manner with repetitive increases in receptor current, each associated with bursts of action potential firing (Frings & Lindemann, 1988; Reisert & Matthews, 2001a,b). To investigate the relationship between Ca2+ concentration and the receptor current during these oscillatory responses, olfactory receptor cells were exposed to cineole for 30 s. Results from such an experiment are shown in Fig. 5A for a cell in Ringer solution. The onset of odour stimulation evoked a large suction pipette current of around 55 pA (Fig. 5A, upper panel), which returned to the baseline within a few seconds. Thereafter the suction pipette current repeatedly rose to around 20 pA and then decayed back to zero every 2.8 s for the remaining duration of the odour stimulus. The fluo-3 fluorescence signal also increased transiently at the onset of stimulation (Fig. 5A, lower panel) but decayed more slowly than the receptor current towards a finite level greater than the original pedestal of fluorescence prior to stimulation. Subsequent repetitive increases in fluorescence were approximately in phase with the oscillatory changes in suction pipette current, each attaining about 60 % of the magnitude of the initial fluorescence peak. Comparable results were obtained from a total of 27 cells, yielding oscillation periods ranging from 2.1 to 7.4 s with a mean of 4.5 ± 0.3 s (mean ±s.e.m.). On average the fluorescence signal fell after the initial peak to 19 ± 3 % (mean ±s.e.m.) of this maximum value prior to the first of the subsequent increases (25 of the same cells used to calculate the mean oscillation period; 2 of these cells were omitted from this analysis due to high fluorescence noise). These observations indicate that intraciliary Ca2+ concentration and receptor current oscillated together during prolonged exposure to odour.
Figure 5. Oscillatory changes in receptor current and fluo-3 fluorescence in response to prolonged odour stimulation.
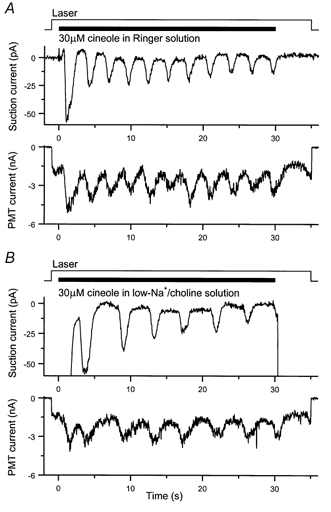
A, response of an isolated olfactory receptor cell to a 30 s exposure to 30 μm cineole in Ringer solution. Upper panel, suction pipette current; lower panel, photomultiplier (PMT) current evoked by fluo-3 fluorescence. Period of receptor current oscillation, 2.8 s. B, recordings from the same cell stimulated in a solution in which Na+ was replaced with choline. Period of receptor current oscillation, 4.3 s. The junction current accompanying the solution change from Ringer to low-Na+, choline solution has not been subtracted; the minimum level of suction pipette current following the initial peak at the onset of stimulation was assigned to zero current. Topmost traces in A and B, laser and solution monitors, denoted by the continuous trace and filled bar respectively.
In frog olfactory cilia, extrusion of Ca2+ that enters during the odour response is believed to take place principally via Na+-Ca2+ exchange (Reisert & Matthews, 1998). In order to investigate the dependence of these oscillatory changes in intraciliary Ca2+ concentration on this dominant mechanism of Ca2+ extrusion, Na+-Ca2+ exchange was incapacitated by the replacement of Na+ in the external solution by the organic cation choline, which neither permeates the cyclic nucleotide-gated channel nor supports Na+-Ca2+ exchange. Superfusion with such a low-Na+, choline solution has been shown previously to slow the odour-evoked oscillations in receptor current in frog olfactory receptor cells (Reisert & Matthews, 2001b). The influence of external Na+ on these oscillatory responses was investigated in Fig. 5B for the same cell as in Fig. 5A. Removal of Na+ from the stimulating solution resulted in a clear prolongation of the oscillation period not only for the suction pipette current (Fig. 5B, upper panel) but also for the fluo-3 fluorescence signal (Fig. 5B, lower panel). This manipulation increased the oscillation period from 2.8 to 4.25 s, corresponding to a 1.5-fold slowing of the oscillation. In contrast, when the cell was stimulated again in Ringer solution, the oscillation period shortened to 2.5 s, a value comparable to that obtained in Ringer solution at the start of the experiment. Similar effects of Na+ removal on these oscillatory responses were observed in a total of five cells, the oscillation period increasing by a factor of 1.9 ± 0.2 (mean ±s.e.m.). These observations are consistent with the notion that the extrusion of Ca2+ from the cilia plays a major role in determining the period of the oscillatory responses to prolonged odour stimulation.
DISCUSSION
By combining laser spot fluorescence measurements with suction pipette recording we have been able for the first time to compare directly the time course of odour-induced changes in fluo-3 fluorescence with that of the receptor current at high time resolution. We believe that this fluorescence signal directly reflects changes in intraciliary Ca2+ concentration for two reasons. First, the resting Ca2+ concentration within the cilia has been shown to be around 40 nm (Leinders-Zufall et al. 1997), a value well below the 400 nmKd of fluo-3 (Sampath et al. 1998). Second, the fluorescence signal was found to vary approximately linearly as a function of receptor current, with little sign of saturation at high current values (see Fig. 4). It therefore seems likely that the fluo-3 fluorescence signal provides a reasonably faithful representation of the time course and relative magnitude of changes in intraciliary Ca2+ concentration during odour stimulation.
On the time resolution of our recordings there was little evidence of a significant delay between the rise of the fluorescence and receptor current signals. This might be taken as suggesting that as soon as the cyclic nucleotide-gated channels begin to conduct Ca2+ into the cilia the Ca2+-activated Cl− conductance tracks the ensuing increase in Ca2+ concentration without delay. However, an alternative possibility is that Ca2+ might have to accumulate for a time within the cilia so as to reach a sufficiently high concentration to open the Ca2+-activated Cl− conductance. If this were the case, the apparent coincidence of the two signals might result instead from the greater proportion of current carried by the cyclic nucleotide-gated channels at early times in the response (Reisert, 1998). The latter possibility is supported by two lines of argument. First, it has been suggested that the Ca2+-activated Cl− conductance may serve to amplify the transduction signal in a non-linear manner, boosting suprathreshold responses relative to transduction noise (Lowe & Gold, 1993). Second, in excised frog olfactory cilia the Ca2+-activated Cl− conductance only begins to rise at a Ca2+ concentration of around 1 μm with a K1/2 of 5 μm (Kleene & Gesteland, 1991), although these concentrations are surprisingly high when compared to the resting Ca2+ concentration of 40 nm (Leinders-Zufall et al. 1997). This possibility is also consistent with the failure of the regression line fitted to the pooled data for fluorescence as a function of peak receptor current in Fig. 4 to pass through zero. This suggests that a threshold concentration of Ca2+ may need to be attained to yield a measurable receptor current at the time of the response peak when the cyclic nucleotide-gated channels contribute only a relatively minor proportion of the macroscopic current.
The Ca2+-activated Cl− conductance has been shown to remain open in the continued presence of Ca2+ (Kleene & Gesteland, 1991; Kleene, 1993; Hallani et al. 1998). Consequently the termination of the odour-induced response is believed to require the return of intraciliary Ca2+ concentration to resting levels, largely through Ca2+ extrusion via Na+-Ca2+ exchange (Reisert & Matthews, 1998). A consistent finding of our study was that the decay of the receptor current response took place more rapidly than the final return of the fluorescence signal to baseline levels (see Fig. 3). This observation suggests either that the Ca2+-activated Cl− conductance may be subject to some form of regulation or desensitisation during the response, or alternatively that the resting Ca2+ concentration may be lower than the threshold value required to activate this conductance. However, in our study we did not observe the very slow decay of the Ca2+ signal seen by Leinders-Zufall and her colleagues (Leinders-Zufall et al. 1998), which they reported took place over a 5 s time scale.
Olfactory receptor cells isolated from frog or mouse respond in an oscillatory manner when stimulated for extended periods (Frings & Lindemann, 1988; Reisert & Matthews, 2001a,b). The present study shows that the same is true for salamander olfactory receptor cells, although the mean oscillation period of 4.5 ± 0.3 s is shorter than the value of 6.2 ± 0.5 s in the frog (Reisert & Matthews, 2001b). We have shown previously that the current that underlies these later oscillatory responses is largely carried by the Ca2+-activated Cl− conductance, from which we inferred that Ca2+ concentration is also likely to oscillate during prolonged odour stimulation (Reisert & Matthews, 2001b). In the present study we demonstrate such oscillations in Ca2+ concentration directly (see Fig. 5).
As was the case for the responses to brief odour stimuli, the Ca2+ concentration declined more slowly following each oscillatory rise than did the receptor current. Moreover, although the receptor current declined to values close to zero between individual oscillatory current peaks, fluo-3 fluorescence did not return completely to pre-stimulus levels. This observation suggests that as the Ca2+ concentration falls any inhibitory effects of Ca2+ on the cyclic nucleotide-gated channel (Chen & Yau, 1994) or on adenylyl cyclase (Wayman et al. 1995; Wei et al. 1998; Leinders-Zufall et al. 1999) may be relieved sufficiently to allow the next oscillatory rise in receptor current to commence even without the original baseline level of Ca2+ being restored. The marked slowing of the oscillation not only in receptor current (Reisert & Matthews, 2001b) but also in fluo-3 fluorescence (see Fig. 5B) in the absence of external Na+ indicates that Na+-Ca2+ exchange plays a crucial role in determining the dynamics of intraciliary Ca2+ concentration during prolonged odour stimulation. The kinetics of such changes in Ca2+ concentration appear to dominate the period of oscillation, lending further support to the notion that these oscillations may result from the coupled variation of both Ca2+ and cyclic nucleotide concentrations (Cooper et al. 1995; Reisert & Matthews, 2001b).
Acknowledgments
This work was supported by the Wellcome Trust.
References
- Baylor DA, Lamb TD, Yau K-Y. The membrane current of single rod outer segments. Journal of Physiology. 1979;288:589–611. [PMC free article] [PubMed] [Google Scholar]
- Borisy FF, Ronnett GV, Cunningham AM, Juilfs D, Beavo J, Snyder SH. Calcium/calmodulin-activated phosphodiesterase expressed in olfactory receptor neurons. Journal of Neuroscience. 1992;12:915–923. doi: 10.1523/JNEUROSCI.12-03-00915.1992. [DOI] [PMC free article] [PubMed] [Google Scholar]
- Bozza TC, Kauer JS. Odorant response properties of convergent olfactory receptor neurons. Journal of Neuroscience. 1998;18:4560–4569. doi: 10.1523/JNEUROSCI.18-12-04560.1998. [DOI] [PMC free article] [PubMed] [Google Scholar]
- Breer H. Odor recognition and second messenger signaling in olfactory receptor neurons. Seminars in Cell Biology. 1994;5:25–32. doi: 10.1006/scel.1994.1004. [DOI] [PubMed] [Google Scholar]
- Chen T-Y, Yau K-W. Direct modulation by Ca2+-calmodulin of cyclic nucleotide-activated channel of rat olfactory receptor neurons. Nature. 1994;368:545–548. doi: 10.1038/368545a0. [DOI] [PubMed] [Google Scholar]
- Cooper DMF, Mons N, Karpen JW. Adenylyl cyclases and the interaction between calcium and cAMP signaling. Nature. 1995;374:421–424. doi: 10.1038/374421a0. [DOI] [PubMed] [Google Scholar]
- Dzeja C, Hagen V, Kaupp UB, Frings S. Ca2+ permeation in cyclic nucleotide-gated channels. EMBO Journal. 1999;18:131–144. doi: 10.1093/emboj/18.1.131. [DOI] [PMC free article] [PubMed] [Google Scholar]
- Escobar AL, Monck JR, Fernandez JM, Vergara JL. Localization of the site of Ca2+ release at the level of a single sarcomere in skeletal muscle fibres. Nature. 1994;367:739–741. doi: 10.1038/367739a0. [DOI] [PubMed] [Google Scholar]
- Frings S, Lindemann B. Odorant response of isolated olfactory receptor cells is blocked by amiloride. Journal of Membrane Biology. 1988;105:233–243. doi: 10.1007/BF01871000. [DOI] [PubMed] [Google Scholar]
- Frings S, Seifert R, Godde M, Kaupp UB. Profoundly different calcium permeation and blockage determine the specific function of distinct cyclic nucleotide-gated channels. Neuron. 1995;15:169–179. doi: 10.1016/0896-6273(95)90074-8. [DOI] [PubMed] [Google Scholar]
- Gold GH. Controversial issues in vertebrate olfactory transduction. Annual Review of Physiology. 1999;61:857–871. doi: 10.1146/annurev.physiol.61.1.857. [DOI] [PubMed] [Google Scholar]
- Gomez G, Rawson NE, Hahn CG, Michaels R, Restrepo D. Characteristics of odorant elicited calcium changes in cultured human olfactory neurons. Journal of Neuroscience Research. 2000;62:737–749. doi: 10.1002/1097-4547(20001201)62:5<737::AID-JNR14>3.0.CO;2-A. [DOI] [PubMed] [Google Scholar]
- Hallani M, Lynch JW, Barry PH. Characterization of calcium-activated chloride channels in patches excised from the dendritic knob of mammalian olfactory receptor neurons. Journal of Membrane Biology. 1998;161:163–171. doi: 10.1007/s002329900323. [DOI] [PubMed] [Google Scholar]
- Hirono J, Sato T, Tonoike M, Takebayashi M. Simultaneous recording of Cai2+ increases in isolated olfactory receptor neurons retaining their original spatial relationship in intact tissue. Journal of Neuroscience Methods. 1992;42:185–194. doi: 10.1016/0165-0270(92)90098-x. [DOI] [PubMed] [Google Scholar]
- Kleene SJ. Origin of the chloride current in olfactory transduction. Neuron. 1993;11:123–132. doi: 10.1016/0896-6273(93)90276-w. [DOI] [PubMed] [Google Scholar]
- Kleene SJ, Gesteland RC. Calcium-activated chloride conductance in frog olfactory cilia. Journal of Neuroscience. 1991;11:3624–3629. doi: 10.1523/JNEUROSCI.11-11-03624.1991. [DOI] [PMC free article] [PubMed] [Google Scholar]
- Kurahashi T, Yau K-W. Co-existence of cationic and chloride components in odorant-induced current of vertebrate olfactory receptor cells. Nature. 1993;363:71–74. doi: 10.1038/363071a0. [DOI] [PubMed] [Google Scholar]
- Leinders-Zufall T, Greer CA, Shepherd GM, Zufall F. Imaging odor-induced calcium transients in single olfactory cilia: Specificity of activation and role in transduction. Journal of Neuroscience. 1998;18:5630–5639. doi: 10.1523/JNEUROSCI.18-15-05630.1998. [DOI] [PMC free article] [PubMed] [Google Scholar]
- Leinders-Zufall T, Ma M, Zufall F. Impaired odor adaptation in olfactory receptor neurons after inhibition of Ca2+/calmodulin kinase II. Journal of Neuroscience. 1999;RC19:1–6. doi: 10.1523/JNEUROSCI.19-14-j0005.1999. [DOI] [PMC free article] [PubMed] [Google Scholar]
- Leinders-Zufall T, Rand MN, Shepherd GM, Greer CA, Zufall F. Calcium entry through cyclic nucleotide-gated channels in individual cilia of olfactory receptor cells: Spatiotemporal dynamics. Journal of Neuroscience. 1997;17:4136–4148. doi: 10.1523/JNEUROSCI.17-11-04136.1997. [DOI] [PMC free article] [PubMed] [Google Scholar]
- Liu MY, Chen TY, Ahamed B, Li J, Yau K-W. Calcium-calmodulin modulation of the olfactory cyclic nucleotide-gated cation channel. Science. 1994;266:1348–1354. doi: 10.1126/science.266.5189.1348. [DOI] [PubMed] [Google Scholar]
- Lowe G, Gold GH. The spatial distributions of odorant sensitivity and odorant-induced currents in salamander olfactory receptor cells. Journal of Physiology. 1991;442:147–168. doi: 10.1113/jphysiol.1991.sp018787. [DOI] [PMC free article] [PubMed] [Google Scholar]
- Lowe G, Gold GH. Nonlinear amplification by calcium-dependent chloride channels in olfactory receptor cells. Nature. 1993;366:283–286. doi: 10.1038/366283a0. [DOI] [PubMed] [Google Scholar]
- Matthews HR, Fain GL. Laser spot confocal technique to measure cytoplasmic calcium concentration in photoreceptors. Methods in Enzymology. 2000;316:146–163. doi: 10.1016/s0076-6879(00)16722-9. [DOI] [PubMed] [Google Scholar]
- Menini A. Calcium signalling and regulation in olfactory neurons. Current Opinion in Neurobiology. 1999;9:419–426. doi: 10.1016/S0959-4388(99)80063-4. [DOI] [PubMed] [Google Scholar]
- Reisert J. Cambridge University; 1998. Transduction and adaptation in vertebrate olfactory receptor cells. PhD Thesis. [Google Scholar]
- Reisert J, Matthews HR. Na+-dependent Ca2+ extrusion governs response recovery in frog olfactory receptor cells. Journal of General Physiology. 1998;112:529–535. doi: 10.1085/jgp.112.5.529. [DOI] [PMC free article] [PubMed] [Google Scholar]
- Reisert J, Matthews HR. Adaptation of the odour-induced response in frog olfactory receptor cells. Journal of Physiology. 1999;519:801–813. doi: 10.1111/j.1469-7793.1999.0801n.x. [DOI] [PMC free article] [PubMed] [Google Scholar]
- Reisert J, Matthews HR. Response properties of isolated mouse olfactory receptor cells. Journal of Physiology. 2001a;530:113–122. doi: 10.1111/j.1469-7793.2001.0113m.x. [DOI] [PMC free article] [PubMed] [Google Scholar]
- Reisert J, Matthews HR. Responses to prolonged odour stimulation in frog olfactory receptor cells. Journal of Physiology. 2001b;534:179–191. doi: 10.1111/j.1469-7793.2001.t01-1-00179.x. [DOI] [PMC free article] [PubMed] [Google Scholar]
- Restrepo D, Okada Y, Teeter JH, Lowry LD, Cowart B, Brand JG. Human olfactory neurons respond to odor stimuli with an increase in cytoplasmic Ca2+ Biophysical Journal. 1993;64:1961–1966. doi: 10.1016/S0006-3495(93)81565-0. [DOI] [PMC free article] [PubMed] [Google Scholar]
- Reuter D, Zierold K, Schröder WH, Frings S. A depolarizing chloride current contributes to chemoelectrical transduction in olfactory sensory neurons in situ. Journal of Neuroscience. 1998;18:6623–6630. doi: 10.1523/JNEUROSCI.18-17-06623.1998. [DOI] [PMC free article] [PubMed] [Google Scholar]
- Sampath AP, Matthews HR, Cornwall MC, Fain GL. Bleached pigment produces a maintained decrease in outer segment Ca2+ in salamander rods. Journal of General Physiology. 1998;111:53–64. doi: 10.1085/jgp.111.1.53. [DOI] [PMC free article] [PubMed] [Google Scholar]
- Sato T, Hirono J, Tonoike M, Takebayashi M. Two types of increases in free Ca2+ evoked by odor in isolated frog olfactory receptor neurons. NeuroReport. 1991;2:229–232. doi: 10.1097/00001756-199105000-00003. [DOI] [PubMed] [Google Scholar]
- Schild D, Restrepo D. Transduction mechanisms in vertebrate olfactory receptor cells. Physiological Reviews. 1998;78:429–466. doi: 10.1152/physrev.1998.78.2.429. [DOI] [PubMed] [Google Scholar]
- Wayman GA, Impey S, Storm DR. Ca2+ inhibition of type III adenylyl cyclase in vivo. Journal of Biological Chemistry. 1995;270:21480–21486. doi: 10.1074/jbc.270.37.21480. [DOI] [PubMed] [Google Scholar]
- Wei J, Zhao AZ, Chan GCK, Baker LP, Impey S, Beavo JA, Storm DR. Phosphorylation and inhibition of olfactory adenylyl cyclase by CaM kinase II in neurons: a mechanism for attenuation of olfactory signals. Neuron. 1998;21:495–504. doi: 10.1016/s0896-6273(00)80561-9. [DOI] [PubMed] [Google Scholar]
- Yan C, Zhao AZ, Bentley JK, Loughney K, Ferguson K, Beavo JA. Molecular cloning and characterization of a calmodulin-dependent phosphodiesterase enriched in olfactory sensory neurons. Proceedings of the National Academy of Sciences of the USA. 1995;92:9677–9681. doi: 10.1073/pnas.92.21.9677. [DOI] [PMC free article] [PubMed] [Google Scholar]
- Zhainazarov AB, Ache BW. Odor-induced currents in Xenopus olfactory receptor cells measured with perforated-patch recording. Journal of Neurophysiology. 1995;74:479–483. doi: 10.1152/jn.1995.74.1.479. [DOI] [PubMed] [Google Scholar]
- Zufall F, Leinders-Zufall T. The cellular and molecular basis of odor adaptation. Chemical Senses. 2000;25:473–481. doi: 10.1093/chemse/25.4.473. [DOI] [PubMed] [Google Scholar]