

Abstract
HCO3− secretion was investigated in interlobular duct segments isolated from guinea-pig pancreas using a semi-quantitative fluorometric method. Secretagogue-induced decreases in intracellular pH, following blockade of basolateral HCO3− uptake with a combination of amiloride and DIDS, were measured using the pH-sensitive fluoroprobe BCECF. Apparent secretory HCO3− fluxes were calculated from the initial rate of intracellular acidification.
In the presence of HCO3−, stimulation with secretin (10 nm) or forskolin (5 μm) more than doubled the rate of intracellular acidification. This effect was abolished in the absence of HCO3−. It was also abolished in the presence of HCO3− when DIDS and NPPB were applied to the luminal membrane by microperfusion. We therefore conclude that the increase in acidification rate is a useful index of secretagogue-induced HCO3− secretion across the luminal membrane.
Secretin, cholecystokinin (CCK) and bombesin each stimulated HCO3− secretion in a dose-dependent fashion. They evoked comparable maximal responses at about 10 nm and the EC50 values were 0.5 nm for secretin, 0.2 nm for CCK and 30 pm for bombesin. Acetylcholine (ACh) was also effective, with a maximum effect at 10 μm.
The stimulatory effect of CCK was blocked completely by the CCK1 receptor antagonist devazepide but not by the CCK2 receptor antagonist L365,260. The CCK analogue JMV-180 (Boc-Tyr(SO3H)-Nle-Gly-Trp-Nle-Asp-phenylethyl ester), which is an agonist of the high-affinity CCK1 receptor but an antagonist of the low-affinity receptor, also stimulated HCO3− secretion but with a smaller maximal effect than CCK. JMV-180 partially inhibited the response to a high concentration of CCK but not to a lower concentration, suggesting that both high- and low-affinity states of the CCK1 receptor evoke HCO3− secretion.
The stimulatory effect of bombesin was blocked completely by the gastrin-releasing peptide (GRP) receptor antagonist d-Phe6-bombesin(6-13)-methyl ester (BME) but not by the neuromedin B (NMB) receptor antagonist d-Nal-cyclo[Cys-Tyr-d-Trp-Orn-Val-Cys]-Nal-NH2 (BIM-23127).
Secretagogue-evoked fluid secretion was also examined using video microscopy to measure the rate of swelling of ducts whose ends had sealed during overnight culture. Secretin, CCK, bombesin and ACh all evoked fluid secretion with maximal rates of approximately 0.6 nl min−1 mm−2, and with concentration dependences similar to those obtained for HCO3− secretion.
We conclude that CCK, bombesin and ACh stimulate the secretion of a HCO3−-rich fluid by direct actions on the interlobular ducts of the guinea-pig pancreas and that these responses are mediated by CCK1 receptors, GRP receptors and muscarinic cholinoceptors, respectively.
Our knowledge of the site of production of HCO3−-rich pancreatic juice and the mechanisms responsible for regulating its secretion are derived largely from in vivo studies in a variety of species, supplemented by observations in perfused glands and, more recently, in isolated pancreatic ducts. These studies, which have been summarised elsewhere (Case & Argent, 1993), present a confusing picture, partly because of genuine species variations and partly because of differences between in vivo and in vitro observations. Thus, while secretin undoubtedly evokes a HCO3−-rich fluid secretion from the ducts of all species studied, the effects of other stimuli on fluid secretion vary greatly and their sites of action, whether ducts or acini, are usually unclear. For example, in an in vivo study of pancreatic secretion in anaesthetised guinea-pigs, cholecystokinin (CCK) was observed to evoke a copious HCO3−-rich fluid secretion but it was impossible to determine whether CCK was evoking fluid secretion from the acini or from the ducts (Padfield et al. 1989).
In order to assess the direct actions of known and potential agonists and antagonists on ductal secretion, it is clearly necessary to study their actions on ductal tissue uncontaminated by acinar tissue. Previous studies on isolated pancreatic ducts have involved the use of micropuncture techniques, either to aspirate the secreted fluid from the duct lumen for subsequent analysis (Ashton et al. 1990) or to inject a pH-sensitive fluoroprobe into the duct lumen for fluorescence imaging (Ishiguro et al. 1998). Although informative, these experiments are technically difficult and time consuming. Therefore, in the present study, we have adopted an alternative approach in which ductal HCO3− secretion and fluid secretion are measured separately using simpler methods.
Our measurements of ductal HCO3− secretion make use of the fact that the intracellular pH (pHi) depends upon the balance between HCO3− uptake across the basolateral membrane and HCO3− exit across the luminal membrane. Therefore, when basolateral HCO3− uptake is prevented, by blocking Na+-HCO3− cotransport with DIDS and Na+-H+ exchange with amiloride, pHi declines as HCO3− continues to leave the cell across the luminal membrane (Ishiguro et al. 1996). We have therefore estimated instantaneous HCO3− secretion from the initial rate of fall in pHi as measured by microfluorometry.
Our measurements of ductal fluid secretion take advantage of the fact that during overnight culture the ends of the isolated ducts seal. Therefore, when a duct is stimulated, fluid secretion into the closed luminal space causes the duct segment to swell. Fluid secretory rate can therefore be estimated from the rate of change in duct volume. As in our previous study (Ishiguro et al. 1998), duct swelling was assessed by microscopy, but in this case the increase in luminal volume was measured directly by bright-field video microscopy thus avoiding the need for microinjection of fluoroprobes.
These two methods have enabled us to study the secretory responses of isolated guinea-pig pancreatic ducts following stimulation with secretin, CCK, bombesin and acetylcholine (ACh). CCK and bombesin-like peptides are widely distributed throughout the gastrointestinal tract where they exhibit a variety of actions. In general, CCK acts through two receptor subtypes, CCK1 and CCK2, but in addition, two different states of the CCK1 receptor are recognised and referred to as high- and low-affinity, respectively (Wank, 1998; Noble et al. 1999). Bombesin-like peptides also act through two receptor subtypes, namely neuromedin B (NMB) and gastrin-releasing peptide (GRP) receptors. The actions of these two peptides are well characterised in a variety of cells and tissues including pancreatic acinar cells (Jensen, 1994). Our observations on isolated interlobular ducts described here demonstrate unequivocally that, in the guinea-pig, not only secretin but also CCK, bombesin and ACh evoke HCO3− and fluid secretion directly from the ducts.
A preliminary report of these findings has already been published (Szalmay et al. 2000).
METHODS
Animals and materials
Male tricolour guinea-pigs were obtained from Leeds University for use in Manchester, and male MD guinea-pigs from Charles River Hungary Ltd for use in Budapest. Animals weighed 300-400 g and were maintained on a normal pellet diet. All animal experiments were performed in accordance with national guidelines.
Culture media, soybean trypsin inhibitor, bovine serum albumin (BSA), porcine secretin, ACh, forskolin, 4,4′-diisothiocyanato-stilbene-2,2′-disulfonic acid (DIDS), 5-nitro-2-(3-phenylpropylamino) benzoic acid (NPPB) and amiloride were obtained from Sigma; 2′,7′-bis-(2-carboxyethyl)-5-(6)-carboxyfluorescein acetoxymethyl ester (BCECF AM) was from Molecular Probes Europe (Leiden, The Netherlands); collagenase (Type CLSPA) was from Worthington (Freehold, NJ, USA); CCK-8 (Asp-Tyr(SO3)-Met-Gly-Trp-Met-Asp-Phe-NH2) was from Research Plus Inc. (Bayonne, NJ, USA); JMV-180 was from Neosystem Laboratory (Strasbourg, France); L365,260 and devazepide (L364,718) were from Merck Sharp & Dohme Research Laboratories (Rahway, NJ, USA); Cell-Tak was from Collaborative Biomedical Products (Bedford, MA, USA); glutamine was from Research Plus Laboratories (Denville, NJ, USA); human insulin (Humulin R) was from Lilly (Gödöllö, Hungary); and dexamethasone (Oradexon) was from N.V. Organon (Oss, The Netherlands). Bombesin, d-Phe6-bombesin(6-13)-methyl ester (BME) and d-Nal-cyclo[Cys-Tyr-d-Trp-Orn-Val-Cys]-Nal-NH2 (BIM-23127; referred to as BIM) were a gift from Dr D. H. Coy (Department of Medicine, Tulane University Medical Center, New Orleans, LA, USA).
Solutions
The standard Hepes-buffered solution contained (mm): 130 NaCl, 5 KCl, 1 CaCl2, 1 MgCl2, 10 d-glucose and 10 Na-Hepes, and was equilibrated with 100 % O2. The Na+-free, Hepes-buffered solution contained equimolar N-methyl-d-glucamine (NMDG) in place of Na+. The standard HCO3−-buffered solution contained (mm): 115 NaCl, 25 NaHCO3, 5 KCl, 1 CaCl2, 1 MgCl2 and 10 d-glucose, and was equilibrated with 95 % O2 and 5 % CO2. All solutions were adjusted to pH 7.4 at 37 °C.
Isolation and culture of pancreatic ducts
Ducts were prepared as previously described in detail (Ishiguro et al. 1996). Briefly, animals were killed by cervical dislocation and the whole pancreas was removed and injected with 4 ml of a digestion buffer consisting of Dulbecco's modified Eagle's medium (DMEM) containing 40-80 U ml−1 collagenase, 400 U ml−1 hyaluronidase, 0.2 mg ml−1 soybean trypsin inhibitor (SBTI) and 2 mg ml−1 BSA. The tissue was chopped with scissors, top-gassed with 5 % CO2-95 % O2 and incubated in the digestion buffer for 30-60 min at 37 °C. The digested tissue was then washed and resuspended in DMEM containing 0.2 mg ml−1 SBTI and 30 mg ml−1 BSA. Interlobular ducts were microdissected from samples of tissue suspension under a dissecting microscope using 25-gauge hypodermic needles, and transferred to McCoy's 5A tissue culture medium supplemented with 10 % (v/v) fetal calf serum, 2 mml-glutamine, 0.15 mg ml−1 SBTI, 0.1 i.u. ml−1 human insulin and 4 μg ml−1 dexamethasone. They were cultured at 37 °C in 5 % CO2 in air overnight, during which time the ends of the ducts sealed spontaneously.
Measurement of intracellular pH
Intracellular pH was measured by microfluorometry as described in detail elsewhere (Ishiguro et al. 1996). In outline, isolated ducts were loaded with the pH-sensitive fluoroprobe BCECF by incubation in Hepes-buffered solution containing the acetoxymethyl ester BCECF AM (1-2 μm) for 10-30 min at room temperature. Individual ducts were then transferred to a temperature-controlled Perspex perfusion chamber (volume, 200 μl) mounted on the stage of a Nikon Diaphot inverted microscope and allowed to attach to a coverslip pre-coated with Cell-Tak in the base of the chamber. The chamber was perfused at 2 ml min−1 with either the Hepes- or HCO3−-buffered solution at 37 °C. A small part of the ductal epithelium was illuminated alternately at 440 and 490 nm and the fluorescence intensities (F440 and F490, respectively) were measured at 530 nm. Intracellular pH was calculated from the F490/F440 ratio using calibration data that were obtained with the nigericin-K+ method (Thomas et al. 1979).
In order to estimate secretory HCO3− flux, the ducts were first superfused for 5 or 10 min with the HCO3−-buffered solution. An agonist (or vehicle alone in control experiments) was then added to the superfusate and, after 5 or 10 min of stimulation, DIDS (0.1 mm) and amiloride (0.3 mm) were added simultaneously (in the continued presence of the agonist) to block the basolateral uptake of HCO3−. The initial rate of decrease in pHi (acidification rate) following the addition of the inhibitors was measured by linear regression (see Fig. 1A).
Figure 1. Secretin-evoked HCO3− efflux in isolated guinea-pig pancreatic ducts.
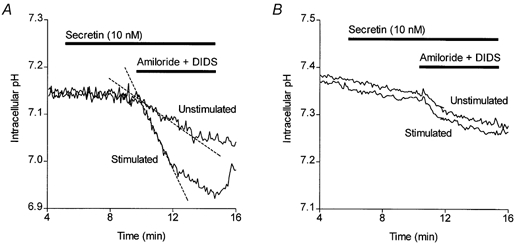
A, averaged changes in intracellular pH in isolated guinea-pig pancreatic ducts following simultaneous inhibition of basolateral Na+-H+ exchange and Na+-HCO3− cotransport with 0.3 mm amiloride and 0.1 mm DIDS, respectively. Ducts were either unstimulated throughout (n = 4) or stimulated with 10 nm secretin from 5 min (n = 4). The dashed lines show the initial slopes of the changes in pHi used to calculate the intracellular acidification rate, which was used as an index of HCO3− secretion. B, averaged data from similar experiments performed in nominally HCO3−-free, Hepes-buffered solutions (n = 5).
Measurement of intracellular buffering capacity
Intrinsic intracellular buffering capacity (βi) was measured as a function of pHi according to the method of Weintraub & Machen (1989). Ducts were first superfused with the Na+-free, Hepes-buffered solution for 30 min and then exposed to stepwise increases and decreases in NH4Cl concentration (5, 10, 20, 10 and 5 mm). The changes in pHi caused by the stepped changes in [NH4+]o, and the corresponding changes in [NH4+]i (calculated from pHi assuming that the pKa of NH4+ was 8.9), were used to estimate the value of βi at the mid-point of each pH interval:
Measurements of βi at higher pHi values were obtained in the normal Hepes-buffered solution using trimethylamine (TMA+, pKa = 9.4) in place of NH4+ (Szatkowski & Thomas, 1989). The pooled NH4+ and TMA+ data for βi were averaged over 0.2 pH unit bins, plotted as a function of pHi and fitted with a polynomial curve. The predicted total buffering capacity (βt) in the presence of HCO3−/CO2 was calculated using:
(Weintraub & Machen, 1989). Apparent HCO3− fluxes could then be calculated from the pHi measurements obtained in the experiments described above by multiplying the rate of change of pHi by the appropriate value of βt.
Microperfusion of isolated interlobular ducts
Luminal microperfusion of isolated interlobular ducts was performed using a modification (Ishiguro et al. 1999) of the method originally developed for electrophysiological studies of rat pancreatic ducts (Novak & Greger, 1988a, b). After overnight culture, the ends of the duct were cut open using 25-gauge hypodermic needles and the ductal epithelial cells were loaded with BCECF as described above. The duct was then transferred to a temperature-controlled Perspex perfusion chamber, mounted on the stage of a Nikon Diaphot inverted microscope, for simultaneous luminal perfusion and measurement of pHi. One end of the duct was gently aspirated into a holding pipette with a tip diameter of 120 μm and a recessed constriction. A concentric perfusion pipette (tip diameter, 10-20 μm) was then advanced into the duct lumen. The other end of the duct was anchored to the glass coverslip at the base of the chamber using Cell-Tak adhesive.
The duct lumen was perfused at a flow rate of 10-20 μl min−1 using an exchange pipette (fused silica capillary; o.d., 440 μm; i.d., 320 μm; Polymicro Technologies Inc., Phoenix, AZ, USA) which was inserted into the shank of the perfusion pipette. Pressurised nitrogen gas was applied to the reservoirs supplying the luminal perfusion solutions, and a steady flow of perfusate, via a waste line from the back of the perfusion pipette to a reservoir located approximately 1 m above the chamber, allowed rapid changes of luminal fluid composition. The elongated perfusion chamber was perfused at 3 ml min−1 in the same direction as the flow of luminal perfusate. This was sufficient to sweep away the luminal perfusate emerging from the open end of the duct, thus preventing access of luminally applied transport inhibitors to the outer surface of the duct. Intracellular pH was measured by microfluorometry as described above.
Measurement of fluid secretion
Fluid secretion into the closed luminal space of ducts cultured overnight was analysed by video microscopy (Steward et al. 1998). Briefly, ducts were mounted in a temperature-controlled Perspex perfusion chamber on the stage of a Nikon TMS inverted microscope. Bright-field images of a group of ducts were acquired at 1- or 2-min intervals using a CCD camera (model 902A, Watec Corp., Las Vegas, NV, USA or model 4913, Cohu Inc., San Diego, CA, USA) connected to the frame-grabber board (LG-3, Scion Corp., Frederick, MD, USA) of a personal computer.
For the first 10 min of each experiment the ducts were superfused with the Hepes-buffered solution and then, from 10 to 30 min, with the HCO3−-buffered solution. An agonist (or vehicle alone in control experiments) was then added to the superfusate from 20 to 30 min. At the end of each experiment the ducts were exposed to a hypotonic solution (the standard Hepes-buffered solution diluted 50 % with distilled water) in order to evoke osmotic swelling of the luminal space and thus confirm that the ends of the duct were completely sealed. Data from the few ducts that did not show a normal swelling response to the hypotonic challenge were discarded.
Digital images of the ducts were analysed by using Scion Image software (Scion Corp.) to measure the area corresponding to the luminal space in each image. Luminal area measurements from individual images were normalised to the mean of the first few in the series (A0) thus giving values for the relative area (AR =A/A0). These were then converted to relative luminal volumes (VR =V/V0), assuming that the lumen was cylindrical and taking into account the relative increases in width and length in each series. The secretory rate, calculated from the rate of change of luminal volume, was divided by the luminal surface area of the epithelium and expressed in nl min−1 mm−2.
Statistical analysis
Data are presented as means ±s.e.m., where the value of n quoted is the total number of ducts. These were generally obtained from at least three different animals. Student's unpaired t tests were used for the statistical comparison of data; P < 0.05 was chosen as the limit for statistical significance. Concentration-response data were fitted with a polynomial curve using Prism software (GraphPad Software Inc, San Diego, CA, USA), which provided estimates of the EC50 and maximal response values.
RESULTS
HCO3− entry across the basolateral membrane of the guinea-pig pancreatic duct is closely coupled to HCO3− secretion across the luminal membrane. Consequently, duct cell pHi remains remarkably constant during the transition from the unstimulated state to maximal HCO3− secretion (Ishiguro et al. 1996). However, when HCO3− entry is blocked by the application of transport inhibitors, the continuing efflux of HCO3− across the luminal membrane leads to a fall in pHi as a result of the net loss of base from the cell. The initial rate of fall in pHi is therefore an index of instantaneous HCO3− efflux and we have used this measurement to investigate the physiological regulation of HCO3− secretion in isolated guinea-pig ducts.
In these experiments, the rate of HCO3− efflux was calculated from the rate of intracellular acidification following blockade of HCO3− uptake across the basolateral membrane, taking into account the intracellular buffering capacity. The underlying assumption is that, during steady-state secretion, HCO3− efflux is balanced by HCO3− uptake through Na+-H+ exchange and Na+-HCO3− cotransport and that these are totally inhibited by 0.3 mm amiloride and 0.1 mm DIDS, respectively (Ishiguro et al. 1996).
Figure 1A shows averaged data from four experiments in which pHi was measured in isolated guinea-pig ducts loaded with BCECF. As mentioned above, application of 10 nm secretin at 5 min had no effect on pHi but, when amiloride and DIDS were applied simultaneously 5 min later, the rate of intracellular acidification was markedly faster in the secretin-stimulated ducts (-0.065 ± 0.012 min−1, n = 4) than in the unstimulated control ducts (-0.017 ± 0.003 min−1, n = 4; P < 0.05).
When the experiment was repeated in the absence of HCO3− (Fig. 1B), the initial value of pHi was slightly greater than that in the presence of HCO3−, as previously observed (Ishiguro et al. 1996). Under these conditions, the intracellular acidification rate in unstimulated ducts following the application of amiloride and DIDS (-0.029 ± 0.003 min−1, n = 5) was no longer increased by secretin stimulation (-0.035 ± 0.009 min−1, n = 5; P > 0.05). This supports our hypothesis that the acidification rate measured in this way is an index of HCO3− efflux from the cell.
Intracellular buffering capacity
The acidification rate measured in these experiments depends not only on the acid and base fluxes across the plasma membrane but also on the intracellular buffering capacity, which is itself a function of pHi. In order to calculate the net flux of HCO3−, we determined the buffering capacity by measuring the changes in pHi resulting from stepped changes in the extracellular concentration of the weak bases NH3 and TMA. Figure 2A shows a typical experiment in which an isolated duct loaded with BCECF was exposed first to a Hepes-buffered solution in which Na+ was totally replaced by NMDG+. Replacement of Na+ had the effect of both lowering the initial pHi value into an appropriate range and inhibiting any Na+-dependent pH-regulatory mechanisms. NH4Cl was then added to the superfusate, initially at a concentration of 5 mm, which was then increased in two further steps to 20 mm and then reduced stepwise to zero. From the changes in measured pHi and the changes in the calculated intracellular concentration of NH4+ for each step, values of the intrinsic buffering capacity βi were determined over a range of pHi values (see Methods). To measure βi at higher values of pHi, TMA was added to the normal Hepes-buffered solution at concentrations of 5, 10 and 20 mm.
Figure 2. Intracellular buffering capacity in isolated interlobular ducts.
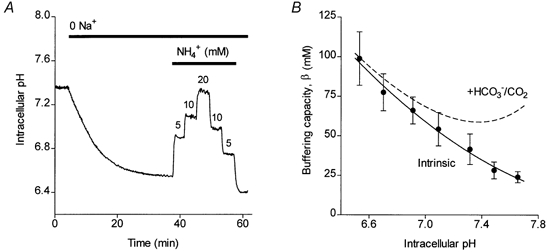
A, changes in intracellular pH in an isolated guinea-pig duct exposed first to a Na+-free Hepes-buffered solution, and then to increasing and decreasing concentrations of NH4Cl. B, intracellular buffering capacity plotted as a function of intracellular pH using data obtained from experiments of the type shown in A, and similar experiments using trimethylamine to induce step changes in pHi. Data from 26 ducts (from 6 preparations) were averaged within 0.2 pH unit bins and the error bars represent s.e.m. The continuous line, representing the intrinsic buffering capacity, was obtained by non-linear regression using a polynomial function. The dashed line includes the additional, theoretical contribution of the HCO3−/CO2 buffering system.
Mean results from all 26 experiments are shown in Fig. 2B where the data have been fitted with a polynomial function (continuous line). The dashed line in Fig. 2B includes the predicted additional contribution of the HCO3−/CO2 buffering system, and these are the values of βt that have been used throughout the rest of this paper to convert acidification rates to acid/base fluxes.
Effects of luminal inhibitors
To test further the assumption that the reduction in pHi upon inhibition of the basolateral transporters is due to efflux of HCO3− to the lumen of the duct, a microperfusion technique was used to apply anion transport inhibitors to the luminal membrane. To simulate physiological conditions, the lumen was perfused with a solution containing 139 mm HCO3− and 10 mm Cl−, while the bath was perfused with the normal HCO3−-buffered solution. In the experiments shown in Fig. 3A, unstimulated ducts, and ducts stimulated from 5 min with 5 μm forskolin, were exposed at 15 min to basolateral application of 0.3 mm amiloride and 0.1 mm DIDS. As with secretin (Fig. 1A), forskolin markedly accelerated the intracellular acidification resulting from inhibition of the basolateral transporters (Fig. 3A).
Figure 3. Inhibition of luminal membrane anion transporters by microperfusion.
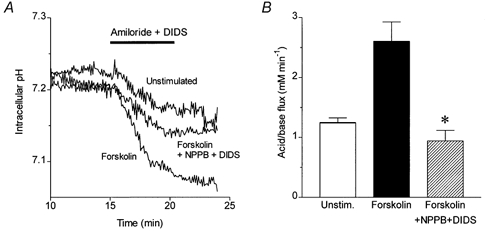
A, changes in intracellular pH in luminally microperfused guinea-pig duct exposed at 15 min to 0.3 mm amiloride and 0.1 mm DIDS. Three representative experiments show the pHi changes in an unstimulated duct, in a duct stimulated from 5 min with 5 μm forskolin, and in a duct stimulated with forskolin during luminal microperfusion with 0.1 mm NPPB and 0.1 mm DIDS to block the luminal membrane anion transporters. B, mean acid/base fluxes calculated from the rate of intracellular acidification induced by basolateral application of amiloride and DIDS in the experiments shown in A (n = 12 in each series). The asterisk indicates a significant difference from the response to forskolin alone (P < 0.05, Student's t test). The error bars represent s.e.m.
Inclusion of 0.1 mm NPPB and 0.1 mm DIDS in the luminal perfusate had no significant effect on the intracellular acidification evoked by basolateral amiloride and DIDS in the unstimulated ducts (data not shown). However, the stimulatory effect of forskolin was completely abolished (Fig. 3A and B). Since both NPPB and DIDS inhibit a variety of anion channels and transporters, it is impossible to identify the luminal channels and/or transporters involved in the acidification response. Whatever the mechanism, however, these results confirm that the increase in the acidification rate elicited by forskolin is the result of increased acid/base fluxes, most probably HCO3− secretion across the luminal membrane.
secretin-evoked hco3− secretion
Secretin is a major physiological stimulus for pancreatic HCO3− secretion. Therefore our first objective was to test the validity of this new technique by characterising the secretory response of the isolated ducts to this hormone. As mentioned earlier, stimulation with secretin had no significant effect on pHi but the subsequent acidification, evoked by application of amiloride and DIDS, was accelerated by secretin in a dose-dependent fashion (Fig. 4A). The apparent HCO3− fluxes, calculated from the acidification rate, taking into account the intracellular buffering capacity, are shown as a function of secretin concentration in Fig. 4B. Although a component of the calculated flux may be due to other sources of intracellular acidification, such as proton influx and metabolism, the secretin-stimulated component shows a sigmoid concentration-response curve with an EC50 of 0.5 nm (logEC50 = -9.3 ± 0.5) and a maximal acid/base flux of 4.5 ± 0.6 mm min−1. The EC50 value is comparable with that obtained previously by fluorescence imaging measurements of fluid secretion in isolated guinea-pig ducts (0.3 nm, logEC50 = -9.5 ± 0.5; Ishiguro et al. 1998). On the other hand, the EC50 is more than an order of magnitude greater than that obtained by micropuncture measurements of fluid secretion in rat ducts (20 pm; Argent et al. 1986), perhaps indicating a significant species difference in the secretin receptor characteristics.
Figure 4. Secretin-evoked HCO3− secretion in isolated guinea-pig pancreatic ducts.
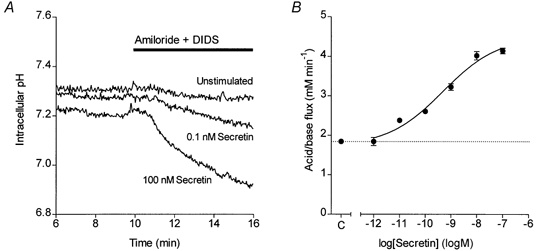
A, changes in intracellular pH in guinea-pig pancreatic ducts exposed at 10 min to 0.3 mm amiloride and 0.1 mm DIDS. Three representative experiments show the pHi changes in an unstimulated duct and in ducts stimulated from 5 min with either 0.1 or 100 nm secretin. B, concentration-response curve for secretin-stimulated HCO3− secretion. Data show mean values of acid/base flux in response to different concentrations of secretin (n = 6) and the error bars represent s.e.m. The continuous line was obtained by fitting a sigmoid curve. The dotted line represents the unstimulated control value (C) obtained from ducts exposed to 0.3 mm amiloride and 0.1 mm DIDS but not secretin (n = 15).
cck-evoked hco3− secretion
In the anaesthetised guinea-pig, CCK stimulates a copious secretion of HCO3−-rich pancreatic juice (Padfield et al. 1989). To determine whether this secretion represents a direct effect of CCK on ductal tissue, CCK was tested on isolated ducts using the same protocol as that described for secretin. Figure 5A shows that, like secretin, CCK evoked a dose-dependent increase in acidification rate upon application of amiloride and DIDS at 10 min. The concentration-response curve (Fig. 5B) has an EC50 of 0.2 nm (logEC50 = -9.9 ± 0.4) and the maximal acid/base flux was 4.1 ± 0.4 mm min−1, which is comparable with that obtained with maximal secretin stimulation.
Figure 5. CCK-evoked HCO3− secretion in isolated guinea-pig pancreatic ducts.
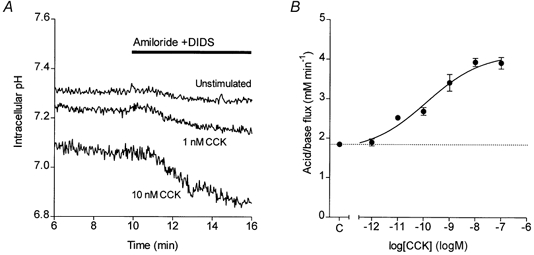
A, changes in intracellular pH in guinea-pig pancreatic ducts exposed at 10 min to 0.3 mm amiloride and 0.1 mm DIDS. Three representative experiments show the pHi changes in an unstimulated duct and in ducts stimulated from 5 min with either 1 or 10 nm CCK. B, concentration-response curve for CCK-stimulated HCO3− secretion. Data show mean values of acid/base flux in response to different concentrations of CCK (n = 9) and the error bars represent s.e.m. The continuous line was obtained by fitting a sigmoid curve. The dotted line represents the unstimulated control value (C) obtained from ducts exposed to 0.3 mm amiloride and 0.1 mm DIDS but not CCK (n = 15).
Figure 6A shows the effects on HCO3− secretion of pretreatment with selective CCK receptor antagonists. The stimulatory effect of CCK was completely inhibited by the CCK1 receptor antagonist devazepide (L364,718, 1 μm) but was unaffected by the CCK2 receptor antagonist L365,260 (1 μm). This indicates the presence of CCK1 rather than CCK2 receptors on guinea-pig pancreatic ducts.
Figure 6. Effects of CCK receptor antagonists on CCK-stimulated HCO3− secretion in isolated guinea-pig pancreatic ducts.
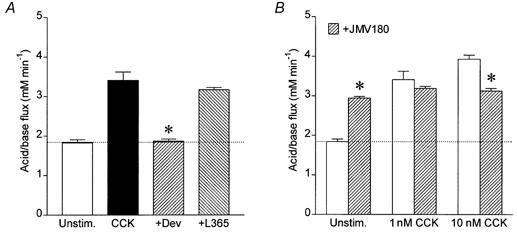
Mean acid/base fluxes calculated from the rate of intracellular acidification induced by basolateral application of 0.3 mm amiloride and 0.1 mm DIDS. A, ducts were either unstimulated (Unstim., n = 15) or stimulated with 1 nm CCK (CCK, n = 9), 1 nm CCK + 1 μm devazepide (+Dev, n = 9) or 1 nm CCK + 1 μm L365,260 (+L365, n = 9). The horizontal line represents the unstimulated control value. The asterisk indicates a significant difference from the response to CCK alone (P < 0.05, Student's t test). The error bars represent s.e.m.B, ducts were either unstimulated (Unstim., n = 15) or stimulated with 1 nm (n = 9) or 10 nm CCK (n = 9) in the presence ( ) or absence (□) of the partial CCK1 receptor agonist JMV-180 (3 μm). The horizontal line represents the unstimulated control value. The asterisks indicate significant differences from the corresponding responses in the absence of JMV-180 (P < 0.05, Student's t test). The error bars represent s.e.m.
The CCK1 receptor is known to exist in two alternative affinity states on pancreatic acini (Jensen, 1994). These two states can be distinguished using the CCK derivative JMV-180, which is an agonist at the high-affinity sites but an antagonist at the low-affinity sites (Matozaki et al. 1989). When applied alone to the isolated pancreatic ducts, 3 μm JMV-180 evoked a modest HCO3− secretion (Fig. 6B). However, in combination with a maximal dose of CCK (10 nm), JMV-180 caused a partial inhibition of HCO3− secretion, while at a mid-range CCK concentration (1 nm) it had neither stimulatory nor inhibitory effects (Fig. 6B). These results suggest that the lower end of the CCK dose-response curve is the result of occupation of high-affinity receptors while the upper end also involves occupation of low-affinity sites.
bombesin-evoked hco3− secretion
Like secretin and CCK, bombesin stimulation alone had no effect on the pHi of interlobular ducts isolated from guinea-pig pancreas. However, application of amiloride and DIDS to block basolateral HCO3− uptake again revealed a marked dose-dependent stimulation of HCO3− secretion, as reflected by a steep increase in the rate of intracellular acidification (Fig. 7A). The concentration- response curve for the effect of bombesin on HCO3− secretion (Fig. 7B) was again sigmoid, with an EC50 of 30 pm (logEC50 = -10.6 ± 0.4) and a maximal acid/base flux of 3.6 ± 0.1 mm min−1, comparable with the maximal values obtained with secretin and CCK.
Figure 7. Bombesin-evoked HCO3− secretion in isolated guinea-pig pancreatic ducts.
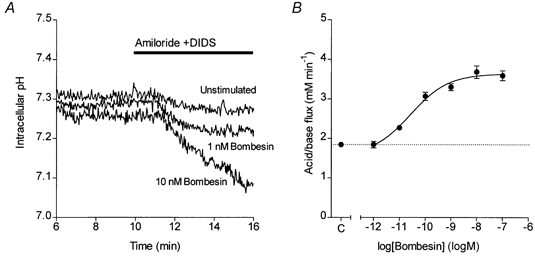
A, changes in intracellular pH in guinea-pig pancreatic ducts exposed at 10 min to 0.3 mm amiloride and 0.1 mm DIDS. Three representative experiments show the pHi changes in an unstimulated duct and in ducts stimulated from 5 min with either 1 or 10 nm bombesin. B, concentration-response curve of bombesin-stimulated HCO3− secretion. Data show mean values of acid/base flux in response to different concentrations of bombesin (n = 9) and the error bars represent s.e.m. The continuous line was obtained by fitting a sigmoid curve. The dotted line represents the unstimulated control value (C) obtained from ducts exposed to 0.3 mm amiloride and 0.1 mm DIDS but not bombesin (n = 15).
In mammals, bombesin-related peptides are thought to act either on GRP receptors or on NMB receptors. To distinguish between these, we examined the effects of selective bombesin receptor antagonists on the HCO3− fluxes evoked by bombesin stimulation. As shown in Fig. 8, the GRP receptor antagonist BME (1 μm) completely abolished the stimulatory effect of 10 nm bombesin while the NMB-type receptor antagonist BIM (1 μm) had no inhibitory effect, suggesting that the effect of bombesin is mediated through the GRP receptor.
Figure 8. Effects of bombesin receptor antagonists on bombesin-stimulated HCO3− secretion in isolated guinea-pig pancreatic ducts.
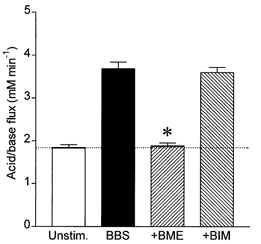
Mean acid/base fluxes calculated from the rate of intracellular acidification induced by basolateral application of 0.3 mm amiloride and 0.1 mm DIDS. Ducts were either unstimulated (Unstim., n = 15) or stimulated with 10 nm bombesin (BBS, n = 9), 10 nm bombesin + 1 μm BME (+BME, n = 9) or 10 nm bombesin + 1 μm BIM (+BIM, n = 9). The horizontal line represents the unstimulated control value. The asterisk indicates a significant difference from the response to bombesin alone (P < 0.05, Student's t test). The error bars represent s.e.m.
ach-evoked hco3− secretion
Similar experiments were also performed with ACh, which has previously been shown to evoke fluid secretion in rat pancreatic ducts (Ashton et al. 1993). Using a relatively high concentration of ACh (10 μm), the calculated HCO3− flux in the guinea-pig ducts was 3.8 ± 0.2 mm min−1, comparable with the maximal values obtained with secretin, CCK and bombesin. Smaller responses were obtained with 1 and 3 μm ACh. As in the rat ducts, the response to ACh was blocked by pretreatment with 10 μm atropine (data not shown), indicating the probable involvement of muscarinic receptors.
Fluid secretion evoked by CCK, bombesin and ACh
Because the ends of isolated guinea-pig pancreatic ducts seal during overnight culture, fluid secretion to the lumen causes the ducts to swell. The change in volume of the ducts can therefore be measured by video microscopy as a simple index of fluid secretory rate (Steward et al. 1998). Figure 9A shows mean data for the changes in relative duct volume occurring in the presence and absence of 1 nm CCK. Initially, in the HCO3−-free Hepes solution, the duct volume remained relatively constant. When the perfusion fluid was switched to the HCO3−-buffered solution at 10 min the ducts began to swell steadily, as a result of spontaneous fluid secretion. Application of 1 nm CCK at 20 min markedly accelerated ductal swelling, indicating that the secretory rate had increased.
Figure 9. Measurement of fluid secretion in response to secretagogues by video microscopy.
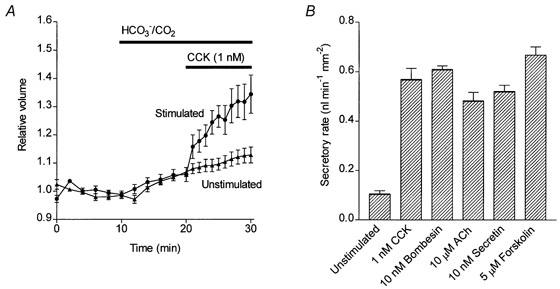
A, mean changes in relative luminal volume of isolated guinea-pig pancreatic ducts. The bath solution was switched from the Hepes-buffered solution to the HCO3−/CO2 solution at 10 min. Mean data from two series of experiments show the volume changes in unstimulated ducts (n = 10) and in ducts stimulated with 1 nm CCK from 20 min (n = 9).B, mean secretory rates calculated from the initial rate of increase in relative luminal volume following stimulation with a range of secretagogues. Mean and s.e.m. values were calculated from 6-23 individual experiments together with equivalent data from unstimulated control ducts (n = 13).
Using this method, fluid secretory rates were measured with several of the secretagogues over a range of concentrations. In general, the concentrations that were effective in stimulating fluid secretion were comparable with those that stimulated HCO3− secretion. Fluid secretory rates obtained with maximal doses of each of the agonists are plotted in Fig. 9B. Taken together with the intracellular acidification data, our results indicate that, like secretin, CCK, bombesin and ACh are all capable of directly evoking a HCO3−-rich fluid secretion in the interlobular ducts of the guinea-pig pancreas.
DISCUSSION
This paper describes a relatively simple fluorometric method for measuring the secretion of HCO3− in isolated pancreatic ducts. This is achieved by measuring the initial rate of intracellular acidification that occurs when the basolateral pH regulatory mechanisms of the cells are abruptly inhibited. The main transporters serving this function, and thereby responsible for the basolateral uptake of HCO3− during secretion, are a Na+-H+ exchanger which is blocked by amiloride and a Na+-HCO3− cotransporter which is blocked by DIDS (Ishiguro et al. 1996). In our experiments, simultaneous application of the two inhibitors caused a fall in pHi that was markedly accelerated by pretreatment with secretin (Fig. 1). This increased rate of acidification evoked by secretin pretreatment was dependent on the presence of HCO3−/CO2. We attribute this to a secretin-evoked increase in the efflux of HCO3− from the cells. In order to determine whether the direction of HCO3− efflux was to the duct lumen or to the bath, we microperfused the lumen to selectively block anion transport pathways at the luminal membrane (Fig. 3). Combined application of NPPB and DIDS to the luminal membrane completely abolished the increase in HCO3− efflux evoked, in this case, by forskolin stimulation. We therefore conclude that the acid/base flux measured by this technique is principally due to HCO3− secretion across the luminal membrane.
The intracellular acidification observed in unstimulated ducts using this technique may be due partly to spontaneous HCO3− secretion and partly to other, background sources of intracellular acidification such as H+ leakage into the cells, HCO3− efflux to the bath, and acidic products of metabolism, any of which could also change in response to secretagogue stimulation. Therefore, while our technique does not provide a pure measure of HCO3− secretion, it does represent a relatively simple assay for investigating the effects of putative regulators on ductal HCO3− secretion.
In order to convert the intracellular acidification rate to an apparent acid/base flux, it was necessary to measure the intracellular buffering capacity of the duct cells (Fig. 2). Our data indicate that, within the pHi range at which these measurements were made (7.1-7.4), the intracellular buffering capacity is approximately 60 mm. Thus a typical secretin-evoked increase in the intracellular acidification rate of 0.04 min−1 would be due to a net efflux of HCO3− of approximately 2 mm min−1.
While many peptide receptors have been identified on guinea-pig pancreatic acini (Jensen, 1994), rather little is known about the existence and role of such receptors on guinea-pig pancreatic ducts. Measurements of HCO3− and fluid secretion on isolated ducts permit such an analysis. In this paper, we have characterised the responses to CCK and bombesin, and also to the parasympathetic agonist ACh. Our results clearly demonstrate the existence of CCK1 receptors, GRP-type bombesin receptors and muscarinic ACh receptors in this tissue, and that occupation of all three receptors evokes both HCO3− and fluid secretion.
Physiological studies of pancreatic fluid and electrolyte secretion in the guinea-pig are very limited. However, an early study in our laboratory on anaesthetised guinea-pigs clearly showed that not only secretin but also CCK evoked a copious secretion of HCO3−-rich pancreatic juice (Padfield et al. 1989). It was impossible to say from that study whether CCK was acting on the ducts or the acini to evoke fluid secretion. The data in the current paper show unequivocally that, in the guinea-pig, CCK acts directly on the ducts. Furthermore, the duct swelling measurements parallel the HCO3− flux data and, like those for secretin, indicate that the secreted fluid is rich in HCO3−. This contrasts with the rat where CCK evokes a Cl−-rich secretion (Sewell & Young, 1975), most probably derived from the acini, and where the CCK analogue caerulein has been shown to have no effect on ductal fluid secretion (Argent et al. 1986).
CCK receptors were originally classified as CCKA and CCKB receptors (now CCK1 and CCK2) on the basis of their relative affinities for different peptides. The subsequent availability of specific antagonists has allowed further investigations into the physiological actions of the peptide (Scarpignato et al. 1993; Wank, 1998; Noble et al. 1999). There is good evidence for the presence of functional CCK1 receptors on pancreatic acini, on gallbladder smooth muscle, on other smooth muscle in the digestive tract, and in the enteric nervous system and brain (Wank, 1998; Noble et al. 1999). However, the presence and identity of functional CCK receptors on pancreatic ducts has not previously been studied. In the present study we used two benzodiazepine derivatives to selectively block CCK1 and CCK2 receptors. Devazepide, used at a concentration that blocks CCK1 but not CCK2 receptors (Huang et al. 1989), completely inhibited the effect of CCK on ductal HCO3− secretion. L365,260, which blocks CCK2 but not CCK1 receptors (Huang et al. 1989), did not alter the secretory response to CCK. Our data therefore indicate that it is the CCK1 receptor subtype that mediates the effect of CCK on guinea-pig pancreatic ducts.
In pancreatic acinar cells, the CCK1 receptor exists in two alternative affinity states which activate different intracellular messenger pathways (Jensen, 1994). The low-affinity receptors activate phospholipase Cβ1, resulting in generation of inositol trisphosphate and hence a rise in the intracellular Ca2+ concentration ([Ca2+]i), while the high-affinity receptors activate phospholipase A2 causing liberation of arachidonic acid which also elevates [Ca2+]i. Despite the convergence of the signalling pathways, occupancy of the high-affinity sites stimulates enzyme secretion while occupation of the low-affinity sites inhibits it. Consequently, the dose-response curve for CCK-evoked enzyme secretion is bell-shaped.
The effects of CCK-like peptides on gastrointestinal smooth muscle, however, are quite different. Our observations on pyloric, fundic and antral smooth muscle in rats suggest a lack of motor activity following occupation of high-affinity receptors, and a strong contractile activity following occupation of low-affinity receptors (Kisfalvi et al. 2001). Similar results have been obtained with gallbladder smooth muscle in guinea-pig and rabbit (Maubach et al. 1991; Taniguchi et al. 1995), suggesting that the absence of high-affinity CCK1 receptors on gastrointestinal smooth muscle is a general phenomenon.
JMV-180, which is an agonist of the high-affinity receptors and an antagonist of the low-affinity receptors, is a useful tool for differentiating the two receptor states and their functions (Bianchi et al. 1994; Rivard et al. 1994; Tsunoda & Owyang, 1995; Tsunoda et al. 1996). In rat and mouse pancreatic acini, JMV-180 acts on the high-affinity receptors to give a full secretory response similar to that of CCK. In the guinea-pig, however, it is only a partial agonist at the high-affinity receptors (Bianchi et al. 1994; Sjodin et al. 1997). At the low-affinity receptors it blocks the response to CCK in all three species including the guinea-pig. In gastrointestinal smooth muscle, where only the high-affinity receptors induce contraction, JMV-180 shows little or no agonist activity but displays a competitive antagonism against CCK stimulation (Maubach et al. 1991; Taniguchi et al. 1995; Kisfalvi et al. 2001).
In the present study, JMV-180 when given alone showed partial agonist activity compared with CCK. Furthermore, JMV-180 did not modify the ductal secretion evoked by 1 nm CCK, a concentration that evokes maximal enzyme secretion from acini through full occupation of high-affinity receptors. However, it significantly inhibited the secretory response to 10 nm CCK, a concentration that is generally regarded to activate not only high- but also low-affinity CCK receptors. This suppression of ductal secretion suggests that only the low-affinity component of the CCK receptor activation was inhibited by JMV-180.
Our conclusions from these studies with JMV-180 are in line with those drawn from CCK concentration-response relationships in a variety of tissues. In pancreatic acini, the curve is biphasic with an EC50 value for amylase secretion of around 30 pm (Jensen, 1994; Taniguchi et al. 1995; Kisfalvi et al. 2001), corresponding to an effect mediated by high-affinity receptors. On smooth muscle preparations, the contractile effect of CCK has an EC50 value of around 3 nm and the curve appears to be monophasic and is probably mediated by the low-affinity receptors (Jensen, 1994; Taniguchi et al. 1995; Kisfalvi et al. 2001). In the present work, the effect of CCK on HCO3− secretion was also monophasic but the EC50 value (around 0.2 nm) was half-way between the EC50 values obtained in acini and smooth muscle. Taken together with the JMV-180 data, this suggests that occupancy of both high- and low-affinity CCK1 receptor sites evokes HCO3− secretion in guinea-pig pancreas.
Bombesin-like immunoreactivity has been demonstrated throughout the gastrointestinal tract including the pancreas (Bunnett, 1994). The peptide has a wide range of biological effects amongst which its stimulatory action on pancreatic enzyme secretion is especially well characterised (Jensen, 1994). By contrast, physiological studies on bombesin-stimulated pancreatic fluid and electrolyte secretion are very limited. An early study in our laboratory on anaesthetised guinea-pigs clearly showed that not only secretin and CCK, but also bombesin, evoked a copious secretion of HCO3−-rich pancreatic juice (Padfield et al. 1989). The results of the present paper suggest that, like secretin and CCK, bombesin also directly stimulates ductal HCO3− and fluid secretion in this species. This observation is in line with studies in rats where bombesin also stimulates fluid secretion from isolated pancreatic ducts (Ashton et al. 1990, 1991).
The concentration-response curve for bombesin in our study is similar to that obtained previously with guinea-pig acini. In both cell types the EC50 values fall within the 10-100 pm range (Jensen, 1994), and it seems likely that the bombesin receptor subtypes are probably the same. Of the known subtypes, only one has been described in pancreatic acinar cells and this is the GRP-preferring bombesin receptor, so-called because of its preferential affinity for GRP (Jensen & Coy, 1991). A highly potent and selective antagonist for this receptor is d-Phe6-bombesin(6-13)-methyl ester (BME) which has an affinity constant of 1.29 nm (Jensen & Coy, 1991; Varga et al. 1991; Coy et al. 1992). A second subtype, first identified in oesophageal smooth muscle, is the NMB-preferring bombesin receptor which has a preferential affinity for NMB (Von Schrenck et al. 1989, 1990). Antagonists for this receptor include d-Nal-cyclo[Cys-Tyr-d-Trp-Orn-Val-Cys]-Nal-NH2 or BIM-23127 (BIM) which has a greater than 100-fold preference for the NMB receptor over the GRP receptor (Orbuch et al. 1993; Ladenheim et al. 1994; Milusheva et al. 1998). In the present study, we used BME and BIM to determine the receptor subtype that mediates the stimulatory effect of bombesin on ductal HCO3− secretion. We observed a complete inhibition of bombesin-stimulated secretion with BME but none with BIM, suggesting that the effect of bombesin on ducts (like that on acini) is mediated by the GRP-preferring bombesin receptors.
In contrast to CCK and bombesin, the effects of ACh on pancreatic ductal secretion have been investigated in a number of studies (Ashton et al. 1993; Hootman et al. 1993; Evans et al. 1996). These have clearly revealed that ACh stimulates fluid secretion from isolated rat pancreatic ducts with maximal rates comparable with those evoked by secretin (Ashton et al. 1993; Evans et al. 1996). In the present study we have also observed that ACh directly evokes a HCO3−-rich secretion in the pancreatic duct of the guinea-pig. Maximal secretory responses were similar to those obtained with secretin. Atropine abolished the stimulatory effect, suggesting the involvement of muscarinic cholinoceptors. Our observation is in line with previous results obtained in binding studies on isolated guinea-pig pancreatic ductal cells, which indicated the presence of M2 and M3 muscarinic receptors on these cells (Hootman et al. 1993).
As expected, the effects of CCK, bombesin and ACh on HCO3− secretion were paralleled by their effects on fluid secretion. This suggests that agonist-evoked fluid secretion in guinea-pig pancreatic ducts is invariably coupled to HCO3− secretion across the luminal membrane. The maximum rates of HCO3− and fluid secretion evoked by all of the agonists tested were similar in this species. In other words, CCK, bombesin (or GRP) and ACh each have the potential to significantly influence ductal HCO3− and fluid secretion. Whether they do so under physiological conditions remains to be determined.
Acknowledgments
This study was funded by the Wellcome Trust, the Cystic Fibrosis Trust (UK) and the British/Hungarian Intergovernmental Science and Technology Programme. We thank Márta Harasztiné for expert technical assistance.
References
- Argent BE, Arkle S, Cullen MJ, Green R. Morphological, biochemical and secretory studies on rat pancreatic ducts maintained in tissue culture. Quarterly Journal of Experimental Physiology. 1986;71:633–648. doi: 10.1113/expphysiol.1986.sp003023. [DOI] [PubMed] [Google Scholar]
- Ashton N, Argent BE, Green R. Effect of vasoactive intestinal peptide, bombesin and substance P on fluid secretion by isolated rat pancreatic ducts. Journal of Physiology. 1990;427:471–482. doi: 10.1113/jphysiol.1990.sp018182. [DOI] [PMC free article] [PubMed] [Google Scholar]
- Ashton N, Argent BE, Green R. Characteristics of fluid secretion from isolated rat pancreatic ducts stimulated with secretin and bombesin. Journal of Physiology. 1991;435:533–546. doi: 10.1113/jphysiol.1991.sp018523. [DOI] [PMC free article] [PubMed] [Google Scholar]
- Ashton N, Evans RL, Elliott AC, Green R, Argent BE. Regulation of fluid secretion and intracellular messengers in isolated rat pancreatic ducts by acetylcholine. Journal of Physiology. 1993;471:549–562. doi: 10.1113/jphysiol.1993.sp019915. [DOI] [PMC free article] [PubMed] [Google Scholar]
- Bianchi BR, Miller TR, Witte DG, Lin CW. Novel CCK analogs and bombesin – a detailed analysis between phosphoinositide breakdown and high-dose inhibition of pancreatic enzyme secretion in three rodent species. Journal of Pharmacology and Experimental Therapeutics. 1994;268:996–1002. [PubMed] [Google Scholar]
- Bunnett N. Gastrin-releasing peptide. In: Walsh JH, Dockray GJ, editors. Gut Peptides: Biochemistry and Physiology. New York: Raven Press; 1994. pp. 423–445. [Google Scholar]
- Case RM, Argent BE. Pancreatic duct secretion: control and mechanisms of transport. In: Go VLW, Dimagno EP, Gardner JD, Lebenthal E, Reber HA, Scheele GA, editors. The Pancreas: Biology, Pathobiology, and Disease. 2. New York: Raven Press; 1993. pp. 301–350. [Google Scholar]
- Coy DH, Mungan Z, Rossowski WJ, Cheng BL, Lin JT, Mrozinski JE, Jensen RT. Development of a potent bombesin receptor antagonist with prolonged in vivo inhibitory activity on bombesin-stimulated amylase and protein release in the rat. Peptides. 1992;13:775–781. doi: 10.1016/0196-9781(92)90186-7. [DOI] [PubMed] [Google Scholar]
- Evans RL, Ashton N, Elliott AC, Green R, Argent BE. Interactions between secretin and acetylcholine in the regulation of fluid secretion by isolated rat pancreatic ducts. Journal of Physiology. 1996;496:265–273. doi: 10.1113/jphysiol.1996.sp021683. [DOI] [PMC free article] [PubMed] [Google Scholar]
- Hootman SR, Zukerman J, Kovalcik SA. Muscarinic receptors in isolated guinea pig pancreatic ducts. Biochemical Pharmacology. 1993;46:291–296. doi: 10.1016/0006-2952(93)90417-u. [DOI] [PubMed] [Google Scholar]
- Huang SC, Zhang L, Chiang HCV, Wank SA, Maton PN, Gardner JD, Jensen RT. Benzodiazepine analogs L365,260 and L364,718 as gastrin and pancreatic CCK receptor antagonists. American Journal of Physiology. 1989;257:G169–174. doi: 10.1152/ajpgi.1989.257.1.G169. [DOI] [PubMed] [Google Scholar]
- Ishiguro H, Naruse S, Kitagawa M, Hayakawa T, Case RM, Steward MC. Luminal ATP stimulates fluid and HCO3− secretion in guinea-pig pancreatic duct. Journal of Physiology. 1999;519:551–558. doi: 10.1111/j.1469-7793.1999.0551m.x. [DOI] [PMC free article] [PubMed] [Google Scholar]
- Ishiguro H, Naruse S, Steward MC, Kitagawa M, Ko SBH, Hyakawa T, Case RM. Fluid secretion in interlobular ducts isolated from guinea-pig pancreas. Journal of Physiology. 1998;511:407–422. doi: 10.1111/j.1469-7793.1998.407bh.x. [DOI] [PMC free article] [PubMed] [Google Scholar]
- Ishiguro H, Steward MC, Lindsay ARG, Case RM. Accumulation of intracellular HCO3− by Na+-HCO3− cotransport in interlobular ducts from guinea-pig pancreas. Journal of Physiology. 1996;495:169–178. doi: 10.1113/jphysiol.1996.sp021582. [DOI] [PMC free article] [PubMed] [Google Scholar]
- Jensen RT. Receptors on pancreatic acinar cells. In: Johnson LR, editor. Physiology of the Gastrointestinal Tract. 3. New York: Raven Press; 1994. pp. 1377–1446. [Google Scholar]
- Jensen RT, Coy DH. Progress in the development of potent bombesin receptor antagonists. Trends in Pharmacological Sciences. 1991;12:13–19. doi: 10.1016/0165-6147(91)90483-9. [DOI] [PubMed] [Google Scholar]
- Kisfalvi K, Racz G, Zsirka-Klein A, Pelosini I, Scarpignato C, Varga G. Different affinity states of CCK1 receptors on pancreatic acini and gastric smooth muscle in the rat. Journal of Physiology (Paris) 2001 doi: 10.1016/s0928-4257(01)00053-5. (in the Press) [DOI] [PubMed] [Google Scholar]
- Ladenheim EE, Taylor JE, Coy DH, Moran TH. Blockade of feeding inhibition by neuromedin-B using a selective receptor antagonist. European Journal of Pharmacology. 1994;271:R7–9. doi: 10.1016/0014-2999(94)90291-7. [DOI] [PubMed] [Google Scholar]
- Matozaki T, Martinez J, Williams JA. A new CCK analog differentiates two functionally distinct CCK receptors in rat and mouse pancreatic acini. American Journal of Physiology. 1989;257:G594–600. doi: 10.1152/ajpgi.1989.257.4.G594. [DOI] [PubMed] [Google Scholar]
- Maubach K, Patel M, Spraggs CF. Interaction of gastrin/cholecystokinin agonists and antagonists on guinea pig gall-bladder. British Journal of Pharmacology. 1991;104(suppl.):142P. [Google Scholar]
- Milusheva EA, Kortezova NI, Mizhorkova ZN, Papasova M, Coy DH, Balint A, Vizi ES, Varga G. Role of different bombesin receptor subtypes mediating contractile activity in cat upper gastrointestinal tract. Peptides. 1998;19:549–556. doi: 10.1016/s0196-9781(97)00467-1. [DOI] [PubMed] [Google Scholar]
- Noble F, Wank SA, Crawley JN, Bradwejn J, Seroogy KB, Hamon M, Roques BP. International union of pharmacology. XXI. Structure, distribution, and functions of cholecystokinin receptors. Pharmacological Reviews. 1999;51:745–781. [PubMed] [Google Scholar]
- Novak I, Greger R. Electrophysiological study of transport systems in isolated perfused pancreatic ducts: properties of the basolateral membrane. Pflügers Archiv. 1988a;411:58–68. doi: 10.1007/BF00581647. [DOI] [PubMed] [Google Scholar]
- Novak I, Greger R. Properties of the luminal membrane of isolated perfused rat pancreatic ducts: effect of cyclic AMP and blockers of chloride transport. Pflügers Archiv. 1988b;411:546–553. doi: 10.1007/BF00582376. [DOI] [PubMed] [Google Scholar]
- Orbuch M, Taylor JE, Coy DH, Mrozinski JE, Mantey SA, Battey JF, Moreau JP, Jensen RT. Discovery of a novel class of neuromedin B-receptor antagonists, substituted somatostatin analogs. Molecular Pharmacology. 1993;44:841–850. [PubMed] [Google Scholar]
- Padfield PJ, Garner A, Case RM. Patterns of pancreatic secretion in the anaesthetised guinea pig following stimulation with secretin, cholecystokinin octapeptide, or bombesin. Pancreas. 1989;4:204–209. doi: 10.1097/00006676-198904000-00009. [DOI] [PubMed] [Google Scholar]
- Rivard N, Rydzewska G, Lods JS, Martinez J, Morisset J. Pancreas growth, tyrosine kinase, PtdIns 3-kinase, and PLD involve high-affinity CCK-receptor occupation. American Journal of Physiology. 1994;266:G62–70. doi: 10.1152/ajpgi.1994.266.1.G62. [DOI] [PubMed] [Google Scholar]
- Scarpignato C, Varga G, Corradi C. Effect of CCK and its antagonists on gastric-emptying. Journal of Physiology (Paris) 1993;87:291–300. doi: 10.1016/0928-4257(93)90035-r. [DOI] [PubMed] [Google Scholar]
- Sewell WA, Young JA. Secretion of electrolytes by the pancreas of the anaesthetized rat. Journal of Physiology. 1975;252:379–396. doi: 10.1113/jphysiol.1975.sp011149. [DOI] [PMC free article] [PubMed] [Google Scholar]
- Sjodin L, Viitanen E, Gylfe E. Cholecystokinin-JMV-180 and pilocarpine are potent inhibitors of cholecystokinin and carbachol actions on guinea pig pancreatic acinar cells. Naunyn-Schmiedeberg's Archives of Pharmacology. 1997;355:631–637. doi: 10.1007/pl00004994. [DOI] [PubMed] [Google Scholar]
- Steward MC, Lang TF, San Román JI, Case RM. Measurement of secretory rate in isolated pancreatic duct segments by digital videomicroscopy. Journal of Physiology. 1998;509.P:3P. [Google Scholar]
- Szalmay G, Steward MC, Case RM, Varga G. Cholecystokinin and bombesin receptor subtypes regulating bicarbonate and fluid secretion in isolated guinea-pig pancreatic ducts. Journal of Physiology. 2000;526.P:12–13P. doi: 10.1111/j.1469-7793.2001.00795.x. [DOI] [PMC free article] [PubMed] [Google Scholar]
- Szatkowski MS, Thomas RC. The intrinsic intracellular H+ buffering power of snail neurones. Journal of Physiology. 1989;409:89–101. doi: 10.1113/jphysiol.1989.sp017486. [DOI] [PMC free article] [PubMed] [Google Scholar]
- Taniguchi H, Nagasaki M, Tamaki H. Effects of cholecystokinin (CCK)-JMV-180 on the CCK receptors of rabbit pancreatic acini and gallbladder smooth muscle. Japanese Journal of Pharmacology. 1995;67:219–224. doi: 10.1254/jjp.67.219. [DOI] [PubMed] [Google Scholar]
- Thomas JA, Buchsbaum RN, Zimniak A, Racker E. Intracellular pH measurements in Ehrlich ascites tumor cells utilizing spectroscopic probes generated in situ. Biochemistry. 1979;18:2210–2218. doi: 10.1021/bi00578a012. [DOI] [PubMed] [Google Scholar]
- Tsunoda Y, Owyang C. High-affinity CCK receptors are coupled to phospholipase A2 pathways to mediate pancreatic amylase secretion. American Journal of Physiology. 1995;269:G435–444. doi: 10.1152/ajpgi.1995.269.3.G435. [DOI] [PubMed] [Google Scholar]
- Tsunoda Y, Yoshida H, Owyang C. Structural requirements of CCK analogues to differentiate second messengers and pancreatic secretion. American Journal of Physiology. 1996;271:G8–19. doi: 10.1152/ajpgi.1996.271.1.G8. [DOI] [PubMed] [Google Scholar]
- Varga G, Reidelberger RD, Liehr RM, Bussjaeger LJ, Coy DH, Solomon TE. Effects of potent bombesin antagonist on exocrine pancreatic secretion in rats. Peptides. 1991;12:493–497. doi: 10.1016/0196-9781(91)90090-c. [DOI] [PubMed] [Google Scholar]
- Von Schrenck T, Heinzerian P, Moran T, Mantey SA, Gardner JD, Jensen RT. Neuromedin-B receptor in esophagus – evidence for subtypes of bombesin receptors. American Journal of Physiology. 1989;256:G747–758. doi: 10.1152/ajpgi.1989.256.4.G747. [DOI] [PubMed] [Google Scholar]
- Von Schrenck T, Wang LH, Coy DH, Villanueva ML, Mantey S, Jensen RT. Potent bombesin receptor antagonists distinguish receptor subtypes. American Journal of Physiology. 1990;259:G468–473. doi: 10.1152/ajpgi.1990.259.3.G468. [DOI] [PubMed] [Google Scholar]
- Wank SA. G protein-coupled receptors in gastrointestinal physiology I. CCK receptors: an exemplary family. American Journal of Physiology. 1998;274:G607–613. doi: 10.1152/ajpgi.1998.274.4.g607. [DOI] [PubMed] [Google Scholar]
- Weintraub WH, Machen TE. pH regulation in hepatoma cells: roles for Na-H exchange, Cl-HCO3 exchange, and Na-HCO3 cotransport. American Journal of Physiology. 1989;257:G317–327. doi: 10.1152/ajpgi.1989.257.3.G317. [DOI] [PubMed] [Google Scholar]