Abstract
The effect of the mutation K448E in the rat GABA transporter rGAT1 was studied using heterologous expression in Xenopus oocytes and voltage clamp.
At neutral pH, the transport-associated current vs. voltage (I–V) relationship of the mutated transporter was different from wild-type, and the pre-steady-state currents were shifted towards more positive potentials. The mutated transporter showed an increased apparent affinity for Na+ (e.g. 62 vs. 152 mm at −60 mV), while the opposite was true for GABA (e.g. 20 vs. 13 μm at −60 mV).
In both isoforms changes in [Na+]o shifted the voltage dependence of the pre-steady-state and of the transport-associated currents by similar amounts.
In the K448E form, the moved charge and the relaxation time constant were shifted by increasing pH towards positive potentials. The transport-associated current of the mutated transporter was strongly reduced by alkalinization, while acidification slightly decreased and distorted the shape of the I–V curve. Accordingly, uptake of [3H]GABA was strongly reduced in K448E at pH 9.0. The GABA apparent affinity of the mutated transporter was reduced by alkalinization, while acidification had the opposite result.
These observations suggest that protonation of negatively charged residues may regulate the Na+ concentration in the proximity of the transporter. Calculation of the unidirectional rate constants for charge movement shows that, in the K448E form, the inward rate constant is increased at alkaline pH, while the outward rate constant does not change, in agreement with an effect due to mass action law.
A possible explanation for the complex effect of pH on the transport-associated current may be found by combining changes in local [Na+]o with a direct action of pH on GABA concentration or affinity. Our results support the idea that the extracellular loop 5 may participate to form a vestibule to which sodium ions must have access before proceeding to the steps involving charge movement.
The study of structure-function relationships in the Na+-Cl−-dependent family of cotransporters has not yet produced a clear and univocal picture describing the regions of the amino acid sequence involved in the various aspects of the cotransport process.
Some schematizations emerging from the literature (Giros et al. 1994; Palacín et al. 1998; Masson et al. 1999) have attributed the ionic dependence and permeation pathway to the amino-terminal region up to the fourth transmembrane segment. Other studies point to the possible existence of a re-entrant hydrophobic loop preceding the first transmembrane domain, critical for the transport function (Keshet et al. 1995; Yu et al. 1998), although recent experiments in the 5HT transporter SERT do not confirm the existence of this structure (Chen et al. 1998).
The external loops have been suggested to form a pocket for substrate binding (Buck & Amara, 1994; Tamura et al. 1995), while more recent evidence (Chen et al. 1997; Barker et al. 1998, 1999; Chen & Rudnick, 2000; Adkins et al. 2001) implicate also transmembrane domains 1 to 3 in substrate and antagonist interaction.
The effects of pH on the properties of the neurotransmitter cotransporters may be useful in defining regions with functional relevance. In fact, variations in extracellular pH induce diverse consequences on the functional properties of several cotransporters: in rat 5HT transporter (rSERT) acidic pH enhances the current in the absence of organic substrate (uncoupled current) and the transport-associated current, while inhibiting the pre-steady-state charge movements upon voltage jumps (Cao et al. 1997). Similar effects can also be observed in GABA (GAT1), glucose (SLGT1) and dopamine (DAT) transporters, but not in a glycine (GLYT1) transporter (Hirayama et al. 1994; Cao et al. 1997; Sonders et al. 1997), while little or no potentiation of the substrate-induced current was seen in GAT1 and SGLT. Finally, in GLYT1 acidic pH actually reduced the glycine-induced current (Cao et al. 1997). Of particular interest are the results from the human 5HT transporter (hSERT) which, although 92 % identical to rSERT, does not exhibit the same pH sensitivity (Cao et al. 1998). These authors found that amino acid residues in the fifth extracellular loop (EL 5) are responsible for the presence or absence of pH sensitivity in the serotonin transporters. In addition, we have described an inhibitory effect of acidic pH on the transport-associated current and on the pre-steady-state charge movement in another, rather distant, member of the Na+-Cl−-dependent family, the insect potassium-coupled amino acid transporter KAAT1 (Castagna et al. 1998; Peres & Bossi, 2000). The pKa of this block suggested the involvement of an histidine residue located in the fifth extracellular loop.
Comparing the sequences of GAT1, rSERT, hSERT and KAAT1 in this short loop, the most apparent difference is the presence of positive lysine residues in the pH-insensitive transporters in place of threonine in rSERT and a negatively charged glutamate in KAAT1.
Identification of residues or short sequences that may confer pH sensitivity could give hints with regard to the structure-function relationships of the transporters (de la Horra et al. 2000), and with this aim in mind we have decided to produce mutations in the fifth extracellular loop of rGAT1, taking the KAAT1 sequence as a model, to verify whether in this way it was possible to induce pH effects on the electrophysiological properties of rGAT1 and to deduce new information on structure- function relationships of this cotransporter.
METHODS
Construction of point mutations
Mutations in the extracellular loop 5 (EL 5) of rGAT1, were obtained by site-directed mutagenesis (Quickchange Site-Directed Mutagenesis Kit, Stratagene Inc., Milano, Italy). Briefly, 20 ng of the plasmid containing the wild-type rat GAT1 cDNA were amplified with 2.5 units of Pfu DNA polymerase in the presence of 250 nm overlapping primers containing in their sequence the mutated codons:
F447P, s: 5′-CAGGGTGGCATTTATGTCCCCAAACTGTTCGATTA TTACTCT-3′
K448E, s: 5′-CAGGGTGGCATTTATGTCTTCGAACTGTTCGATT ATTACTCTGC-3′
Y452E, s: 5′-TATGTCTTCAAACTGTTCGATGAGTACTCTGCCAGT GGCATG-3′
PCR amplification was performed with 25 thermal cycles of 95 °C for 30 s, 55 °C for 1 min, and 68 °C for 14 min. Then, 10 units of DpnI were added directly to the amplification reaction, and the sample was incubated for 1 h at 37 °C to digest the parental, methylated DNA. XL1-blue supercompetent cells were finally transformed with 1 μl of the reaction mixture and plated onto LB-ampicillin plates. After plasmid purification, sequences were verified by sequencing (Primm, Single Run Sequences, Milan, Italy).
Xenopus laevis oocyte expression
The cDNA encoding the rat GAT1 cotransporter cloned into the pAMV-PA vector was kindly provided by Drs C. Labarca and H. A. Lester (Div. of Biology, Caltech, Pasadena, CA, USA). After linearization with Not I, cRNAs were in vitro synthetized in the presence of Cap Analog and 200 units of T7 RNA polymerase. All enzymes were supplied by Promega Italia (Milan, Italy). Xenopus laevis frogs were anaesthetized in MS222 (tricaine methansulfonate) 0.15 % (w/v) solution in tap water, portions of ovary were removed through a small incision on the abdomen, the incision was sutured and the animal was returned to water. The oocytes were treated with collagenase (Sigma Type IA) 1 mg ml−1 in ND96 Ca+ free, for at least 1 h at 18 °C. Healthy looking stages V and VI oocytes were collected and injected with 12.5 ng of cRNA in 50 nl of water, using a manual microinjection system (Drummond). Oocytes were tested 48–72 h after injection. Each frog was not reused more than two times; suitable postoperative care was given to the animals and the interval between operations was longer than 4 months. The frogs were humanely killed after the last collection. The experiments were carried out according to the institutional and national ethical guidelines.
Electrophysiology and data analysis
Classic two-electrode voltage clamp (GeneClamp, Axon Instruments Foster City, CA, USA) was used to record membrane currents under voltage-controlled conditions. Control of the experiment and data analysis were performed using pCLAMP 8 software (Axon Instruments). Four pulses were averaged at each potential; signals were filtered at 1 kHz and sampled at 2 kHz.
Pre-steady-state currents were isolated by subtracting corresponding traces in the presence of 30 μm SKF89976A (Tocris, http://www.tocris.com/) (Mager et al. 1993). Longer pulses (400 ms) were used in these experiments to allow the establishment of steady-state currents. Subtracted traces were corrected for any remaining leakage and integrated. Charge data in the text and figures always represent the average of ‘on’ and ‘off’ integrals, which never differed more than 10 % from each other.
Transport-associated currents were estimated by subtracting the traces in the absence of GABA from those in its presence for each experimental condition.
Uptake measurement
The uptake of 500 μm[3H]GABA (Amersham-Pharmacia Biotech., Milano, Italy) was measured 3 days after injection. Groups of 8–10 oocytes, from the same batch, were incubated in 100 μl of external control solution at a different pH for 10 min, dissolved in 200 μl of 10 % SDS and radioactivity counted by liquid scintillation.
Solutions
The external control solution had the following composition (mm): NaCl, 98; MgCl2, 1; CaCl2, 1.8; Hepes-free acid, 5 at pH 7.6. For pH value 6.5, Hepes was substituted with Mes, and for pH 9 with Taps. When [Na+]o was reduced, it was substituted by corresponding amounts of tetramethylammonium (TMA+).
The pH was adjusted with HCl or NaOH. GABA was added at the indicated μm concentrations to the appropriate solutions.
Solutions were superfused by gravity onto the oocyte by a pipette tip placed very close (1–2 mm) to the cell.
RESULTS
The membrane topology of the transporters belonging to the Na+-Cl−-coupled family includes twelve putative membrane-spanning domains. Among the various regions apparently involved in ion and organic substrate interaction, we have focused our attention on the fifth extracellular loop (EL5), which has been suggested to influence substrate selectivity in rGAT1 (Tamura et al. 1995) and in conferring pH sensitivity in rSERT (Cao et al. 1998). The amino acid sequences of some relevant neurotransmitter transporters in this short loop are indicated in Fig. 1, aligned with the sequence of KAAT1, the neutral amino acid transporter from lepidopteran intestine.
Figure 1. Amino acid sequences of EL 5 in some transporters of the Na+-Cl−-dependent family.
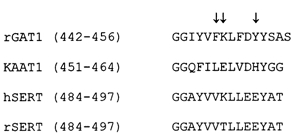
Arrows indicate the positions where mutations have been introduced.
The transporters listed in Fig. 1 differ in their sensitivity to pH: hSERT and rGAT1 are only weakly affected by acidic pH (Cao et al. 1997); in rSERT acidic pH induces an increase in uncoupled and coupled currents and inhibition of transient currents (Cao et al. 1997); in KAAT1 low pH inhibits coupled and transient currents (Peres & Bossi, 2000). The different sensitivity to pH exhibited by rSERT and hSERT has been studied by Cao et al. (1997, 1998), who showed that lysine 490 in hSERT abolishes the pH sensitivity observed in rSERT, which has instead a threonine residue in the same position. It is interesting to note also that rGAT1 has a lysine in the position corresponding to hSERT 490, while, in contrast, KAAT1 has a negatively charged glutamate. Also the two glutamates in positions 493 and 494 appear to have a role in the pH sensitivity exhibited by rSERT (Cao et al. 1998); similarly, rGAT1 has an aspartate in position 451 (corresponding to 493 of SERT), but a tyrosine in position 452.
On the basis of the above considerations we have tested the effects of pH on wild-type rGAT1 and on some mutated forms (K448E, Y452E and F447P). The F447P mutation, that was intended as a negative control, completely abolished the two kinds of current characteristic of this family of transporters: the ‘pre-steady-state’ current in the absence of organic substrate, and the transport-associated current, when the substrate is added. In the other two mutations pre-steady-state and transport-associated currents were preserved with amplitudes comparable to those of wild-type. As will be explained below, the pH effects on Y452E appeared of less interest than those observed in K448E, and only the latter will be presented here.
Transient- and transport-associated current in the K448E mutant
Figure 2 shows typical recordings from two oocytes expressing wild-type and the K448E mutant form stimulated with voltage-clamp pulses from a holding potential of −40 mV. At neutral pH and in the absence of GABA, it appears that while in wild-type the transient currents have symmetrical time courses for depolarizations and hyperpolarizations from Vh =−40 mV, the K448E transients are larger and slower for depolarizations than for hyperpolarizations.
Figure 2. Transient- and transport-associated currents in wild-type and mutated GAT1.
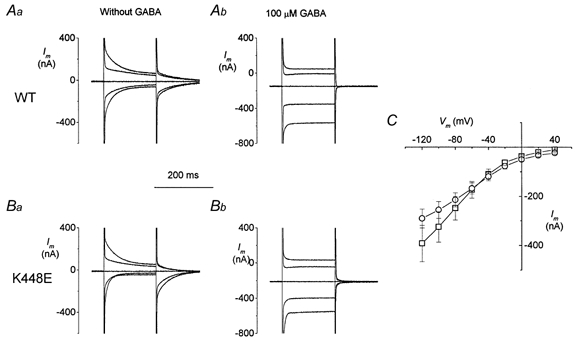
Currents in response to voltage-clamp steps to −120, −80, 0 and +40 mV (from Vh = −40 mV) are shown for two oocytes expressing wild-type (Aa and Ab) and K448E rGAT1 (Ba and Bb) in the absence (left column) and presence (right column) of 100 μm GABA. C, I–V curves for transport-associated currents (□, wild-type, n = 13; ○, K448E, n = 11; data from three batches).
Addition of 100 μm GABA elicits in the K448E form transport-associated currents that do not appear, at first sight, particularly different from those induced in wild-type. The traces are shown in Fig. 2A and B, while in C the average I–V curves are plotted. These were obtained by subtracting the current traces in the absence of 100 μm GABA from those in the presence of 100 μm GABA at each potential. It is difficult at this stage to compare the amplitude of the current of the two forms, because this is influenced by different levels of expression in individual oocytes; qualitatively, however, a distortion of the I–V relationship in the mutated transporter is evident.
Analysis of the pre-steady-state current in wild-type and mutated rGAT1
In order to quantitatively analyse the pre-steady-state currents, these were isolated first by subtraction of the traces in the presence of 30 μm SKF89976A (Fig. 3A). The difference transients were integrated to obtain the charge vs. voltage relationships, shown in Fig. 3B. As expected, ‘on’ and ‘off’ integrals coincided (not shown), and the curves showed saturation at large negative and positive potentials, both in wild-type and mutated isoforms. However the curve for the mutated transporter was shifted by about 20 mV towards positive potentials; fitting with a Boltzmann distribution:
 |
(1) |
gave V11/2sol;2 = −35 ± 0.4 mV for wild-type (WT) and −14.7 ± 0.2 mV for mutated, while the slope (s) was not significantly changed (21.0 ± 0.4 mV for WT and 19.4 ± 0.2 mV for mutated).
Figure 3. Voltage dependence of transient currents.
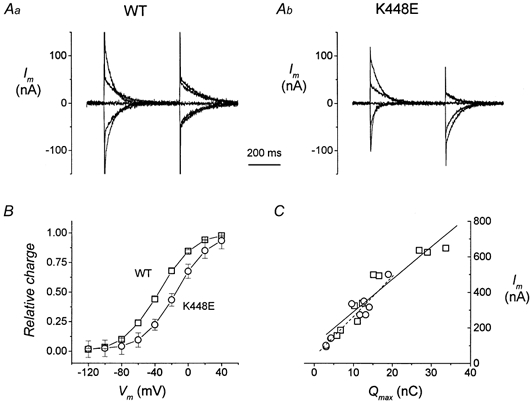
A, current traces after subtraction of the corresponding records in the presence of 30 μm SKF89976A. Aa, an oocyte expressing WT rGAT1 and Ab another oocyte expressing the mutated form. B, normalized Q–V curves obtained from integration of transients such as those in A (□, wild-type, n = 27; ○, K448E, n = 25; four different batches). Curves in B were fitted with a Boltzmann distribution to give the parameters in the text. C, relation between transport-associated current (at −120 mV) and Qmax for oocytes expressing wild-type rGAT1 (□ and continuous line) and oocytes expressing the K448E form (○ and dashed line).
The maximal amount of charge appeared to be generally lower for the mutated isoform, but this was quite variable, due to the possible different expression ability of the two forms combined with individual expression capacities of each oocyte.
We have then related, for each oocyte, the value of maximal charge displaced in the absence of GABA (Qmax) to the amplitude of the transport-associated current exhibited by the same oocyte. These data are plotted in Fig. 3C for nine oocytes expressing wild-type rGAT1 and for ten oocytes expressing K448E rGAT1. It can be observed that the Qmax values ranged between about 3 and 33 nC, reflecting the different expression levels of the individual oocytes; nonetheless there was a good correlation between charge and current for both isoforms. Furthermore, the two regression lines were not significantly different, suggesting that the coupling between charge movement and transport-associated current has not been altered by the mutation.
Effects of extracellular Na+ on the pre-steady-state currents
A voltage shift in the Q–V curves has been reported as an effect of changing the external Na+ concentration (Mager et al. 1993), and can be theoretically accounted for by the following a generalized Hill equation (Mager et al. 1996):
 |
(2) |
where q is the elementary charge, δ is the fraction of electrical field over which the charge movement occurs, KNa(V =0) represents a zero-voltage dissociation constant, k is the Boltzmann constant and T the absolute temperature.
Experimentally, the effect of reducing [Na+]o on the pre-steady-state currents is illustrated in Fig. 4A, where records of currents after subtraction of the corresponding traces in 30 μm SKF89976A are shown. In both isoforms, a progressive shift of the transient towards hyperpolarizing potentials with decreasing [Na+]o can be observed.
Figure 4. Effects of [Na+]o on pre-steady-state currents.
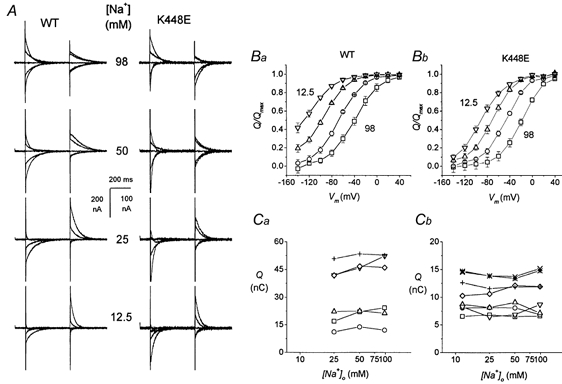
A, SKF-subtracted records of transient currents from oocytes bathed in solutions containing the indicated sodium concentration. In both wild-type and mutated forms lowering external sodium induces a shift of the transient currents towards more negative potentials. B, Q vs. V curves in different [Na+]o. A negative shift is apparent in the Q–V relationships for both wild-type (Ba) and mutated (Bb) transporter when the external Na+ concentration is decreased. Normalization was done as explained in the text. □, 98 mm Na+; ○, 50 mm Na+; ▵, 5 mm Na+; ▿, 12.5 mm Na+. Ca and Cb show the individual, non-normalized value of Qmax as a function of [Na+]o in the 6 wild-type and the 8 mutated oocytes used to average the Q–V data.
Integration of the transients gives the Q–V curves shown in Fig. 4B. The two forms of the transporter show a similar negative shift with decreasing Na+, although in the mutated one all curves are moved at more positive values. For every oocyte, a Boltzmann distribution was fitted to each curve; these were then normalized to the Qmax at 98 mm Na+ for wild-type transporter and at 50 mm Na+ for mutated transporter; 98 and 50 mm were the Na+ concentrations at which the curves showed better saturation at both ends in the two isoforms. The other panels of Fig. 4 illustrate that the shifts occur without change in the maximum amount of charge (Qmax), both in wild-type (Fig. 4Ca) and mutated transporter (Fig. 4Cb). All these observations confirm those of Mager et al. (1993, 1996).
Na+ apparent affinity
We then tested the effects of changing the external sodium concentration on the transport-associated currents. Shifts of the I–V curves along the voltage axis are expected with changes in the external Na+ concentration or in the Na+ dissociation constant (Mager et al. 1996), and arise from a mass action effect on the charge translocation and transport processes.
The effects of a reduction in external Na+ concentration (TMA+ substitution) on the transport-associated current are shown in Fig. 5. In A and B the mean I–V curves for the two transporter isoforms are plotted for Na+ concentrations of 98, 50, 25, 12.5 and 6 mm. The data in Fig. 5A and B have been re-plotted as a function of [Na+]o and fitted with a Hill equation:
 |
(3) |
Figure 5. Transport-associated current as a function of Na+ concentration.
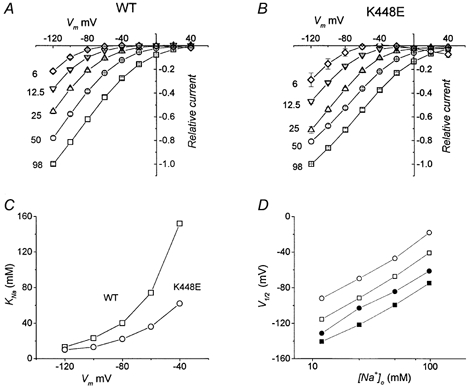
A and B represent the average I–V relationships for the transport-associated current from wild-type and mutated transporters, respectively. Before averaging, data were normalized to the current at −120 mV and 98 mm Na+ for each oocyte. Data are means ±s.e.m., n = 4 for both panels. Fitting a Hill equation (nh = 1.3) to the current [Na+]o gives the values of KNa plotted in C for WT (□) and K448E (○). D, the filled symbols represent the sodium dependence of the transport-associated current (data taken at the 0.5 level of the current in A and B for wild-type (□) and mutated (○) forms. For comparison, the values of V11/2sol;2 from the Q–V curves in Fig. 4 have been plotted as a function of [Na+]o for wild-type (□) and mutated (○) transporters.
The Hill coefficient was estimated from a double-logarithmic plot of the transport-associated currents at V = −40, −60 and −80 mV vs.[Na+]o, and resulted in 1.2 to 1.5; in analogy with the procedure used by Mager et al. (1993), a value nh = 1.3 was used for the fitting. The values of KNa changed with voltage, ranging from 12.7 mm at −140 mV to 152 mm at −60 mV for wild-type, and from 10 mm at −140 mV to 62.1 mm at −60 mV for the mutated form (Fig. 5C). This analysis suggests therefore that the mutated transporter has a greater apparent affinity for Na+, compared to wild-type.
Observing the curves in Fig. 5A and B, it is evident that each curve can be obtained from one another, simply by a shift along the voltage axis, indicating that voltage and [Na+]o can complement each other in determining the amplitude of the current.
To quantify the shift we have plotted in Fig. 5D the voltage corresponding to I11/2sol;2 in A and B of Fig. 5 against the logarithm of the Na+ concentration. In the same graph we have also plotted the shift in V11/2sol;2 determined previously for the charge vs. voltage relationships of wild-type and mutated transporter (Fig. 4). Very interestingly the four lines are parallel, suggesting that the way in which [Na+]o affects the pre-steady-state current and the transport-associated current is identical and corresponds to about +25 mV for a doubling of Na+ concentration.
Furthermore, comparing the values of the dissociation constant obtained in the above experiments, it appears that the mutation has roughly doubled the apparent affinity of the transporter for sodium.
Apparent affinity for GABA
We have also studied whether the mutated transporter had a different apparent affinity for GABA. This was done by evaluating the amplitude of the transport-associated current as a function of GABA concentration at a fixed [Na+]o of 98 mm.
The results are shown in Fig. 6, where the average currents from two groups of oocytes, expressing respectively wild-type and mutated forms of rGAT1, are plotted as functions of voltage (A and B), while the GABA concentration giving rise to half-maximal current is plotted in C. These values were similar to those previously reported (Mager et al. 1993) for wild-type; however, they were larger for the mutated form indicating that, contrary to the result obtained for Na+, the apparent affinity for GABA is decreased.
Figure 6. Transport-associated current vs. potential at various GABA concentrations.
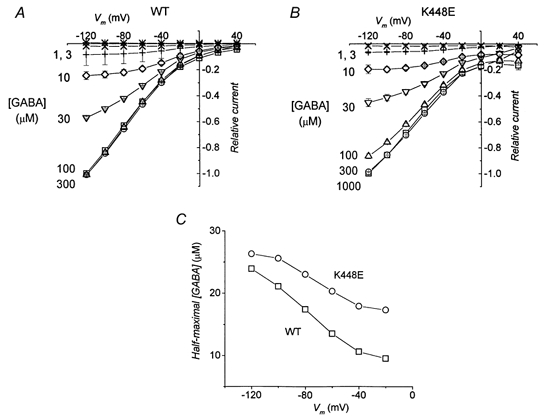
A and B, average currents induced by application of the indicated amount of GABA to oocytes expressing wild-type and K448E transporters, respectively. Before averaging, data were normalized to the current at −120 mV and 300 μm GABA for each oocyte. Data are means ±s.e.m., n = 4 for both A and B. In C the values of GABA concentration giving rise to half-maximal currents are plotted for each potential. Dose-response curves were fitted with Hill equations.
In addition, it is interesting to note that, in contrast to the effect of Na+ in Fig. 5, the effect of changing GABA concentration is to scale up and down the amplitude in I–V relationships.
Mutations in the extracellular loop 5 confer pH sensitivity to rGAT1
The effect of pH on the transient and transport-associated currents elicited in oocytes expressing wild-type or the K448E mutated foms of rGAT1 are summarized in Fig. 7.
Figure 7. Effects of pH on transient and transport-associated currents in wild-type and mutated isoforms.
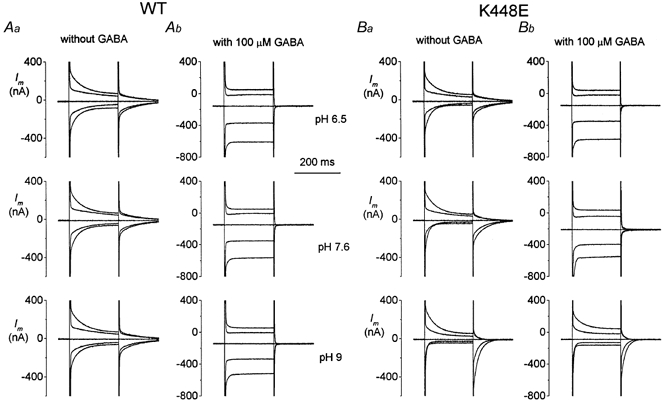
A, changing the pH as indicated does not significantly alter either the transient (Aa) or the transport-associated (Ab) currents. On the contrary, in the mutated form, the asymmetry of the transient currents seen at pH 7.6 is increased at pH 9.0 and decreased at pH 6.5 (Ba). Furthermore, the transport-associated current is strongly impaired at pH 9.0 and, in this condition, the pre-steady-state currents are not completely abolished (Bb). Voltage pulses to −120, −80, 0 and +40 mV from Vh = −40 mV; pulse duration was 200 ms.
Changing the external pH between 6.5 and 9.0 has little effect on pre-steady-state currents (Fig. 7Aa) as well as on the transport-associated currents (Fig. 7Ab) of the wild-type transporter. The transients remain substantially symmetrical around Vh = −40 mV at all pH values. The results obtained in the oocytes expressing the mutated transporter are shown in Fig. 7B. Contrary to the pH insensitivity of wild-type, the mutated transporters are affected by changes in pH: the already noted asymmetry of the transient currents at pH 7.6 becomes more marked at pH 9.0 and less so at pH 6.5. Furthermore, the transients become clearly faster with increasing pH. Also the transport-associated current is modified by pH, especially at alkaline values. As may be seen in Fig. 7Bb, addition of 100 μm GABA at pH 9.0 produces only a small increase in current and the usual disappearance of the pre-steady-state currents does not occur.
Also, the pre-steady-state currents of the Y452E mutated form were affected by pH: in this case acidification progressively decreased the amplitude of the currents without shift, an effect resembling that of the lepidopteran transporter KAAT1 (Peres & Bossi, 2000). Although this result confirms the importance of EL5 in pH regulation, we focused our attention only on the K448E mutation since, as will be clearer in the following discussion, the results from this mutation can be interestingly interpreted on both qualitative and quantitative grounds.
Effects of pH on the pre-steady-state currents
As before, the characteristics of the pre-steady-state currents were analysed quantitatively by estimating the amount of charge movement, from the integration of the current transients after subtraction of the corresponding currents in the presence of 30 μm SKF89976A.
The results of this kind of analysis are plotted in Fig. 8 as functions of voltage. These graphs show that changing the pH from 6.5 to 9 has substantially no effect on the Q–V relationships of wild-type (A), while the same treatment produces a clear displacement in the Q–V of the mutated form, with a positive shift caused by alkalinization and a negative one caused by acidification. Similar shifts occur in the time constant of relaxation in the mutated transporter, as shown in Fig. 8D, while no substantial changes can be seen in wild-type time constant (C).
Figure 8. Effect of pH on the charge-voltage characteristics.
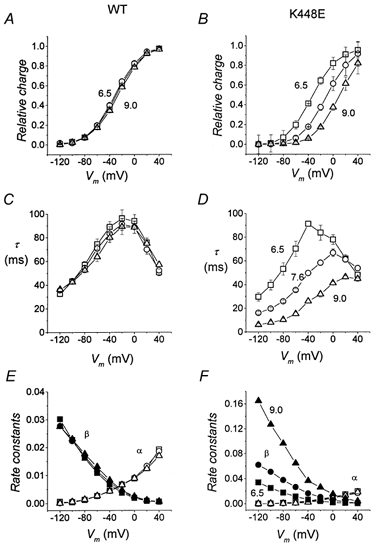
The position of the Q–V curves is not affected by pH in wild-type (A), while a progressive shift towards more negative values can be observed in the K448E mutated isoform (B). Symbols are as follow: pH 6.5, □; pH 7.6, ○; pH 9, ▵. Means ±s.e.m. from 33 oocytes (4 batches); each oocyte was tested at pH 7.6 and at least one other pH value; each Q–V curve was fitted with a Boltzmann function and normalization was performed using Qmax at pH 7.6 for each oocyte. C and D, relaxation time constants for wild-type and mutated form, respectively, obtained by fitting a single exponential to the transients as in Fig. 3; the rate constant for V = −40 mV was obtained from the ‘off’ transients. E and F, unidirectional rate constants for charge movement, calculated from Q–V and τ-V curves for wild-type (E) and K448E (F). In both panels open symbols represent the rate constant for outward charge movement (α) and filled symbols represent the rate constant for inward charge movement (β): pH 6.5, squares; pH 7.6, circles; pH 9.0, triangles.
As in the experiments using different Na+ concentrations (Fig. 4), the maximum charge is not affected by the pH changes; this is shown in Table 1, where the absolute values of Qmax in six oocytes tested at all three pH values are indicated; the slight decrease seen in some oocytes at pH 9 is probably due to worse fitting quality since the curves do not reach saturation at +40 mV at this pH.
Table 1.
Absolute values of Qmax (in nC) at different pH values in mutated transporter
| pH | Oocyte 1 | Oocyte 2 | Oocyte 3 | Oocyte 4 | Oocyte 5 | Oocyte 6 |
|---|---|---|---|---|---|---|
| 6.5 | 10.016 | 11.697 | 16.092 | 27.209 | 26.077 | 31.82 |
| 7.6 | 10.308 | 11.056 | 15.146 | 29.037 | 26.922 | 33.724 |
| 9.0 | 10.31 | 10.652 | 14.588 | 21.83 | 22.169 | 25.579 |
The parameters from fitting the data of Fig. 8 with a Boltzmann function are summarized in Table 2. The values show that in the mutated transporters the pH-induced shift occurs without change in the slope of the curve, and indeed, the slope of the mutated form is not significantly different from that of wild-type transporter.
Table 2.
Fitting parameters from the data of Fig. 8
| V½ (mV) | s (mV) | |||
|---|---|---|---|---|
| pH | WT | K448E | WT | K448E |
| 6.5 | −31.5 ± 0.7 | −34.3 ± 0.4 | 20.0 ± 0.6 | 20.3 ± 0.4 |
| 7.6 | −29.2 ± 0.4 | −10.2 ± 0.5 | 20.8 ± 0.4 | 20.2 ± 0.4 |
| 9.0 | −26.5 ± 0.6 | +10.01 ± 1.2 | 21.2 ± 0.6 | 19.4 ± 0.8 |
It appears, therefore, that the effects of pH on the pre-steady-state currents of the mutated transporter mimic the effect of changing the external Na+ concentration.
Rate constants
Under the simple hypothesis that charge movement occurs only between two states, the Q–V and τ-V curves of Fig. 8 allow us to calculate the unidirectional rate constants of the charge movement, using the relationships (Bossi et al. 1999):
 |
The results of these calculations are shown in Fig. 8E and F. Clearly no changes are seen in wild-type rates when the pH is changed (E), while the rates for the mutated form show a very interesting behaviour: only the inward rate constant β is affected by pH. In fact the inward rate constant β shows a conspicuous increase with alkalinization; in contrast the curve of the outward rate constant α is not affected and remains substantially identical to that of wild-type.
Effects of pH on the transport-associated currents
The voltage dependence of the transport-associated currents is plotted in Fig. 9 for the three tested pH values and for both isoforms. Values for each oocyte were normalized before averaging to the current at −120 mV and pH 7.6. It must be noted that at pH 9.0 a fraction of about 15 % of the GABA molecules should be negatively charged, because of the ionization of the amino group. Although it is unknown whether the charged species is transported or not, this fact might be responsible for the slight reduction visible in Fig. 9A at pH 9.0. There is no significant difference between pH 6.5 and 7.6 in the wild-type transporter and, on the whole, it can be said that this form is substantially pH insensitive.
Figure 9. pH effect on I–V relationship for transport-associated current.
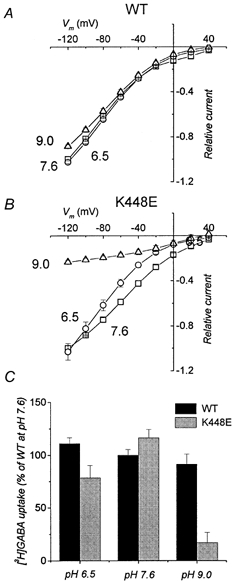
Average values are shown for wild-type (A) and mutated (B) transporter. Data were normalized to the value at −120 mV and pH 7.6 for each oocyte before averaging (mean values ±s.e.m., n = 8 for wild-type; n = 10 for K448E). C, uptake of [3H]GABA in oocytes expressing wild-type or K448E mutated form of rGAT1 at different pH values. While in wild-type no significant difference can be seen at the various pH values, in the K448E form transport is partially reduced at pH 6.5 (P < 0.01) and strongly inhibited at pH 9.0 (P < 0.001). Oocytes from the same batch; bars represent s.e.m.(n = 6).
As shown in Fig. 9B, changing the pH strongly alters the I–V characteristics of the transport-associated current of the mutated transporter: acidification increases the curvature of the I–V relationship leading to a significant decrease in most of the explored voltage range. Alkalinization to pH 9.0 also reduces the transport-associated currents with a surprisingly strong action.
To check whether the decreased transport-associated current exhibited by K448E at pH 9.0 corresponded to an inhibition of GABA transport, we performed measurements of [3H]GABA uptake. Although the conditions of these experiments are not strictly the same as the electrophysiological ones, since the membrane voltage is not under control, the results, illustrated in Fig. 9C, confirm qualitatively those on the transport-associated current. A partial inhibition of [3H]GABA uptake occurs in the K448E mutant at pH 6.5, with a strong inhibition at pH 9.0, while in wild-type the uptake is not significantly affected by pH.
The time course of the transport-associated current of the mutated transporter at pH 9.0 (Fig. 7B) recalls a condition of partial activation of the transporter, as when the GABA concentration is low, and therefore there are two populations of transporters: one with no bound GABA, giving rise to transient currents and the other, with bound GABA generating transport-associated currents.
To verify this idea, we have tried to measure the GABA apparent affinity of the mutated transporter at different pH values. The results are shown in Fig. 10, where it can be seen that this hypothesis is confirmed. In the mutated transporter the pH value strongly influences the apparent affinity for GABA: the GABA concentration for half-maximal current, which is 20 μm at −60 mV and pH 7.6 (see above), becomes 129 μm at pH 9.0 and 9.5 μm at pH 6.5, at the same voltage.
Figure 10. GABA dependence of transport-associated current at different pH values in K448E isoform.
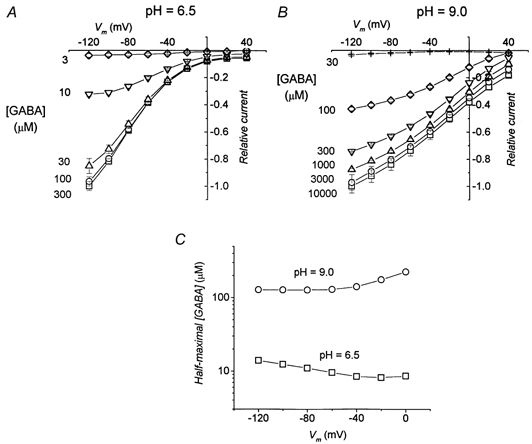
A and B, average currents induced by application of the indicated amount of GABA at pH 6.5 and 9.0, respectively; before averaging, data were normalized to the current at −120 mV and saturating GABA for each oocyte. Data are means ±s.e.m., n = 6 for both panels. In C, the values of GABA concentration giving rise to half-maximal currents are plotted for each potential. Dose-response curves were fitted with Hill equations.
The results of Fig. 10 clearly show that pH has a strong effect on the apparent affinity of the mutated transporter for GABA. At pH 9.0, a much higher GABA concentration is needed to produce the same amount of transport-associated current than at a neutral pH and even more compared to pH 6.5.
Finally, we have tried to determine whether the apparent affinity change for GABA was due to a direct effect of pH on the transporter or if it was mediated by the effect of pH on local Na+ concentration. To answer this question, we have measured the GABA apparent affinity at pH 7.6, but with an external Na+ bulk concentration reduced to 50 mm (TMA+ substitution). This condition should produce in the K448E transporter a local Na+ concentration equivalent to that estimated at bulk Na+ of 98 mm and pH 6.5 (see Discussion).
The results are shown in Fig. 11, where it can be seen that, in these conditions, the half-maximal current is obtained with a GABA concentration of 30 μm at −60 mV, a value slightly greater than that obtained in Fig. 6 with 98 mm Na+ and pH 7.6, and quite far from the value measured with 98 mm Na+ at pH 6.5 (Fig. 10A and C).
Figure 11. GABA apparent affinity at reduced Na+ concentration in K448E transporter.
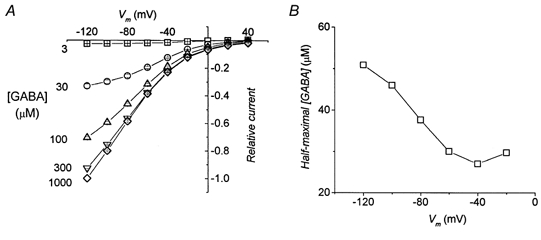
A, transport-associated currents elicited by various GABA concentrations in oocytes bathed in 50 mm Na+, at pH 7.6 (means ±s.e.m., 6 oocytes from the same batch). B, GABA concentrations giving half-maximal currents as a function of potential.
Therefore, this last experiment suggests that the GABA apparent affinity is directly regulated by pH and is not secondary to local Na+ concentration changes.
DISCUSSION
In this work we have performed mutations on the extracellular loop 5 of rGAT1, in an attempt to identify regions involved in the interaction with substrates. As explained above, the oocytes injected with mRNA coding for F447P were not functional; in Y452E and K448E both pre-steady-state and transport-associated currents were preserved; however, while in Y452E acidic pH caused a progressive decrease in transient and transport-associated currents (not shown), in K448E the effects of pH were more characteristic and amenable to interesting interpretations. Therefore, we have concentrated our attention on K448E: on this mutated form pH has the effect of shifting the pre-steady-state currents along the voltage axis, while the effects on the transport-associated currents are more complex; however, these may actually have a rather simple interpretation, as discussed below, and may lead to a new hypothesis on the structure of the transporter.
Charge vs. voltage curves in the mutated transporter and their shift by pH
The Q–V curve at pH 7.6 in the mutated transporter is shifted to more positive voltages compared to that of wild-type, without changes in slope or Qmax (Fig. 3 and Table 2). A similar shift without change in slope or Qmax is seen when the external Na+ is changed. These Na+-dependent shifts of the charge movement in rGAT1 were first described by Lester and co-workers in their pioneering work on the analysis of transient currents in cotransporters (Mager et al. 1996). To explain these observations, they proposed an interpretation based on a combination of Hill (Na+ binding) and Boltzmann (charge movement) equations (Mager et al. 1993, 1996), implying that these two processes are tightly coupled.
Writing the slope factor and the half-charge voltage according to eqns (1) and (2):
 |
and it follows that the constancy of the slope indicates that the product of the number of charges involved in generating the pre-steady-state currents multiplied by the electrical distance (δ) does not change in the mutated transporter, and that the shift can be accounted for either by an apparent change in Na+ concentration near the transporter, or by an opposite change in the Na+ dissociation constant, KNa.
These considerations may then be extended to the effects of pH on the Q–V curves of the mutated transporter that do not involve the slope, but only the position on the voltage axis.
Effect on rate constants
The time constants of the relaxations are shifted by pH similarly to the charge vs. voltage curves, and these two relationships may be used to estimate the voltage dependence of the unidirectional rate constants of the charge movement, on the assumption that this occurs mainly between two states. The result illustrated in Fig. 8 shows that only the rate constant for the inward movement of charges (β) is actually different between wild-type and mutated transporter; in addition, only β is affected by pH. The rate constant for the outward movement of charges (α) remains unchanged in the mutated transporter and it is not affected by pH.
This result may be interpreted in different ways: (i) the mutation might have caused a conformational change implying a higher value of β and conferring pH sensitivity to this rate constant; (ii) the presence of glutamate in place of lysine may have introduced competition between H+ and Na+ for a binding site and (iii) the EL5 loop might take part in forming a restricted volume, outside the membrane electrical field, where the Na+ concentration may be controlled by charged residues and by their protonation state.
We are particularly attracted by the last possibility; in this case, in fact, the inward rate constant would feel the effect of mass action law, while the outward rate constant would not, since the unbinding from the site is a unimolecular event.
Indeed, in the mutated transporter, the local Na+ concentration could be influenced by the electrical field generated by the negatively charged glutamate 448 and aspartate 451. This would create a local microenvironment in which positive charges might be more concentrated than in the bulk solution. Changing the pH would modify the titration state of these two residues, modulating the local concentration of Na+ in such a way that at low pH, protons would effectively screen the negative charges of the residues, reducing the presence of Na+, while the opposite would occur at alkaline pH.
Quantitatively, this effect could be quite large: it can be calculated (Hille, 1992; chapter 16) that a single negative charge at the membrane-solution interface has the effect of increasing twofold the bulk cation concentration at a distance of about 8 Å and tenfold at about 4 Å. In this case, low pH will correspond to a decreased sodium concentration, while high pH will correspond to an increased sodium concentration.
Effects on GABA apparent affinity
The changes in the apparent affinity for the organic substrate are more difficult to explain: the attempt we have made to verify whether this was an indirect effect of the putative changes in local Na+ concentration (Fig. 11) gave a negative result. Our interpretation is therefore that the K448E substitution directly influences GABA binding. Indeed Tamura et al. (1995) had already observed that mutation of three residues (including K448) in EL5 of rGAT1 resulted in altered binding of organic substrate.
Reconstruction of the modifications of the transport-associated current
The effects of pH on the transport-associated current are more complex than those on the pre-steady-state currents. However, they can be explained on the basis of the interpretation used for the charge vs. voltage relationships, with the integration of the effect on the GABA apparent affinity.
Figure 5D shows that changing the external Na+ concentration shifts the charge vs. voltage curve and the I–V relationship for the transport-associated current by very similar amounts. This result, that repeats the observation of Mager et al. (1996), indicates that voltage acts in the same way on the pre-steady-state currents and on the transport-associated currents, and therefore that the voltage-sensitive step is substantially unaffected by the presence or absence of GABA. Furthermore, voltage acts in the same way on wild-type and mutated transporter, indicating that the mutation has not introduced alterations in the state transitions involving voltage.
We have then tried to reproduce the effects caused by the mutation and by pH on the transport-associated current of the mutated transporter on the basis of altered substrate concentrations and/or affinities.
To do so, we have re-plotted in Fig. 12A the I–V relationships shown in Fig. 2C for the transport-associated current recorded in wild-type and mutated transporters at pH 7.6, after normalization to their respective values at −120 mV.
Figure 12. Reconstruction of effects of K448E mutation and pH on the transport-associated current.

A, normalized currents for wild-type (□) and mutated (○) transporters at pH 7.6. B, normalized current for mutated transporter at pH 7.6 (○) and pH 9.0 (▵). C, normalized current for mutated transporter at pH 7.6 (○) and pH 6.5 (▿). After fitting an arbitrary sigmoidal function I =f(V) to the squares in A (continuous line), the other curves in the figure were obtained by shift and scaling operations: I’ =kf(V+ΔV). In A, ΔV = +20 mV (dotted line) and k = 0.88 (dashed line through ○ symbols). In B, ΔV = +40 mV (dotted line) and k = 0.19 (dashed line through ▵ symbols). In C, ΔV = −4 mV (dotted line) and k = 1.0 (dashed line through ▿ symbols).
In this way, the curve for the mutated transporter appears to be shifted to the right and slightly scaled down compared with the wild-type curve. This is in line with the interpretation given above to explain the shift of the Q–V curves, concerning the possibility of a greater local concentration of Na+ (causing the positive shift), but requires that the GABA apparent affinity should be lower than in the wild-type transporter (causing a proportional reduction of current at each potential). Indeed, the results shown in Fig. 6 indicate a reduced apparent affinity for GABA exhibited by the mutated transporter at pH 7.6. Furthermore, as shown in Fig. 10, pH alters this apparent affinity, which is strongly reduced at alkaline pH and increased at acid pH.
In Fig. 12B the I–V curves for the mutated transporter are shown for pH 7.6 and 9.0, while in Fig. 12C the curves for pH 7.6 and 6.5 are plotted.
Although different kinds of models have been proposed to simulate the operation of cotransporters (Parent et al. 1992; Su et al. 1996; Loo et al. 1998; Lu & Hilgemann, 1999), we have preferred at this stage to reconstruct all the curves shown in Fig. 12 in a model-independent way, fitting, as a starting point, an arbitrary sigmoidal function to the wild-type curve at pH 7.6 (squares in Fig. 12A). The same function was then used to obtain all the other curves in Fig. 12 simply by shifting and scaling operations, in which shifting represents the action of the effective Na+ concentration, and scaling represents the changes in GABA apparent affinity.
The curve through the circles in Fig. 12A has been obtained using a shift of +20 mV, and a scaling factor of 0.88. The curve through the upright triangles in Fig. 12B has been obtained with a further shift of +20 mV, and scaling factor of 0.19; finally, the curve through the inverted triangles in Fig. 12C was calculated using a shift of −4 mV and a scaling factor of 1.0. All the values of the shifts correspond to those determined for the same conditions, but in the absence of GABA (see Table 2).
Clearly the reconstructed curves correspond quite nicely to the experimental points and therefore all the effects induced by the mutation and by pH on both pre-steady-state and transport-associated currents can be accounted for by shifts and scaling, i.e. by effects of Na+ concentration and GABA apparent affinity or concentration.
Comparison with other cotransporters
As mentioned in the Introduction, the effects of pH on transporters are rather variable: both potentiation and inhibition of transport-associated current have been observed in different transporters (Cao et al. 1997, 1998; Peres & Bossi, 2000). In their studies leading to the identification of the role of lysine 490 in hSERT, Cao et al. (1997, 1998) reported only an inhibition of transient currents by acidic pH in wild-type rSERT and no apparent effects of pH in rSERT mutated in the fifth extracellular loop; however, they did not study the voltage dependence of the charge movement and therefore shifts could have been missed. The potentiation induced by low pH to the transport-associated current in wild-type rSERT (Cao et al. 1997) and in K490T hSERT (Cao et al. 1998) is consistent with our finding that in rGAT K448E acidic pH increases the apparent affinity for the organic substrate.
Acidic pH has the effect of blocking rather than shifting the transient currents of the lepidopteran intestinal transporter KAAT1 (Peres & Bossi, 2000); we have seen a similar effect in Y452E (not shown), confirming the relevance of the fifth extracellular loop in pH regulation.
A conspicuous shift in the charge vs. voltage relationship has been reported by Mager et al. (1996) in the mutant W68L of rGAT1 compared to wild-type; this effect was attributed to an increased apparent affinity for Na+, however the effect of pH was not tested on this mutant. On the other hand, W68L rGAT1 was inefficient in substrate translocation, both conditions being therefore analogous to those observed in our K448E mutation, especially at alkaline pH.
pH-induced shifts in the charge vs. voltage curve have been reported for the oligopeptide cotransporter Pept1 (Nussberger et al. 1997) and for the human Na+-glucose transporter hSGLT1 (Quick et al. 2001). Interestingly, the effects of pH on charge movement in these two transporters are opposite to those observed in our K448E mutant: i.e. in Pept1 and in hSGLT1 acidic pH induced a positive shift of the Q–V and τ-V curves. However, Pept1 is driven by protons and not by Na+, and hSGLT1 can be driven by both Na+ and H+; therefore these effects are perfectly consistent with the predictions of eqn (2) in which, in this case, the Na+ concentration must be replaced by the proton concentration.
The specific effects of the K448E mutation and the more general inhibition seen in the Y452E form suggest that the extracellular loop 5 of rGAT1 may take part in forming a sort of ‘vestibule’, where Na+ ions must have access before the charge-moving transition could take place. The extracellular loop 5 may then participate, most likely in co-operation with other transporter regions, in regulating the interaction of both inorganic and organic substrates.
Acknowledgments
We wish to thank Drs H. A. Lester and C. Labarca for the generous gift of rGAT cDNA. The invaluable help of Mrs Felli, Mrs Paccioretti and Mrs Rocchi is greatly appreciated.
References
- Adkins EM, Barker EL, Blakely RD. Interactions of tryptamine derivatives with serotonin transporter species variants implicate transmembrane domain I in substrate recognition. Molecular Pharmacology. 2001;59:514–523. doi: 10.1124/mol.59.3.514. [DOI] [PubMed] [Google Scholar]
- Barker EL, Moore KR, Rakhshan F, Blakely RD. Transmembrane domain I contributes to the permeation pathway for serotonin and ions in the serotonin transporter. Journal of Neuroscience. 1999;19:4705–4717. doi: 10.1523/JNEUROSCI.19-12-04705.1999. [DOI] [PMC free article] [PubMed] [Google Scholar]
- Barker EL, Perlman MA, Adkins EM, Houlihan WJ, Pristupa ZB, Niznik HB, Blakely RD. High affinity recognition of serotonin transporter antagonists defined by species-scanning mutagenesis. Journal of Biological Chemistry. 1998;273:19459–19468. doi: 10.1074/jbc.273.31.19459. [DOI] [PubMed] [Google Scholar]
- Bossi E, Centinaio E, Castagna M, Giovannardi S, Vincenti S, Sacchi VF, Peres A. Ion binding and permeation through the lepidopteran amino acid transporter KAAT1 expressed in Xenopus oocytes. Journal of Physiology. 1999;515:729–742. doi: 10.1111/j.1469-7793.1999.729ab.x. [DOI] [PMC free article] [PubMed] [Google Scholar]
- Buck KJ, Amara SG. Chimeric dopamine-norepinephrine transporters delineate structural domains influencing selectivity for catecholamines and 1-methyl-4-phenylpyridinium. Proceedings of the National Academy of Sciences of the USA. 1994;91:12548–12588. doi: 10.1073/pnas.91.26.12584. [DOI] [PMC free article] [PubMed] [Google Scholar]
- Cao Y, Li M, Mager S, Lester HA. Amino acid residues that control pH modulation of transport-associated current in mammalian serotonin transporters. Journal of Neuroscience. 1998;18:7739–7749. doi: 10.1523/JNEUROSCI.18-19-07739.1998. [DOI] [PMC free article] [PubMed] [Google Scholar]
- Cao Y, Mager S, Lester HA. H+ permeation and pH regulation at a mammalian serotonin transporter. Journal of Neuroscience. 1997;17:2257–2266. doi: 10.1523/JNEUROSCI.17-07-02257.1997. [DOI] [PMC free article] [PubMed] [Google Scholar]
- Castagna M, Shayakul C, Trotti D, Sacchi VF, Harvey WR, Hediger MA. Cloning and characterization of a potassium-coupled amino acid transporter. Proceedings of the National Academy of Sciences of the USA. 1998;95:5395–5400. doi: 10.1073/pnas.95.9.5395. [DOI] [PMC free article] [PubMed] [Google Scholar]
- Chen J-G, Chen SL, Rudnick G. Determination of external loop topology in the serotonin transporter by site-directed chemical labeling. Journal of Biological Chemistry. 1998;273:12675–12681. doi: 10.1074/jbc.273.20.12675. [DOI] [PubMed] [Google Scholar]
- Chen J-G, Rudnick G. Permeation and gating residues in serotonin transporter. Proceedings of the National Academy of Sciences of the USA. 2000;97:1044–1049. doi: 10.1073/pnas.97.3.1044. [DOI] [PMC free article] [PubMed] [Google Scholar]
- Chen J-G, Sachpatzidis A, Rudnick G. The third transmembrane domain of the serotonin transporter contains residues associated with substrate and cocaine. Journal of Biological Chemistry. 1997;272:28321–28327. doi: 10.1074/jbc.272.45.28321. [DOI] [PubMed] [Google Scholar]
- dela Horra C, Hernando N, Lambert G, Forster I, Biber J, Murer H. Molecular determinants of pH sensitivity of the type IIa Na/Pi-cotransporter. Journal of Biological Chemistry. 2000;275:6284–6287. doi: 10.1074/jbc.275.9.6284. [DOI] [PubMed] [Google Scholar]
- Giros B, Wang Y-M, Suter S, McLeskey SB, Pifl C, Caron MG. Delineation of discrete domains for substrate, cocaine, and tricyclic antidepressant interactions using chimeric dopamine-norepinephrine transporters. Journal of Biological Chemistry. 1994;269:15985–15988. [PubMed] [Google Scholar]
- Hille B. Ionic Channels of Excitable Membranes. 2. Sunderland, MA, USA: Sinauer Associates; 1992. [Google Scholar]
- Hirayama BA, Loo DDF, Wright EM. Protons drive sugar transport through the Na+/glucose cotransporter (SGLT1) Journal of Biological Chemistry. 1994;269:21407–21410. [PubMed] [Google Scholar]
- Keshet GI, Bendahan A, Su H, Mager S, Lester HA. Glutamate-101 is critical for the function of the sodium and chloride-coupled GABA transporter GAT-1. FEBS Letters. 1995;371:39–42. doi: 10.1016/0014-5793(95)00859-8. [DOI] [PubMed] [Google Scholar]
- Loo DDF, Hirayama BA, Gallardo EM, Lam JT, Turk E, Wright EM. Conformational changes couple Na+ and glucose transport. Proceedings of the National Academy of Sciences of the USA. 1998;95:7789–7794. doi: 10.1073/pnas.95.13.7789. [DOI] [PMC free article] [PubMed] [Google Scholar]
- Lu C-C, Hilgemann DW. GAT1 (GABA:Na+:Cl−) cotransport function. Database reconstruction with an alternating access model. Journal of General Physiology. 1999;114:459–475. doi: 10.1085/jgp.114.3.459. [DOI] [PMC free article] [PubMed] [Google Scholar]
- Mager S, Kleinberger-Doron N, Keshet GI, Davidson N, Kanner BI, Lester HA. Ion binding and permeation at the GABA transporter GAT1. Journal of Neuroscience. 1996;16:5405–5414. doi: 10.1523/JNEUROSCI.16-17-05405.1996. [DOI] [PMC free article] [PubMed] [Google Scholar]
- Mager S, Naeve J, Quick M, Labarca C, Davidson N, Lester HA. Steady states, charge movements, and rates for a cloned GABA transporter expressed in Xenopus oocytes. Neuron. 1993;10:177–188. doi: 10.1016/0896-6273(93)90309-f. [DOI] [PubMed] [Google Scholar]
- Masson J, Sagné C, Hamon M, El Mestikawy S. Neurotransmitter transporters in the central nervous system. Pharmacological Reviews. 1999;51:439–464. [PubMed] [Google Scholar]
- Nussberger S, Steel A, Trotti D, Romero MF, Boron WF, Hediger MA. Symmetry of H+ binding to the intra- and extracellular side of the H+-coupled oligopeptide cotransporter PepT1. Journal of Biological Chemistry. 1997;272:7777–7785. doi: 10.1074/jbc.272.12.7777. [DOI] [PubMed] [Google Scholar]
- Palacín M, Estévez R, Bertran J, Zorzano A. Molecular biology of mammalian plasma membrane amino acid transporters. Physiological Reviews. 1998;78:1054. doi: 10.1152/physrev.1998.78.4.969. [DOI] [PubMed] [Google Scholar]
- Parent L, Supplisson S, Loo DDF, Wright EM. Electrogenic properties of the cloned Na+/glucose cotransporter: II. A transport model under nonrapid equilibrium conditions. Journal of Membrane Biology. 1992;125:63–79. doi: 10.1007/BF00235798. [DOI] [PubMed] [Google Scholar]
- Peres A, Bossi E. Effects of pH on the uncoupled, coupled and pre-steady-state currents at the amino acid transporter KAAT1 expressed in Xenopus oocytes. Journal of Physiology. 2000;525:83–89. doi: 10.1111/j.1469-7793.2000.t01-1-00083.x. [DOI] [PMC free article] [PubMed] [Google Scholar]
- Quick M, Loo DDF, Wright EM. Neutralization of a conserved amino acid residue in the human Na+/glucose transporter (hSGLT1) generates a glucose-gated H+ channel. Journal of Biological Chemistry. 2001;276:1728–1734. doi: 10.1074/jbc.M005521200. [DOI] [PubMed] [Google Scholar]
- Sonders MS, Zhu SJ, Zahniser NR, Kavanaugh MP, Amara SG. Multiple ionic conductances of the human dopamine transporter: the actions of dopamine and psychostimulants. Journal of Neuroscience. 1997;17:960–974. doi: 10.1523/JNEUROSCI.17-03-00960.1997. [DOI] [PMC free article] [PubMed] [Google Scholar]
- Su A, Mager S, Mayo SL, Lester HA. A multi-substrate single-file model for ion-coupled transporters. Biophysical Journal. 1996;70:762–777. doi: 10.1016/S0006-3495(96)79616-9. [DOI] [PMC free article] [PubMed] [Google Scholar]
- Tamura S, Nelson H, Tamura A, Nelson N. Short external loops as potential substrate binding site of γ-aminobutyric acid transporters. Journal of Biological Chemistry. 1995;270:28712–28715. doi: 10.1074/jbc.270.48.28712. [DOI] [PubMed] [Google Scholar]
- Yu N, Cao YW, Mager S, Lester HA. Topological localization of cysteine 74 in the GABA transporter, GAT1, and its importance in ion binding and permeation. FEBS Letters. 1998;426:174–178. doi: 10.1016/s0014-5793(98)00333-0. [DOI] [PubMed] [Google Scholar]


