

Abstract
Nodose ganglion neurones (NGNs) become less excitable following section of the vagus nerve. To determine the role of sodium currents (INa) in these changes, standard patch-clamp recording techniques were used to measure INa in rat NGNs maintained in vivo for 5–6 days following vagotomy, and then in vitro for 2–9 h.
Total INa and INa density in vagotomized NGNs were similar to control values. However, steady-state INa inactivation in vagotomized NGNs was shifted −9 mV relative to control values (V11/2sol;2, −74 ± 2 vs.−65 ± 2 mV, P < 0.01) and INa activation was shifted by −7 mV (V11/2sol;2, −21 ± 2 vs.−14 ± 2 mV, P < 0.006). INa recovery from inactivation was also slower in vagotomized NGNs (fast time constant, 2.8 ± 0.4 vs. 1.6 ± 0.3 ms, P < 0.02).
The fraction of INa resistant to 1 μm tetrodotoxin (TTX-R) was halved in vagotomized NGNs (21 ± 8 vs. 56 ± 8 % of total INa, P < 0.05). This change from TTX-R INa to TTX-sensitive (TTX-S) INa may explain altered INa activation, inactivation and repriming in vagotomized NGNs.
The contribution of alterations in INa to NGN firing patterns was assessed by measuring INa evoked by a series of action potential (AP) waveforms. In general, control NGNs produced large, repetitive TTX-R INa while vagotomized NGNs produced smaller TTX-S INa that rapidly inactivated during AP discharge. We conclude that TTX-R INa is important for sustained AP discharge in NGNs, and that its diminution underlies the decreased AP discharge of vagotomized NGNs.
Nodose ganglion neurones (NGNs) provide sensory innervation via the vagus nerves to the thoracic and abdominal viscera, including the heart, airway, proximal gastrointestinal tract, liver and aortic baroreceptors (Mei, 1983). We have recently shown (Lancaster et al. 2001) that NGNs, unlike many other types of primary afferent neurones (Nordin et al. 1984; Gallego et al. 1987; Devor, 1994; Kim et al. 1998), become profoundly less excitable within 5 days of the section of their peripheral processes. This decrease in excitability consists of an increase in action potential (AP) threshold (rheobase) of over 200 %, and a dramatic decrease (> 70 %) in AP firing in response to strong, sustained depolarizing current injection. The relatively modest changes in passive membrane properties that occur in NGNs following vagotomy (3 mV more negative resting membrane potential, 35 % increased cell capacitance and 23 % decreased DC membrane input resistance) do not adequately account for their decreased excitability. Changes in voltage-dependent ionic currents are therefore implicated as a likely contributing factor to these changes in excitability.
Sodium currents (INa) are critical for AP discharge in NGNs (Schild et al. 1994; Schild & Kunze, 1997). INa and mRNA for specific sodium channel proteins have been shown to change following axotomy in dorsal root ganglion neurones (DRGNs; Rizzo et al. 1995; Dib-Hajj et al. 1996; Cummins & Waxman, 1997); these changes have been postulated to mediate excitability changes in axotomized somatic afferents (reviewed by Waxman et al. 1999).
INa has been incorporated into a computer model of NGN membrane excitability (Schild et al. 1994; Schild & Kunze, 1997). Based upon this model, and work in DRG afferents, several characteristics of INa may be postulated to affect AP firing patterns. These include the density of INa, INa voltage-dependent activation characteristics, INa voltage-dependent inactivation characteristics, the time course of INa recovery from inactivation (i.e. ‘repriming’), and the relative densities of tetrodotoxin-sensitive (TTX-S) and tetrodotoxin-resistant (TTX-R) INa. In the present work, we examine each of these parameters in vagotomized and control NGNs to determine what role INa may play in shaping the discharge properties of vagotomized NGNs.
Our results with NGNs show that total sodium conductance density was unaffected but TTX-R INa fell by about 50 % following vagotomy. Vagotomized NGNs were unable to generate repeated INa in response to AP waveforms, suggesting that changes in INa are a sufficient cause for their reduced ability to discharge APs. TTX-R INa may be important for sustained AP discharge in NGNs, and its diminution may underlie the decreased AP discharge of vagotomized NGNs.
METHODS
Vagotomy
Vagus nerve transection (vagotomy) was elicited by unilaterally removing a section of the right or left cervical vagus nerve of adult (200–300 g), male Sprague-Dawley rats, as approved by the Institutional Animal Care and Use Committee of the University of Maryland, Baltimore. Under ketamine (50 mg kg−1)-xylazine (10 mg kg−1) anaesthesia (i.p.), a 5 mm section of the vagus nerve was removed approximately 1 cm distal (caudal) to the right or left inferior vagal (nodose) ganglion. This operation severed the afferent processes of approximately 90 % of the NGNs on the operated side (with the remainder projecting their afferents via the superior laryngeal nerve, proximal to the nerve injury). Ganglia were maintained for 5–6 days in vivo following vagotomy, then rats were killed by exposure to CO2 gas and nodose ganglia were removed bilaterally. Previous work has revealed consistent changes in the excitability of vagotomized NGNs 5 days and longer following vagotomy (Lancaster et al. 2001).
Dissociation
NGNs were dissociated enzymatically as described previously (Jafri et al. 1997). Briefly, ganglia were rapidly removed from animals, desheathed and then incubated in enzyme solution (10 mg collagenase type 1A (Sigma), 10 mg dispase II (Boehringer Mannheim) in 10 ml Ca2+- and Mg2+-free Hanks’ balanced salt solution) for 2 h at 37 °C. Neurones were dissociated by trituration, washed by centrifugation (3 times at 700 g for 45 s), suspended in L15 medium (Gibco) containing 10 % fetal bovine serum (JRH Biosciences, Lenexa, KS, USA), then transferred onto circular 15 mm glass coverslips (Bellco Glass Inc., Vineland, NJ, USA) coated with poly-d-lysine (0.1 mg ml−1, Sigma). NGNs adhered to coverslips and were maintained in vitro for 2–9 h following plating at 37 °C prior to recording.
Patch-clamp recording
Whole-cell patch-clamp techniques (Hamill et al. 1981) were employed with an Axopatch 200B amplifier and pCLAMP 7 software (Axon Instruments, Union City, CA, USA). Patch pipettes (1–4 MΩ), were fabricated from borosilicate glass capillaries (TW150F-4, World Precision Instruments, Sarasota, FL, USA) on a Narishige pp-83 puller (Narishige, Tokyo, Japan). Pipettes were filled with a variant of a solution described previously (Gold et al. 1998) for INa recording, with a composition of (mm): 100 CsCl, 40 TEA-Cl, 10 NaCl, 1 CaCl2, 2 MgCl2, 11 EGTA, 10 Hepes; pH was adjusted to 7.2 with CsOH, and the osmolality was adjusted to 310 mosmol kg−1 with sucrose. All chemicals were from Sigma, except dextrose, sucrose, CaCl2 and MgCl2, which were from J. T. Baker (Phillipsburg, NJ, USA). Pipette voltage offset was neutralized prior to the formation of a gigaseal. Membrane input resistance (Rin), series resistance (Rs) and capacitance were determined from current transients elicited by 5 mV depolarizing steps from a holding potential of −60 mV, via the ‘membrane test’ application of pCLAMP 7. Capacitance compensation and 80 %Rs compensation were used. Criteria for cell inclusion in the study were: Rs < 5 MΩ, Rin > 100 MΩ, and stable recording with 80 %Rs compensation during the entire experiment. A P/6 protocol was used for leak subtraction. Coverslips were superfused (2–4 ml min−1) continuously during recording with room temperature (22–24 °C) external solution previously used for INa recording (Gold et al. 1998) with a composition of (mm): 35 NaCl, 30 TEA-Cl, 65 choline chloride, 0.1 CaCl2, 5 MgCl2, 10 Hepes, 10 glucose; pH was adjusted to 7.4 with CsOH, and osmolality was adjusted to 320 mosmol kg−1 with sucrose. Under these recording conditions, the estimated Nernst reversal potential for sodium was +33 mV. The recording chamber was grounded via a 3 m KCl-agar bridge. Tetrodotoxin (TTX, Sigma) was diluted in external solution to a working concentration of 1 μm from a 1 mm stock prepared in distilled water and stored at 4 °C.
Statistical methods
Properties of NGNs associated with a cut vagus (NGNs vagotomized for 5–6 days) were compared with properties of NGNs from the contralateral (control) ganglia using Sigmastat software (Jandel Scientific, San Rafael, CA, USA). Previous work showed that the electrical membrane properties of contralateral NGNs were similar to those of NGNs from unoperated animals (Lancaster et al. 2001). The effects of treatment and intra-animal variation on NGN properties were measured using a two-way ANOVA.
To compare the voltage-dependent activation and inactivation of INa, activation and inactivation curves from individual NGNs were fitted with sigmoidal (Boltzmann) functions using Microcal Origin 6.0 software (Microcal Software Inc., Northampton, MA, USA). For each curve two parameters were determined: V11/2sol;2, the voltage of half-activation, and Ks, the slope. The parameters of vagotomized and control NGNs were compared statistically using ANOVA or ANOVA on ranks, as appropriate.
The recovery from inactivation of INa (as a function of recovery time) was fitted with an exponential function with two components (e.g. as a process with two time constants) using Origin software or Sigmaplot software (Jandel). The relative magnitude of the fast and slow components, and the fast and slow time constants were determined for each NGN. The values of control and vagotomized NGNs were compared statistically using ANOVA or ANOVA on ranks.
Unless stated otherwise, mean values are presented ±s.e.m.P < 0.05 was considered significant for all tests.
RESULTS
Nerve injury-induced changes in INa expression have been firmly established in rat DRG neurones. These changes include the down-regulation of TTX-R INa, and up-regulation of a rapidly repriming TTX-S INa (Waxman et al. 1999). In the present experiments, INa expression was examined in NGNs acutely isolated from control and vagotomized adult rat nodose ganglia.
Slowly conducting primary afferents, including NGNs, often possess both TTX-R and TTX-S INa (Bossu & Feltz, 1984; Ikeda et al. 1986; Roy & Narahashi, 1992; Elliott & Elliott, 1993). The relative expression of these two types of INa is thought to strongly influence AP discharge patterns in NGNs (Schild & Kunze, 1997) and DRGNs (Waxman et al. 1999). Accordingly, we examined each of these two types of INa in vagotomized and control NGNs.
Voltage-dependent INa activation and magnitude
INa and GNa were quantified in vagotomized (n = 26) and control (n = 24) NGNs isolated from the nodose ganglia of six rats that were vagotomized 5–6 days previously. We selected this time point because vagotomized NGNs are dramatically less excitable than control NGNs 5 days after vagotomy (Lancaster et al. 2001). The voltage-dependent activation and magnitude of total, TTX-R and TTX-S INa were determined as illustrated in Fig. 1. NGNs were voltage clamped at a membrane potential of −100 mV to remove INa inactivation and then the membrane potential was stepped to various potentials positive to −100 mV to activate INa. Peak INa and GNa as functions of membrane potential were determined for each NGN. The maximal GNa and GNa density (sodium conductance per unit surface area) were also computed for each NGN. Repeating the voltage-clamp protocol in the presence of TTX (1 μm) allowed the magnitude and activation properties of the TTX-R component of INa to be quantified. Subtraction of TTX-R INa from total INa permitted the magnitude and activation characteristics of the TTX-S component of INa to be examined separately. TTX-R INa, as reported previously (Ikeda et al. 1986), activated over a more depolarized voltage range than did TTX-S INa. Control NGNs often exhibited substantial amounts of both TTX-R and TTX-S INa and their activation characteristics usually represented a compromise between these two components (Fig. 1E, left panel). Vagotomized NGNs, however, usually expressed predominantly TTX-S INa, and their activation characteristics typically reflected only this one component (Fig. 1E, right panel). Activation curves for total INa, TTX-R INa and TTX-S INa were generally well fitted with sigmoidal (Boltzmann) functions (r2 > 0.96 for each), though the TTX-R INa of vagotomized NGNs was usually too small to permit its activation to be quantified.
Figure 1. Sodium current activation in control (left) and vagotomized (right) NGNs.
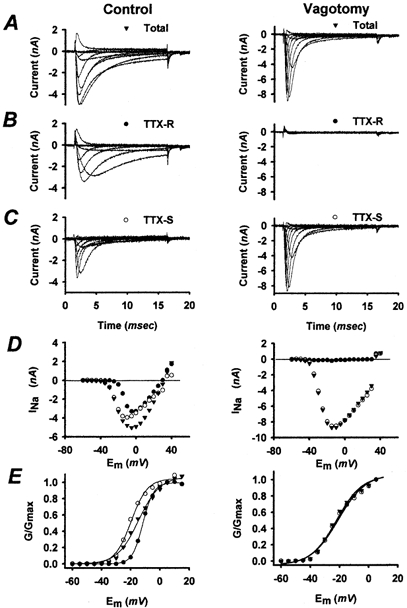
Same control NGN and vagotomized NGN throughout this figure. A, families of sodium currents (INa) elicited from a control and vagotomized NGN by depolarizing membrane potential steps, from −60 to +40 mV in 5 mV increments, after holding the membrane potential at −100 mV for 1 s prior to each depolarizing step (to remove sodium channel inactivation). Some traces have been omitted for clarity. B, tetrodotoxin-resistant (TTX-R) INa in the presence of 1 μm TTX. C, tetrodotoxin-sensitive (TTX-S) INa obtained by subtracting TTX-R INa from total INa. Most vagotomized NGNs, as shown here, had extremely low levels of TTX-R INa (< 5 % of total INa). D, peak TTX-R (•), TTX-S (○) and total (▾) INa are shown as functions of membrane potential (Em) for the control and vagotomized NGNs shown in A–C. Note that INa reverses at approximately +30 mV, the Nernst potential calculated for the sodium concentrations in the pipette and the extracellular solution (see Methods). E, peak sodium conductance (GNa), normalized to the maximum sodium conductance is shown for the TTX-R, TTX-S and total INa of the control NGN and for the total and TTX-S INa of the vagotomized NGN. The TTX-R component of most vagotomized NGNs was too small to permit analysis of its voltage-dependent activation. The voltage-dependent activation of each component of INa shown in E was well fitted (continuous lines) with a Boltzmann function (r2 > 0.99 for each).
As illustrated in Fig. 2A, INa activation generally occurred over a more hyperpolarized voltage range in vagotomized NGNs than in control NGNs. In order to quantify this difference in the voltage-dependent activation of INa, the peak conductance-voltage relationships generated (as illustrated in Fig. 1E) for each NGN were fitted with sigmoidal (Boltzmann) functions (r2 > 0.96 for each). The voltage of half-maximal activation (V11/2sol;2) and the slope (Ks) from the activation curves of control and vagotomized NGNs were compared statistically. The V11/2sol;2 of vagotomized NGNs (−21 ± 2 mV, n = 26) was significantly (P < 0.006) more hyperpolarized than the V11/2sol;2 of control NGNs (−14 ± 2 mV, n = 22). The Ks values of control (8.4 ± 0.5 mV) and vagotomized (8.3 ± 0.6 mV) activation curves were not significantly different (P = 0.73).
Figure 2. Population data for sodium conductance activation and inactivation in control (•) and vagotomized (○) NGNs.
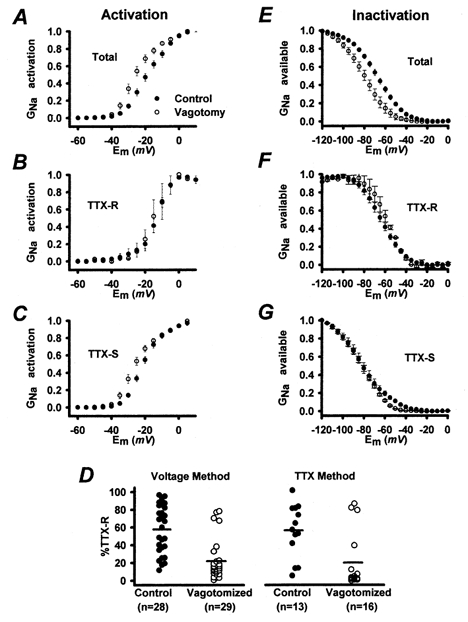
A, GNa activation in vagotomized (n = 26) and control (n = 22) NGNs. GNa activation curves for control and vagotomized NGNs were generated as illustrated in Fig. 1, fitted with Boltzmann functions and compared statistically as described in the text. B, activation of TTX-R GNa in control (n = 8) and vagotomized (n = 3) NGNs. C, activation of TTX-S GNa in control (n = 13) and vagotomized (n = 10) NGNs. D, the percentage of the total GNa that was TTX resistant was measured using two methods: a voltage method in which TTX-S GNa was inactivated with a −50 mV prepulse, and a pharmacological method in which 1 μm TTX was added. Vagotomized NGNs had a significantly lower percentage TTX-R GNa than control NGNs, whether measured by the voltage method (22 ± 4 vs. 58 ± 5 %, P < 0.0001) or the TTX method (21 ± 8 vs. 56 ± 8 %, P < 0.05). E, mean GNa inactivation in vagotomized (n = 13) and control (n = 12) NGNs. Steady-state inactivation curves were generated as shown in Fig. 3, fitted with Boltzmann functions and compared statistically as described in the text. F, the population averages for TTX-R GNa inactivation in vagotomized (n = 2) and control (n = 7) NGNs. G, mean TTX-S GNa inactivation in vagotomized (n = 9) and control (n = 8) NGNs. Error bars depict ±s.e.m. Here and in subsequent figures some error bars are masked by the symbols.
The activation characteristics of TTX-R INa in control NGNs and the few vagotomized NGNs with measurable TTX-R INa are compared in Fig. 2B. The V11/2sol;2 of activation for TTX-R INa in vagotomized NGNs (−17 ± 1 mV, n = 3) was significantly (P < 0.05) more hyperpolarized than the V11/2sol;2 of activation in control NGNs (−12 ± 1 mV, n = 8). Ks values were similar in control (3.8 ± 0.2 mV, n = 8) and vagotomized (5.2 ± 1.3 mV, n = 3) NGNs.
The activation of TTX-S INa in control and vagotomized NGNs is compared in Fig. 2C. The V11/2sol;2 of activation for TTX-S INa in vagotomized NGNs (−24 ± 2 mV, n = 10) was significantly (P < 0.05) more hyperpolarized than that in control NGNs (−20 ± 1 mV, n = 13). Ks values were similar in control (5.5 ± 0.4 mV, n = 13) and vagotomized (5.4 ± 0.4 mV, n = 10) NGNs.
Taken together, these results indicate that the more hyperpolarized voltage-dependent activation of INa in vagotomized NGNs arises partly due to their lower proportion of TTX-R INa, and partly due to changes in the voltage-dependent activation of both TTX-R and TTX-S INa in vagotomized NGNs.
Amounts of TTX-R and TTX-S INa in control and vagotomized NGNs
There was a trend (P = 0.06) towards increased total GNa in vagotomized NGNs (155 ± 16 nS) compared with control NGNs (108 ± 18 nS). To determine whether this increase in total GNa reflected increased density of GNa or merely increased membrane surface area, GNa was normalized with respect to cell capacitance (a surrogate for surface area). GNa density (sodium conductance normalized with respect to cell membrane surface area) was similar (P = 0.6) in control (3.3 ± 0.5 nS pF−1) and vagotomized (3.8 ± 0.5 nS pF−1) NGNs. These results may not be entirely representative of the total NGN population; several (∼10–20 %) vagotomized cells were excluded because they had extremely large (> 10 nA) INa, which could not be adequately voltage clamped.
In order to quantify the effects of vagotomy on the amounts of TTX-S and TTX-R INa, we employed two independent methods to measure these currents. In the first method, the ‘voltage’ method, a recording protocol was employed to separate the two currents based on their differing steady-state inactivation characteristics (Gold et al. 1998). To measure the activation of total INa, we depolarized NGNs from a holding membrane potential of −100 mV, a voltage at which most GNa is not inactivated (as in Fig. 1A). To selectively measure TTX-R INa, a similar protocol was repeated with a holding potential of −50 mV, a membrane potential that inactivates most of the TTX-S GNa but does not inactivate most of the TTX-R GNa. Measured by the voltage method, the amount of TTX-R GNa was significantly (P < 0.01) reduced in vagotomized NGNs (38 ± 8 nS, n = 26) compared with control values (62 ± 9 nS, n = 24). The density of TTX-R GNa was similarly reduced in vagotomized NGNs (from 1.7 ± 0.2 to 1.0 ± 0.2 nS pF−1, P < 0.01). The percentage of the total sodium conductance that was of the TTX-R variety, by this method, was estimated to be 22 ± 4 % in vagotomized NGNs, compared with 58 ± 5 % in control NGNs (P < 0.0001). The percentage TTX-R sodium conductance is plotted for vagotomized and control NGNs in Fig. 2D. While the contribution of TTX-R GNa in control NGNs appeared highly variable, ranging from < 5 to > 90 % of the total GNa, most (23/29) vagotomized NGNs had low levels of TTX-R GNa below 25 % (Fig. 2D). The others may represent NGNs that project their axons via the superior laryngeal nerve, and thus were not axotomized (see Methods).
In the second method for separating TTX-R and TTX-S INa we used the traditional pharmacological approach; namely, the addition of 1 μm TTX to the bath solution (Fig. 1B). This concentration of TTX is known to inhibit TTX-S INa while leaving TTX-R INa unaffected in adult (Ikeda et al. 1986) and neonate (Schild et al. 1994) rat NGNs. Applied to control NGNs, this concentration of TTX inhibited from < 10 to > 95 % of total GNa (Fig. 2D), confirming that the relative contributions of TTX-R and TTX-S GNa to total GNa are highly variable in control rat NGNs (Ikeda et al. 1986; Bielefeldt, 2000). The percentage of GNa inhibited by TTX was similar to that inhibited by the −50 mV prepulse protocol; vagotomized NGNs again had a significantly (P < 0.05, one-way ANOVA on ranks) lower percentage of TTX-R GNa (21 ± 8 %, n = 16) than control NGNs (56 ± 8 %, n = 13).
The results from the two methods for estimating the percentage of TTX-R GNa were consistent. In 15 vagotomized NGNs and 13 control NGNs both methods were employed. The percentage TTX-R computed for these NGNs by the two methods was compared by linear regression and found to be in close agreement (r2 > 0.9). Both methods indicate that the fraction of total GNa that is TTX resistant is significantly decreased after vagotomy and that the majority of vagotomized NGNs express low levels of TTX-R GNa (as shown in Fig. 2D).
Voltage-dependent INa inactivation
GNa inactivation is an important determinant of the availability of INa, and may influence NGN excitability. We have therefore measured total, TTX-R and TTX-S GNa steady-state inactivation as functions of membrane potential for control and for vagotomized NGNs (Fig. 3). The voltage-clamp protocol used to derive steady-state inactivation curves (e.g. h∞ curves) consisted of holding the membrane potential of NGNs at various voltages (0 to −120 mV) for 1 s prior to a step to 0 mV. The steady-state availability of INa at each membrane voltage was determined from the relative size of the INa elicited by the steps to 0 mV. Repeating this protocol in the presence of 1 μm TTX permitted the inactivation characteristics of TTX-R INa (Fig. 3B) and, by subtraction, TTX-S INa (Fig. 3C) to be estimated. Control NGNs typically expressed both TTX-R and TTX-S INa, and their steady-state inactivation characteristics usually reflected these two components (Fig. 3D). The TTX-R component typically inactivated over a more depolarized voltage range than the TTX-S component, as described previously (Ikeda et al. 1986; Schild et al. 1994). Vagotomized NGNs typically expressed a pure, or nearly pure, TTX-S current, and the steady-state INa inactivation characteristics of vagotomized NGNs generally reflect this single component (Fig. 3D, right panel). The steady-state inactivation curves for the total, TTX-R and TTX-S INa of each NGN were generally well fitted (r2 > 0.97 for each) with sigmoidal (Boltzmann) functions, though the TTX-R component of vagotomized NGNs was usually too small to permit the determination of a steady-state inactivation curve.
Figure 3. Steady-state sodium current inactivation in control (left) and vagotomized (right) NGNs.
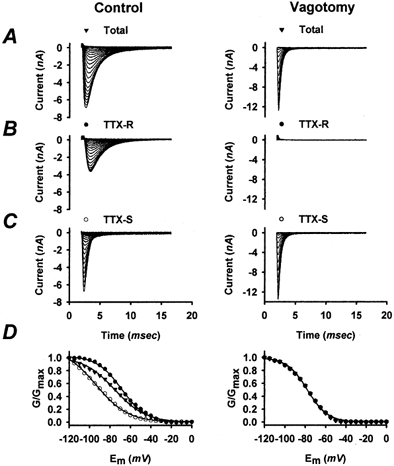
Same control NGN and vagotomized NGN throughout this figure. A, families of INa were elicited from control and vagotomized NGNs by a step depolarization of the membrane potential to 0 mV after holding the membrane potential at voltages from 0 to −120 mV for 1 s. The relative peak INa produced by each step was used to approximate the steady-state fraction of GNa available (not inactivated). B, addition of 1 μm TTX permitted the inactivation of TTX-R GNa to be measured separately in the control NGN but not the vagotomized NGN, which had little TTX-R GNa. C, families of TTX-S INa were obtained for the control and vagotomized NGNs by subtracting TTX-R INa from the total INa. D, the relationship between the voltage of the 1 s prepulse and the peak GNa measured during the step to 0 mV following each prepulse is shown for the TTX-R (•), TTX-S (○) and total (▾) INa for the control NGN and for the total and TTX-S components of INa for the vagotomized NGN. Each steady-state inactivation characteristic shown was well fitted (continuous lines) with a Boltzmann function (r2 > 0.99).
Figure 2E–G depicts the population data for INa inactivation. The average steady-state GNa inactivation curves for control and vagotomized NGNs (shown in Fig. 2E) suggest that steady-state GNa inactivation occurs in a more hyperpolarized membrane potential range in vagotomized NGNs. The voltage of 50 % inactivation (V11/2sol;2) was significantly (P < 0.01) more hyperpolarized in vagotomized NGNs (−74 ± 2 mV, n = 13) than in control NGNs (−65 ± 2 mV, n = 12). The slope (Ks) of the inactivation curves was also significantly (P < 0.01) reduced in vagotomized NGNs (10.8 ± 0.9 mV) compared with control values (13.9 ± 1.2 mV).
The steady-state inactivation of TTX-R INa in control NGNs and the few vagotomized NGNs with measurable TTX-R INa are compared in Fig. 2F. The V11/2sol;2 of inactivation for TTX-R INa in vagotomized NGNs (−59 ± 2 mV, n = 2) was similar to the V11/2sol;2 of inactivation in control NGNs (−65 ± 2 mV, n = 7). Ks values were similar in control (11 ± 1 mV, n = 7) and vagotomized (8 ± 2 mV, n = 2) NGNs.
The steady-state inactivation of TTX-S INa in control and vagotomized NGNs is compared in Fig. 2G. The V11/2sol;2 of inactivation for TTX-S INa in vagotomized NGNs (−85 ± 4 mV, n = 8) was similar to the V11/2sol;2 of inactivation in control NGNs (−83 ± 2 mV, n = 9). Ks values were significantly (P < 0.05) larger in control (14 ± 1 mV, n = 8) than in vagotomized (11 ± 1 mV, n = 9) NGNs.
Taken together, these results indicate that the more hyperpolarized steady-state inactivation characteristics of INa in vagotomized NGNs (Fig. 2E) are primarily due to their lower levels of TTX-R INa.
Window currents
The average GNa activation (Fig. 2A) and inactivation (Fig. 2E) curves for control NGNs reveal that there is a membrane potential range (approximately −35 to −20 mV) where GNa is partially activated, and not completely inactivated. In this membrane potential range, a fraction of GNa activates and does not inactivate, resulting in sustained INa, a ‘window current’. In contrast, the average vagotomized NGN has little or no overlap of GNa activation and steady-state inactivation curves (Fig. 2A and E), indicating that window currents may be greatly decreased or non-existent in vagotomized NGNs. The window current in the TTX-R component (Fig. 2B and F) appears much larger than that of the TTX-S component (Fig. 2C and G). Indeed, sustained TTX-R INa was observed in this membrane potential range (Fig. 1B, left panel), while sustained TTX-S INa was much less pronounced (Fig. 1C, left panel). Sustained INa was generally not observed in vagotomized NGNs (Fig. 1A, right panel), except for the small subset expressing significant amounts of TTX-R INa.
Sodium current repriming
INa recovery from inactivation, ‘repriming’, has been shown to change in axotomized DRGNs and may play a role in excitability changes in these cells (Cummins & Waxman, 1997). To determine whether INa repriming is altered following vagotomy in NGNs, INa repriming was quantified in vagotomized (n = 10) and control (n = 12) NGNs, dissociated 5 days post-vagotomy from three rats. In order to compare our results with previously published work on INa repriming in rat NGNs, we adopted a method similar to that described by Schild & Kunze (1997) and illustrated in Fig. 4. NGNs were depolarized from a membrane potential of −100 to 0 mV for 40 ms, evoking an INa. During 40 ms at 0 mV, GNa inactivated (> 95 %). NGNs were then allowed to reprime for a variable amount of time, Δt, at −100 mV, and then depolarized again to 0 mV for 40 ms, evoking a second INa. The ratio of the peak of the second INa to the peak of the first INa provided an estimate of the fraction of INa that reprimed during the recovery time, Δt. The addition of 1 μm TTX, and repetition of the experiment permitted the repriming of TTX-R INa and, by subtraction, TTX-S INa to be measured separately. INa repriming as a function of recovery time (Δt) is plotted for representative control and vagotomized NGNs in Fig. 4. Repriming in control NGNs generally reflected both a more rapidly repriming TTX-R component (Fig. 4B, left panel), and a more slowly repriming TTX-S component (Fig. 4C, left panel), as reported previously (Schild & Kunze, 1997). In vagotomized NGNs, INa repriming typically reflected only the repriming of the TTX-S component (Fig. 4D, right panel).
Figure 4. Sodium current repriming in representative control (left) and vagotomized (right) NGNs.
A, inward INa were evoked in control and vagotomized NGNs by 40 ms membrane potential steps to 0 mV from a membrane potential of −100 mV. The membrane potential was then returned to −100 mV to allow time for INa to recover from inactivation (reprime). Following a variable recovery period, Δt, the NGN was depolarized again to 0 mV for 40 ms. The peak magnitude of the second INa, relative to the first, provides an estimate of the fractional repriming of INa that occurred during the time Δt. B, repeating the repriming protocol in the presence of 1 μm TTX permitted the repriming of TTX-R INa to be measured for the control and vagotomized NGNs. C, subtracting the TTX-R INa from the total INa allowed the repriming of the TTX-S component of INa to be measured for representative control and vagotomized NGNs. D, the fractional repriming of TTX-R (•), TTX-S (○) and total (▾) INa for the control and vagotomized NGNs is plotted as a function of the time allowed for repriming. These plots include some additional time points not shown in A–C. Repriming curves were well fitted (r2 > 0.95) with two-component exponential functions (continuous lines), as described in the text. Repriming in most control NGNs represented a compromise between a rapidly repriming TTX-R component, and a more slowly repriming TTX-S component. Most vagotomized NGNs expressed little (< 10 %) TTX-R INa. * Capacitive currents associated with step changes in membrane potential.
In general, INa repriming appeared to be slower in vagotomized than in control NGNs (Fig. 5). As illustrated in Fig. 4 and Fig. 5, the recovery kinetics of control and vagotomized NGNs appear to have fast and slow time constants; this is reflected in the linear recovery, with two different slopes, of INa with respect to log(Δt). To quantify differences in repriming, the fractional recovery from inactivation of INa as a function of recovery time (Δt) was fitted with a second-order exponential function for each NGN (Fig. 4D, r2 > 0.95 for each). From these fits, two time constants emerged: the fast time constant (τ1) was significantly faster in control NGNs (1.6 ± 0.3 ms, n = 12) than in vagotomized NGNs (2.8 ± 0.4 ms, n = 10) (P < 0.02). The slow time constant (τ2) for repriming in vagotomized (57 ± 10 ms) and control (59 ± 7 ms) NGNs did not differ significantly (P = 0.26). The relative magnitude of τ1 tended (P = 0.09) to be larger in control NGNs (0.90 ± 0.02) than vagotomized NGNs (0.80 ± 0.05). Taken together, these results indicate that INa recovery from inactivation is slower in vagotomized than control NGNs, primarily due to a significantly slower τ1 in vagotomized NGNs.
Figure 5. Population data for INa repriming.
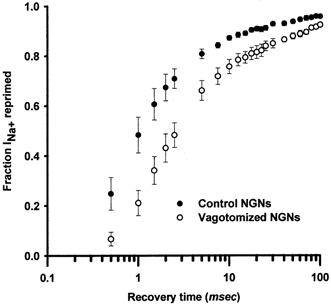
INa repriming was measured for control (•) and vagotomized (○) NGNs using the methods illustrated in Fig. 4. The mean ±s.e.m. (symbols and error bars) fractional repriming of INa for control (n = 12) and vagotomized (n = 10) NGNs is plotted as a function of the time allowed for repriming, log(Δt). INa repriming as a function of time for each NGN was fitted with an exponential function of two components. The INa repriming parameters of control and vagotomized NGNs were statistically compared as described in the text.
TTX-S sodium current repriming
The emergence of a rapidly repriming TTX-S INa following axotomy has been documented in DRG neurones (Cummins & Waxman, 1997). Because changes in the repriming of INa could contribute to the pattern of AP discharge, we tested whether the repriming of TTX-S INa is altered in vagotomized NGNs. We measured repriming in both control conditions and the presence of 1 μm TTX, as illustrated in Fig. 4. By subtracting the TTX-R INa from the total INa, the repriming of TTX-S INa was obtained, and repriming of this current was quantified (Fig. 4). TTX-S INa reprimed with a similar time course in control (n = 12) and vagotomized (n = 10) NGNs (Fig. 4). TTX-S INa repriming in each cell was fitted with a second-order exponential function (r2 > 0.97 for each). The fast and slow time constants in control NGNs (2.7 ± 0.2 and 112 ± 6 ms, respectively) were similar to those in vagotomized NGNs (3.2 ± 0.2 and 102 ± 8 ms, respectively; P > 0.1 for each). The relative magnitudes of the fast (0.80 ± 0.05) and slow (0.23 ± 0.05) components in control NGNs was similar to those of the fast (0.84 ± 0.02) and slow (0.19 ± 0.02) components in vagotomized NGNs (P > 0.2 for each). Taken together, these data indicate that TTX-S INa repriming in NGNs is not altered by vagotomy. Thus, it appears that the most likely explanation for the more rapid repriming of total INa in control NGNs is their higher levels of TTX-R INa.
Action potential waveforms and sodium currents during repetitive firing
INa inactivation properties of NGNs described above suggest that at resting membrane potential vagotomized NGNs should have less INa available for AP discharge than control NGNs (Fig. 2E). To test whether vagotomized NGNs actually generate less INa during sustained AP firing, we measured INa evoked by a series of AP waveforms in control and vagotomized NGNs. First, a series of APs was recorded (Fig. 6A) from a control NGN using whole-cell current clamp as described previously (Lancaster et al. 2001). Under INa recording conditions, these prerecorded APs were used as a voltage-clamp command to elicit INa from control and vagotomized NGNs (Fig. 6B and C). While the currents in these experiments are not exactly the same as would occur during AP discharge (having a lower sodium Nernst potential due to a lower external sodium concentration), they can still reveal important information about the INa during repetitive AP firing. The INa generated under these conditions had both inward and outward components (because the AP waveforms from −60 to +55 mV were, at times, positive and negative to the sodium Nernst potential of +33 mV for these experiments). The peak magnitudes of both the inward and outward INa associated with each AP were measured. Population data for these currents are shown in Fig. 6D and E.
Figure 6. Sodium currents evoked by AP waveforms.
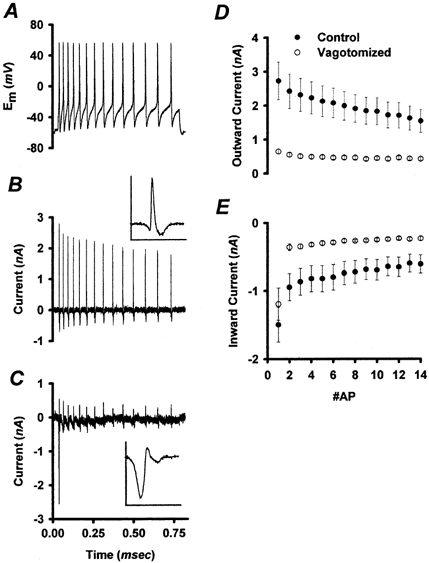
A, a series of APs was recorded from a control NGN and was used as a voltage-clamp command to elicit INa from control and vagotomized NGNs. B, most control NGNs generated INa in response to each AP waveform, with only gradual run down. Because the AP waveforms passed through the reversal potential for sodium (+33 mV, see text), the currents have both inward and outward components. C, by contrast with control NGNs, most vagotomized NGNs only produced a single large INa in response to the first AP. Insets in B and C show the current associated with the first AP at higher temporal resolution. Inset current and time scales are 4 nA and 16 ms, respectively. D and E, population data. The mean peak outward (D) and inward (E) currents associated with each AP in the series are plotted for control (•, n = 12) and vagotomized (○, n = 14) NGN populations. As illustrated in Fig. 7, TTX-S currents were predominantly inward, while TTX-R currents were predominantly outward. TTX-S INa peaked during the up-stroke of the AP, when the membrane potential favours inward INa. In contrast, TTX-R INa activated more slowly, peaking during the AP maximum, when the membrane potential favours outward INa. Note that the currents in vagotomized NGNs are extremely small, except for those evoked by the first AP. Error bars represent ±s.e.m.
Most control NGNs were able to repeatedly generate INa during this series of AP commands, with only a gradual decrease in INa during repeated AP discharge (Fig. 6D and E). Most vagotomized NGNs, by contrast, could generate a sizable INa only for the first AP, and very little INa subsequently (Fig. 6C–E).
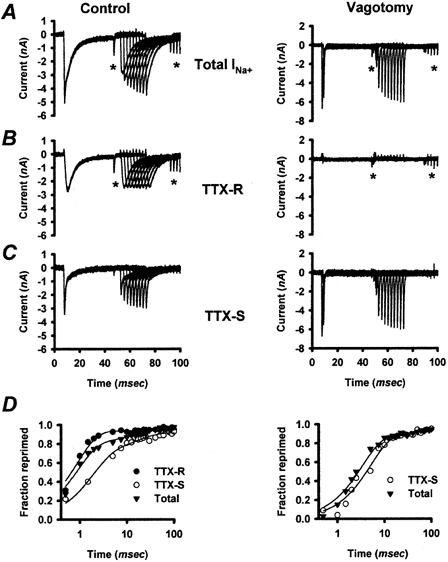
TTX-R GNa is generally larger (∼2-fold) in control vs. vagotomized NGNs (Fig. 2D) and it may be important for generating repeated INa at depolarized potentials. We therefore examined the role of TTX-R GNa in generating the repeated INa observed in many control NGNs. In seven control NGNs and in three vagotomized NGNs, AP-induced INa was measured as illustrated in Fig. 6, and then remeasured after the addition of 1 μm TTX. The INa evoked by each AP command in control NGNs were only slightly diminished by the addition of TTX (Fig. 7A, C and E). Approximately 50 % of the (inward) INa associated with the first AP was TTX-S, but there was very little contribution of TTX-S INa (< 20 % of total INa) to the remaining APs. In vagotomized NGNs, there was generally only a large INa in response to the first AP command and very little INa subsequently (Fig. 7B). In three of three vagotomized NGNs, this single current was greatly attenuated by 1 μm TTX (Fig. 7D and F).
Figure 7. Changes in TTX-R INa during repetitive AP waveforms.
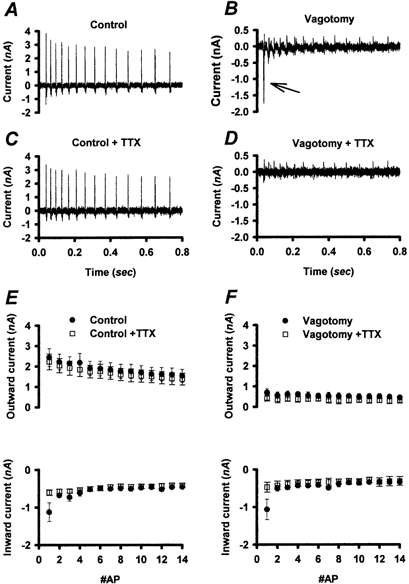
A series of AP waveforms (shown in Fig. 6A) was used as a voltage-clamp command to elicit INa from representative control (A) and vagotomized (B) NGNs. C and D, the same series of AP waveforms evoked INa from the same representative control and vagotomized NGNs as in A and B, respectively, in the presence of 1 μm TTX. The large repetitive INa produced by the control NGN were TTX resistant. The large inward INa associated with the first AP in the vagotomized NGN (arrow) was TTX sensitive. E, the mean ±s.e.m. peak outward and inward currents associated with each AP in the series are plotted for control NGNs (n = 7) in normal solutions (•) and in the presence of 1 μm TTX (□). Most of the INa associated with multiple APs was TTX-R. F, the mean ±s.e.m. peak outward and inward currents associated with each AP in the series are plotted for vagotomized NGNs (n = 3) in normal solutions (•) and in the presence of 1 μm TTX (□). Note that the currents in vagotomized NGNs are extremely small, except for the TTX-S current evoked by the first AP.
DISCUSSION
In the present work, we have investigated whether changes in INa could explain the lowered excitability and decreased AP discharge of vagotomized NGNs (Lancaster et al. 2001). Though total GNa density was unaltered in vagotomized NGNs, there were significant changes in INa activation, INa inactivation, INa repriming, and the relative contributions of TTX-S INa and TTX-R INa to total INa.
The steady-state INa inactivation characteristic was shifted to a more hyperpolarized voltage range in vagotomized NGNs, resulting in a large decrease in available INa at rest and during AP discharge. The membrane potential of control NGNs during sustained AP discharge (Fig. 6A) is generally positive to −60 mV for prolonged periods. The steady-state inactivation characteristic of INa in vagotomized NGNs (Fig. 2E) indicates that a large fraction (> 80 %) of INa should be inactivated at membrane potentials positive to −60 mV. By contrast, control NGNs have substantial amounts of INa available (not inactivated) at the membrane potentials occurring during repetitive AP discharge. The more rapid recovery from inactivation of INa in control NGNs (Fig. 5) should further enhance the disparity in available INa during repetitive discharge. During a series of APs, the INa in control NGNs may more completely reprime during the brief after-hyperpolarization following each AP. Changes in INa inactivation and repriming may therefore underlie the decreased ability of vagotomized NGNs to discharge multiple APs in response to sustained depolarizing stimuli.
INa activation in vagotomized NGNs occurred in a significantly more hyperpolarized voltage range than in control NGNs. This shift in INa activation, in the absence of other changes, would be expected to result in decreased AP threshold and increased excitability in vagotomized NGNs, effects opposite to those observed following vagotomy (Lancaster et al. 2001). The shift in INa activation is apparently unable to compensate for the lowered availability of INa caused by changes in INa inactivation and repriming.
The question remains whether the alterations in INa observed in vagotomized NGNs alone are sufficient to explain their inability to fire APs repetitively in response to sustained suprathreshold depolarizing stimuli (see Fig. 1 in Lancaster et al. 2001). In principle, implementation of computer-generated conductances, ‘dynamic clamp’ (Sharp et al. 1993), could be used to introduce vagotomy-induced INa changes into control NGNs and examine whether their AP firing pattern matched those of vagotomized NGNs. In lieu of this technically demanding approach, we applied trains of AP waveforms, recorded from a control NGN, as a voltage-clamp command and measured the ability of control and vagotomized NGNs to produce repetitive INa. Most control NGNs generated repeated INa during a train of AP waveforms, with only a gradual decrease in INa associated with each successive AP in the series. In contrast, most vagotomized NGNs could generate a moderate INa on the first AP, but then very little current during subsequent APs. This behaviour corresponds closely to the firing properties of control and vagotomized NGNs; control NGNs typically generate multiple APs in response to strong depolarization, while vagotomized NGNs typically discharge only a single AP, or very few APs (Lancaster et al. 2001). The deficit of INa in vagotomized NGNs during repetitive AP waveforms compared with that in control NGNs therefore suggests that changes in INa are a reasonable basis for the decreased ability of vagotomized NGNs to discharge multiple APs. Most of the INa evoked by repetitive AP waveforms is of the TTX-R type, indicating that TTX-R INa supports sustained AP discharge in control NGNs. In vagotomized NGNs, the loss of TTX-R INa results in decreased AP-evoked INa and decreased AP discharge.
The contribution of the relatively small amounts of TTX-S INa observed during repetitive AP waveforms to sustained discharge has not been directly addressed in this work. Previous work (Schild & Kunze, 1997) has suggested an important role for TTX-S INa in sustained AP discharge in rat NGNs. Our data indicate that both TTX-R and TTX-S INa may be necessary to support excitability in NGNs, and that the loss of either would result in decreased AP discharge.
The proportion of total INa that is TTX-R is thought to profoundly affect neuronal excitability and the pattern of AP discharge in NGNs (Schild & Kunze, 1997). In both DRGNs and NGNs, it has been previously observed by numerous investigators that TTX-R INa activates and inactivates in a more depolarized voltage range than does TTX-S INa, and that TTX-R INa recovers more rapidly from inactivation (Bossu & Feltz, 1984; Ikeda et al. 1986; Elliott & Elliott, 1993; Schild & Kunze, 1997; Cummins & Waxman, 1997). While vagotomy is associated with some, relatively minor, changes in the properties of the TTX-R INa and TTX-S INa, the decreased TTX-R INa of vagotomized NGNs is the major factor underlying their changed INa activation, steady-state inactivation and repriming characteristics.
The biophysical characteristics of TTX-R INa in NGNs are similar to those ascribed to the gene product of SNS, a TTX-resistant sodium channel protein also known as SNS1 (Akopian et al. 1996) or PN3 (Sangameswaran et al. 1996). Under the recently proposed rationalization of voltage-gated sodium channel nomenclature, this sodium channel α-subunit has been termed Nav 1.8 (Goldin et al. 2000). A reduction in TTX-R INa and a reduction in the expression of Nav 1.8 mRNA have been extensively described in axotomized small diameter DRGNs (Rizzo et al. 1995; Dib-Hajj et al. 1996; Cummins & Waxman, 1997). A reduction in Nav 1.8 mRNA levels and a corresponding decrease in the number of Nav 1.8 proteins in the cell membrane would be the most likely explanation for decreased TTX-R INa in vagotomized NGNs.
A reduction of TTX-R INa and an increase in a rapidly repriming TTX-S INa in axotomized DRGNs has been proposed to explain the increased excitability in these afferents (Waxman et al. 1999). We have observed a similar reduction in TTX-R INa in NGNs following vagotomy, but we suggest this change underlies the reduced excitability observed in NGNs. There are many possible explanations for these disparate interpretations. First, the population of DRG afferents that stop expressing Nav 1.8 and TTX-R INa following injury may not be the DRG afferents that become hyperexcitable. This possibility is supported by a recent study demonstrating that large diameter muscle afferents, but not skin afferents, display hyperexcitability following a sciatic nerve injury (Michaelis et al. 2000). Another report has shown little correlation between changes in TTX-R sodium channels in C-afferents and ectopic activity in DRG C-fibre afferents (Boucher et al. 2000). Second, axotomized DRG afferents may have changes in ionic currents other than INa (e.g. potassium and calcium currents). These currents may function along with TTX-S INa to support enhanced AP discharge and increased excitability. It is noteworthy that changes in both potassium and calcium currents have been demonstrated in axotomized DRGNs (Everill & Kocsis, 1999; Baccei & Kocsis, 2000; Abdulla & Smith 2001). Third, axotomized DRGNs may express different types of TTX-S INa from those expressed by axotomized NGNs and these currents may be more supportive of AP discharge. In support of this interpretation, we have not observed any significant change in the repriming of TTX-S INa in vagotomized NGNs, in contrast to axotomized DRGNs, where a rapidly repriming TTX-S INa has been demonstrated (Cummins & Waxman, 1997). Further, the repriming of TTX-S INa in both control and vagotomized NGNs (Fig. 4C) is more similar to that of the ‘rapidly repriming’ TTX-S INa of axotomized DRGNs than it is to the TTX-S INa of control DRGNs (compare with Fig. 10, Cummins & Waxman, 1997). Fourth, there may be a different localization of INa or other currents in various cellular compartments (axon, soma, nerve terminal, etc.) of NGNs and DRGNs. Finally, neuronal excitability has been measured in many ways by different investigators (the ability to generate multiple APs, AP threshold, ectopic AP discharge, etc.) and it may be necessary to apply common measurements to both NGN and DRG populations to resolve these differing interpretations of the role of TTX-R INa in shaping somal neuronal excitability.
Changes in INa may not be the only reason vagotomized NGNs are less excitable. Specifically, the large increase in AP threshold, and more negative resting membrane potential of vagotomized NGNs (Lancaster et al. 2001) indicate that there may also be alterations in potassium currents. The increase in rheobase in vagotomized NGNs is particularly suggestive of an increase in potassium conductance near the AP threshold. The amount of INa recorded during the first AP in a series (which would be most relevant to rheobase) is only slightly reduced in vagotomized NGNs. Further, this current is largely of the TTX-S type, and activates rapidly at more hyperpolarized voltages than does TTX-R INa. Therefore, changes in INa observed here may not be a sufficient explanation for the drastically (> 200 %, Lancaster et al. 2001) increased rheobase of vagotomized NGNs. An examination of other currents will be required to explain this phenomenon.
Acknowledgments
The authors would like to thank Drs M. S. Gold and D. R. Matteson for their comments on an earlier version of this manuscript. This work was supported by NIH grant NS-22069.
References
- Abdulla FA, Smith PA. Axotomy- and autotomy-induced changes in Ca2+ and K+ channel currents of rat dorsal root ganglion neurons. Journal of Neurophysiology. 2001;85:644–658. doi: 10.1152/jn.2001.85.2.644. [DOI] [PubMed] [Google Scholar]
- Akopian AN, Sivilotti L, Wood JN. A tetrodotoxin-resistant voltage-gated sodium channel expressed by sensory neurons. Nature. 1996;379:257–262. doi: 10.1038/379257a0. [DOI] [PubMed] [Google Scholar]
- Baccei ML, Kocsis JD. Voltage-gated calcium currents in axotomized adult rat cutaneous afferent neurons. Journal of Neurophysiology. 2000;83:2227–2238. doi: 10.1152/jn.2000.83.4.2227. [DOI] [PubMed] [Google Scholar]
- Bielefeldt K. Differential effects of capsaicin on rat visceral sensory neurons. Neuroscience. 2000;101:727–736. doi: 10.1016/s0306-4522(00)00375-4. [DOI] [PubMed] [Google Scholar]
- Bossu JL, Feltz A. Patch-clamp study of the tetrodotoxin-resistant sodium current in group C sensory neurones. Neuroscience Letters. 1984;51:241–246. doi: 10.1016/0304-3940(84)90558-5. [DOI] [PubMed] [Google Scholar]
- Boucher TJ, Okuse K, Bennett DL, Munson JB, Wood JN, McMahon SB. Potent analgesic effects of GDNF in neuropathic pain states. Science. 2000;290:124–127. doi: 10.1126/science.290.5489.124. [DOI] [PubMed] [Google Scholar]
- Cummins TR, Waxman SG. Downregulation of tetrodotoxin-resistant sodium currents and upregulation of a rapidly repriming tetrodotoxin-sensitive sodium current in small spinal sensory neurons after nerve injury. Journal of Neuroscience. 1997;17:3503–3514. doi: 10.1523/JNEUROSCI.17-10-03503.1997. [DOI] [PMC free article] [PubMed] [Google Scholar]
- Devor M. The pathophysiology of damaged peripheral nerve. In: Wall PD, Melzack R, editors. Textbook of Pain. London: Churchill-Livingstone; 1994. pp. 79–100. [Google Scholar]
- Dib-Hajj S, Black JA, Felts P, Waxman SG. Down-regulation of transcripts for Na channel alpha-SNS in spinal sensory neurons following axotomy. Proceedings of the National Academy of Sciences of the USA. 1996;93:14950–14954. doi: 10.1073/pnas.93.25.14950. [DOI] [PMC free article] [PubMed] [Google Scholar]
- Elliott AA, Elliott JR. Characterization of TTX-sensitive and TTX-resistant sodium currents in small cells from adult rat dorsal root ganglia. Journal of Physiology. 1993;463:39–56. doi: 10.1113/jphysiol.1993.sp019583. [DOI] [PMC free article] [PubMed] [Google Scholar]
- Everill B, Kocsis JD. Reduction in potassium currents in identified cutaneous afferent dorsal root ganglion neurons after axotomy. Journal of Neurophysiology. 1999;82:700–708. doi: 10.1152/jn.1999.82.2.700. [DOI] [PubMed] [Google Scholar]
- Gallego R, Ivorra I, Morales A. Effects of central or peripheral axotomy on membrane properties of sensory neurones in the petrosal ganglion of the cat. Journal of Physiology. 1987;391:39–56. doi: 10.1113/jphysiol.1987.sp016724. [DOI] [PMC free article] [PubMed] [Google Scholar]
- Gold MS, Levine JD, Correa AM. Modulation of TTX-R INa by PKC and PKA and their role in PGE2-induced sensitization of rat sensory neurons in vitro. Journal of Neuroscience. 1998;18:10345–10355. doi: 10.1523/JNEUROSCI.18-24-10345.1998. [DOI] [PMC free article] [PubMed] [Google Scholar]
- Goldin AL, Barchi RL, Caldwell JH, Hofmann F, Howe JR, Hunter JC, Kallen RG, Mandel G, Meisler MH, Netter YB, Noda M, Tamkun MM, Waxman SG, Wood JN, Catterall WA. Nomenclature of voltage-gated sodium channels. Neuron. 2000;28:365–368. doi: 10.1016/s0896-6273(00)00116-1. [DOI] [PubMed] [Google Scholar]
- Hamill OP, Marty A, Neher E, Sakmann B, Sigworth FJ. Improved patch-clamp techniques for high-resolution current recording from cells and cell-free membrane patches. Pflügers Archiv. 1981;391:85–100. doi: 10.1007/BF00656997. [DOI] [PubMed] [Google Scholar]
- Ikeda SR, Schofield GG, Weight FF. Na+ and Ca2+ currents of acutely isolated adult rat nodose ganglion cells. Journal of Neurophysiology. 1986;55:527–539. doi: 10.1152/jn.1986.55.3.527. [DOI] [PubMed] [Google Scholar]
- Jafri MS, Moore KA, Taylor GE, Weinreich D. Histamine H1 receptor activation blocks two classes of potassium current, IK(rest) and IAHP, to excite ferret vagal afferents. Journal of Physiology. 1997;503:533–546. doi: 10.1111/j.1469-7793.1997.533bg.x. [DOI] [PMC free article] [PubMed] [Google Scholar]
- Kim YI, Na HS, Kim SH, Han HC, Yoon YW, Sung B, Nam HJ, Shin SL, Hong SK. Cell type-specific changes of the membrane properties of peripherally-axotomized dorsal root ganglion neurons in a rat model of neuropathic pain. Neuroscience. 1998;86:301–309. doi: 10.1016/s0306-4522(98)00022-0. [DOI] [PubMed] [Google Scholar]
- Lancaster E, Oh EJ, Weinreich D. Vagotomy decreases excitability in primary vagal afferent somata. Journal of Neurophysiology. 2001;85:247–253. doi: 10.1152/jn.2001.85.1.247. [DOI] [PubMed] [Google Scholar]
- Mei N. Sensory structures in the viscera. In: Ottoson D, Autrum H, Perl ER, Schmidt RF, Shimazu H, Willis WD, editors. Progress in Sensory Physiology. Berlin: Springer-Verlag; 1983. pp. 1–42. [Google Scholar]
- Michaelis M, Liu X, Janig W. Axotomized and intact muscle afferents but no skin afferents develop ongoing discharges of dorsal root ganglion origin after peripheral nerve lesion. Journal of Neuroscience. 2000;20:2742–2748. doi: 10.1523/JNEUROSCI.20-07-02742.2000. [DOI] [PMC free article] [PubMed] [Google Scholar]
- Nordin M, Nystrom B, Wallin U, Hagbarth KE. Ectopic sensory discharges and paresthesiae in patients with disorders of peripheral nerves, dorsal roots and dorsal columns. Pain. 1984;20:231–245. doi: 10.1016/0304-3959(84)90013-7. [DOI] [PubMed] [Google Scholar]
- Rizzo MA, Kocsis JD, Waxman SG. Selective loss of slow and enhancement of fast Na+ currents in cutaneous afferent dorsal root ganglion neurones following axotomy. Neurobiology of Disease. 1995;2:87–96. doi: 10.1006/nbdi.1995.0009. [DOI] [PubMed] [Google Scholar]
- Roy ML, Narahashi T. Differential properties of tetrodotoxin-sensitive and tetrodotoxin-resistant sodium channels in rat dorsal root ganglion neurons. Journal of Neuroscience. 1992;12:2104–2111. doi: 10.1523/JNEUROSCI.12-06-02104.1992. [DOI] [PMC free article] [PubMed] [Google Scholar]
- Sangameswaran L, Delgado SG, Fish LM, Koch BD, Jakeman LB, Stewart GR, Sze P, Hunter JC, Eglen RM, Herman RC. Structure and function of a novel voltage-gated, tetrodotoxin-resistant sodium channel specific to sensory neurons. Journal of Biological Chemistry. 1996;271:5953–5956. doi: 10.1074/jbc.271.11.5953. [DOI] [PubMed] [Google Scholar]
- Schild JH, Clark JW, Hay M, Mendelowitz D, Andresen MC, Kunze DL. A- and C-type rat nodose sensory neurons: model interpretations of dynamic discharge characteristics. Journal of Neurophysiology. 1994;71:2338–2358. doi: 10.1152/jn.1994.71.6.2338. [DOI] [PubMed] [Google Scholar]
- Schild JH, Kunze DL. Experimental and modeling study of Na+ current heterogeneity in rat nodose neurons and its impact on neuronal discharge. Journal of Neurophysiology. 1997;78:3198–3209. doi: 10.1152/jn.1997.78.6.3198. [DOI] [PubMed] [Google Scholar]
- Sharp AA, O'Neil MB, Abbott LF, Marder E. Dynamic clamp: computer-generated conductances in real neurons. Journal of Neurophysiology. 1993;69:992–995. doi: 10.1152/jn.1993.69.3.992. [DOI] [PubMed] [Google Scholar]
- Waxman SG, Cummins TR, Dib-Hajj S, Fjell J, Black JA. Sodium channels, excitability of primary sensory neurons, and the molecular basis of pain. Muscle and Nerve. 1999;22:1177–1187. doi: 10.1002/(sici)1097-4598(199909)22:9<1177::aid-mus3>3.0.co;2-p. [DOI] [PubMed] [Google Scholar]