

Abstract
Our goal in this study was to evaluate the effect of haemodynamic overload on cross-bridge (XBr) kinetics in the rabbit heart independently of myosin heavy chain (MHC) isoforms, which are known to modulate kinetics in small mammals. We applied a myothermal-mechanical protocol to isometrically contracting papillary muscles from two rabbit heart populations: (1) surgically induced right ventricular pressure overload (PO), and (2) sustained treatment with propylthiouracil (PTU). Both treatments resulted in a 100 % V3 MHC profile.
XBr force–time integral (FTI), evaluated during the peak of the twitch from muscle FTI and tension-dependent heat, was greater in the PO hearts (0.80 ± 0.10 versus 0.45 ± 0.05 pN s, means ±s.e.m.., P = 0.01).
Within the framework of a two-state XBr model, the PO XBr developed more force while attached (5.8 ± 0.9 versus 2.7 ± 0.3 pN), with a lower cycling rate (0.89 ± 0.10 versus 1.50 ± 0.14 s−1) and duty cycle (0.14 ± 0.03 versus 0.24 ± 0.02).
Only the ventricular isoforms of myosin light chain 1 and 2 and cardiac troponin I (cTnI) were expressed, with no difference in cTnI phosphorylation between the PO and PTU samples. The troponin T (TnT) isoform compositions in the PO and PTU samples were significantly different (P = 0.001), with TnT2 comprising 2.29 ± 0.03 % in PO hearts versus 0.98 ± 0.01 % in PTU hearts of total TnT.
This study demonstrates that MHC does not mediate dramatic alterations in XBr function induced by haemodynamic overload. Our findings support the likelihood that differences among other thick and thin filament proteins underlie these XBr alterations.
Cardiac performance in systole and diastole is critically dependent upon the underlying characteristics of the cross-bridge cycle. Myosin cross-bridges extending out from the thick filament produce muscle force and motion via repetitive interactions with actin-containing thin filaments, with the obligatory hydrolysis of ATP.
The failing human heart exhibits a 100 % greater cross-bridge force–time integral (FTIXBr) than normal (Hasenfuss et al. 1991) and a decrease in myofibrillar ATPase activity (Alpert & Gordon, 1962; Pagani et al. 1988) with no change in the myosin heavy chain (MHC) isoform profile (100 % V3; Schiaffino & Reggiani, 1996). The FTIXBr and ATPase activity are both accepted measures of cross-bridge performance, where the former is an index of mechanical response per molecule of ATP hydrolysed, while the latter is an index of interaction kinetics. The mechanisms underlying these mechanical and kinetic alterations in the human heart are unknown, though a shift in cardiac troponin T (cTnT) isoform expression has been observed to correlate with the decrease in myofibrillar ATPase activity (Anderson et al. 1991).
In the rabbit heart, surgically induced right ventricular pressure overload (PO) results in a two-fold increase in the isometric FTIXBr (Hasenfuss et al. 1991), along with a reduction in shortening velocity (Hamrell & Dey, 1993) and ATPase activity (Maughan et al. 1979; Litten et al. 1982). These changes are accompanied by a relatively subtle myosin isoform shift from 88 % V3 to 100 % V3 (Litten et al. 1982, 1985; Hasenfuss et al. 1991). This raises the possibility that, as in the failing human heart, modulatory mechanisms independent of the MHC composition may be important in the haemodynamically stressed rabbit.
The above findings gave rise to the primary hypothesis that we tested in this paper: in the absence of a change in MHC V3 isoform expression, ventricular PO hypertrophy results in an increase in the FTIXBr. Our findings support this hypothesis, leading us to examine whether alterations in other thick and thin filament proteins were present.
To determine whether non-MHC-dependent mechanisms can modulate cross-bridge mechanics, we examined isometrically contracting papillary muscles from two rabbit groups: (1) surgically induced right ventricular PO hypertrophy, and (2) drug (propylthiouracil, PTU)-induced MHC shift without hypertrophy. Both of these models produced a 100 % V3 MHC profile, so any changes in cross-bridge characteristics must take place via alternative mechanisms. The myosin FTIXBr was assessed using our standard myothermal-mechanical techniques (Hasenfuss et al. 1991). The myothermal data were also evaluated within a simple cross-bridge model to provide a detailed mechanical and kinetic characterization of the cross-bridge cycle. Possible protein modifications were assessed by examining isoform compositions of MHC, troponin T (TnT), troponin I (TnI), myosin light chain (MLC)1 and MLC2.
METHODS
Preparations
Rabbit models
Two groups of New Zealand albino rabbits (1.5–2.0 kg) were subjected to treatments that have been reported to yield 100 % V3 MHC. In the first group the rabbits were given PTU in the drinking water (0.8 mg ml−1) for a 3 week period before the experiment. PTU decreases blood serum levels of thyroid hormone, leading to a hypothyroid state. It also causes a shift in the MHC population, from approximately 88 % V3 in the control rabbit (Litten et al. 1985) to essentially 100 % V3 (Ling et al. 1988; Arai et al. 1991).
The second group was a right ventricular PO model, in which the rabbits' pulmonary arteries were constricted (Hamrell & Alpert, 1977; Litten et al. 1982). PO, which also causes a shift in the MHC population towards 100 % V3 (Litten et al. 1982), was induced by surgical banding of the pulmonary artery under aseptic conditions such that the diameter of the outflow tract was reduced by approximately 50 %. Anaesthesia was induced with promethazine hydrochloride (25 mg) and pentobarbital sodium (25 mg kg−1, i.v.) and was followed rapidly by endotracheal intubation and methoxyflurane inhalation anaesthesia, delivered via positive pressure ventilation. Small i.v. doses (2 mg) of succinylcholine were administered when necessary for relaxation during surgical anaesthesia. A left lateral thoracotomy in the third interspace exposed the proximal main pulmonary artery. A Monel metal spiral was ‘twirled’ around the proximal main pulmonary artery. Animals were housed in a recovery area for 24 h, then returned to their cages and monitored daily for infection, weight loss, appetite and general energy level to ensure successful recovery. Experiments were performed 3 weeks post-surgery. All procedures were performed in accordance with institutional guidelines for animal care and use.
Muscle preparation
The rabbit was anaesthetized by inhaling CO2 (65 % CO2, 35 % O2), and the heart was removed and exsanguinated with repeated changes of superfusate. The bathing solution was a modified Krebs-Ringer (Krebs) solution, consisting of (mm): 152 Na+, 3.6 K+, 135 Cl−, 25 HCO3−, 0.6 Mg2+, 1.3 H2PO4, 0.6 SO42-, 2.5 Ca2+ and 5.0 glucose, continuously bubbled with 95 % O2-5 % CO2 (pH 7.4). The heart was transferred to a dissection chamber at room temperature, where the right ventricle was opened and a suitably thin papillary muscle was selected. After ligature electrodes were attached with loops of 4–0 non-capillary braided silk, the muscle was excised and mounted horizontally in the thermopile chamber that contained the same Krebs solution. Concurrent with this dissection, the right ventricular free wall was dissected, frozen in liquid N2 and stored at −70 °C for later analysis of MHC isoforms.
Biochemical assay sample preparation
Tissue for analysis of TnT, TnI, MLC1 and MLC2 isoform expression was obtained as above, except that the dissection bath contained no added Ca2+ and was maintained at 4 °C. All papillary muscles, plus the right ventricular free wall, were rapidly excised, placed on aluminium foil and pressed between two liquid N2-cooled aluminium blocks. The foil packet was then stored in liquid N2 for later measurement of wall mass and thickness, as well as biochemical analysis of TnT, TnI, MLC1 and MLC2.
Procedures
Myothermal apparatus
The basic experimental apparatus for myothermal measurement has been described in detail elsewhere (Alpert et al. 1989b; Hasenfuss et al. 1991). The set-up used here, shown schematically in Fig. 1, is a new implementation of our previously described myothermal system (Peterson & Alpert, 1998). Temperature drift was under 10−6°C s−1, approximately three orders of magnitude lower than the muscle signal transient. Experiments in this study were conducted at 21 °C (∼1 °C above ambient). One thermopile (Mulieri et al. 1977), with a sensitivity of 0.6 mV °C−1, was used for these experiments. Temperature, force and length signals were routed through a Data Translation DT2831-G data acquisition board to a personal computer. All protocols were under computer control, using custom-made software.
Figure 1. Schematic diagram of the myothermal apparatus.
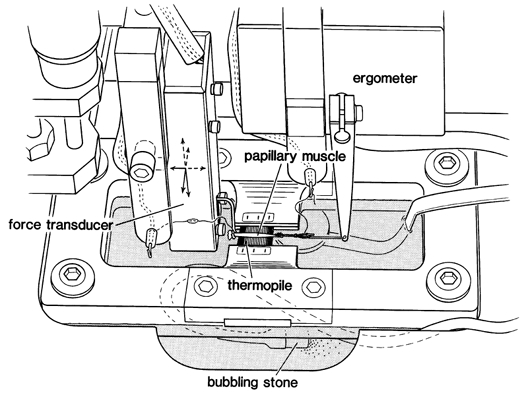
The muscle was mounted horizontally between a Cambridge Technology 300B ergometer and a Kulite BG-10 force transducer. Positioning was accomplished via a three-dimensional manipulator mounted on the force transducer. The thermopile was mounted in a rectangular frame that was fitted into the muscle bath. Muscle height above the thermopile was also adjustable via a separate micrometer (not shown). In order to minimize convection currents, the chamber top was covered after muscle length adjustments were completed. Chamber temperature drift was less than 10−6°C s−1.
Myothermal protocol
A standard myothermal protocol was followed as described previously (Hasenfuss et al. 1991). After the muscle had been mounted in the Krebs solution-filled chamber as above, stimulation was applied via the ligature electrodes. Muscle length was slowly increased over the next 1 h to L0, the length at which maximum developed force was obtained.
Muscle temperature measurements must be obtained in a drained chamber to eliminate heat conduction through the bathing solution. During these drained periods, temperature-stabilized gas (9.5 % O2–5 % CO2) was slowly bubbled through a separate chamber containing Krebs solution, then this moistened air was passed into the muscle chamber. In this manner, a muscle can be maintained for several hours without re-immersion.
The general protocol for these experiments was as follows: (1) stop stimulation, drain the chamber, allow several minutes for muscle temperature to stabilize; (2) briefly heat the muscle by applying a 1 MHz sinusoidal current through the stimulus electrodes (Blanchard & Alpert, 1989), then measure the time course of temperature decline via the thermopile (this cool-off time constant represents the rate at which the muscle-thermopile system loses heat to the environment, and is used to calculate an effective heat capacity; Mulieri et al. 1977); (3) stimulate the muscle to contract, allowing temperature and isometric force to stabilize (3 min); (4) digitize three consecutive twitches (2 kHz); as shown in Fig. 2A and B, stimulation was withheld from the third ‘twitch’ to establish a falling temperature baseline that represented heat lost to the environment in the absence of contraction; (5) stop the stimulus, then measure the cool-off time constant again to check for evaporation; and (6) flood the muscle chamber with Krebs solution.
Figure 2. Steps involved in calculating initial heat.
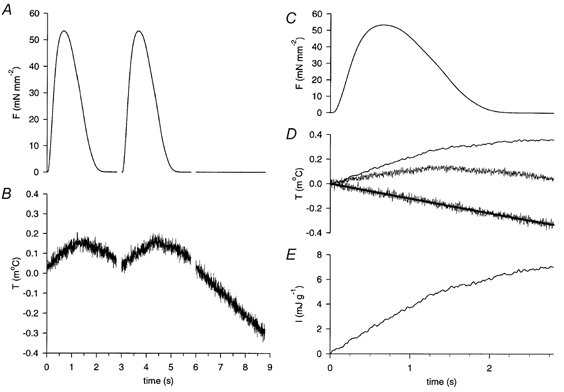
A and B show the time course of force (F) and temperature (T), respectively, for three consecutive twitches. The third ‘twitch’ was unstimulated. C, averaged force trace for the two stimulated twitches. D, lower trace: falling baseline of the third ‘twitch’ shown in B, fitted with a monoexponential curve. Middle trace: averaged temperature trace for the two stimulated twitches. Upper trace: filtered difference between the averaged temperature trace and monoexponential curve, representing the temperature change caused by a single twitch. E, initial heat (I), calculated from the baseline-subtracted temperature trace of D.
To differentiate between tension-independent and tension-dependent processes, this temperature measurement protocol was repeated after incubation in 2 and 4 mm 2,3-butanedione monoxime (BDM). BDM selectively inhibits cross-bridge cycling at these low doses (Alpert et al. 1989a).
After twitch force and temperature measurements were complete, maximum Ca2+-activated force (MCAF) was measured by incubating the muscle in Krebs solution containing 10 mm Ca2+, 50 μm cyclopiazonic acid and 1 μm ryanodine (Dobrunz et al. 1995) for 20 min, then applying a 10 Hz stimulus pulse train. This resulted in a fused tetanus of maximum amplitude; several muscles were also subjected to 12–15 mm Ca2+, which did not increase tetanic force. The muscle was then detached, blotted and weighed. Cross-sectional area (CSA) was calculated as mass/L0.
Ventricular wall mass and thickness
Right ventricular free-wall mass and thickness, as indices of ventricular hypertrophy, were measured. Wall thickness was determined using the depth-measuring rod of a pair of dial callipers (reading resolution 25 μm). The callipers were clamped vertically using a laboratory stand. The ventricle wall was quickly removed from liquid N2, weighed, placed below the callipers on a flat surface (glass microscope slide), and its thickness determined. It was then returned to liquid N2. In most preparations the wall was quite flat, but where it was slightly curved, the preparation was placed with the convex surface towards the microscope slide. The wall thickness was measured at two or three different points on the ventricle, and the mean value used.
MHC isoform determination
Frozen, powdered tissue was analysed for MHC isoform composition (V1, V2 and V3), as described by Hoh et al. (1978) with a minor alteration in the methods used for myosin purification (Litten et al. 1982). Purified myosin (1–2 μg of protein) was applied to the pyrophosphate gel, with electrophoresis carried out (60 V for 22 h at 2 °C) using a Pharmacia electrophoresis chamber (GE-2/4). A laser beam densitometer was used to scan the gels and assess isoform composition. Since the amount of the V2 isoform was negligible in these preparations, V1 and V3 are expressed as a percentage of total myosin (V1+ V3).
TnT, TnI, MLC1 and MLC2 isoform determination
Right ventricular papillary muscles were each placed in 100 μl of SDS buffer (McMahon et al. 1994). The proteins were resolved on 9.5 and 12.5 % polyacrylamide gels using SDS-PAGE. The conditions used were identical to those described previously (Anderson et al. 1988) except for the polyacrylamide concentrations. Gels were stained using a protein silver staining kit (17-1150-01, Amersham Pharmacia Biotech). The proteins in other gels were transferred to polyvinylidene difluoride membranes. Western blots were performed as described previously (Anderson & Oakley, 1989). The following monoclonal antibodies (MAbs) were used: a cTnT-specific antibody, MAb 13-11, which recognizes an epitope in a 17-residue peptide present in all cTnT isoforms and distant from the region of combinatorial alternative splicing that yields the four cTnT isoforms (Malouf et al. 1992, Greig et al. 1994); a cTnI-specific antibody, MAb 3350 (Bodor et al. 1997); a MAb that recognizes both cTnI and slow skeletal muscle TnI, MAb 3309 (Bodor et al. 1987); and MAbs specific for MLC1 and MLC2 isoforms (3A8.2 and 10C6.2, respectively; Daoud et al. 1992).
To ensure that differences in the TnT isoform expression profile were measured accurately, the absorbance measurements of the cTnT waveforms were obtained in the linear range (i.e. proportional to the amounts of protein). Protein from each papillary muscle was loaded on to the same SDS gel in six different dilutions, with the concentration reduced successively by a factor of three. The Western blots were scanned on an LKB Ultrascan densitometer. The area under the density peak of each cTnT isoform was measured and normalized to the amount of protein loaded in that lane. The results obtained for each isoform from each specimen were plotted against the protein load in order to determine the loads for which absorbance was linear. That absorbance was then used to compute the relative amount of the isoform in the specimen. Where more than one load resulted in linear absorbance, the average value was used. The percentages of cTnT2, cTnT3 and cTnT4 in each preparation were calculated as a fraction of the sum of the three isoforms. We did not include cTnT1 because it was not visible in the Western blots used to quantify cTnT2, cTnT3 and cTnT4.
Data analysis
Myothermal analysis
The time course of initial heat (I) was calculated from the temperature record, as shown in Fig. 2. Force (Fig. 2A) and temperature (Fig. 2B) data for two stimulated twitches were averaged (Fig. 2C and D, respectively), with the falling temperature baseline of the third unstimulated ‘twitch’ (Fig. 2B and D, lower trace) fitted to a monoexponential curve (Fig. 2D, thick line). The temperature time course associated with a single twitch was calculated as the difference between the averaged temperature trace and the falling baseline fit. This final curve (Fig. 2D, upper trace) was low-pass filtered (fc = 20 Hz) to reduce noise. The I generated by this twitch (Fig. 2E) was calculated as the product of this temperature time course and the effective heat capacity of the muscle and thermopile, corrected for heat loss (Mulieri et al. 1977). This calculation compensates for heat loss up to the time of measurement (Hill, 1939), while minimizing recovery heat associated with a single twitch (Bugnard, 1934).
Figure 3 shows the time course of muscle force (F), the force–time integral (FTI), I and tension-dependent heat (TDH) for representative muscles from the PO and PTU groups. The I trace represents both cross-bridge-related (TDH) and non-cross-bridge-related (tension-independent heat, TIH) processes. To extract the cross-bridge-related TDH, the procedure of Alpert et al. (1989a) was used. BDM was used to vary twitch force by selectively inhibiting cross-bridge cycling and associated heat generation without affecting tension-independent processes. The maximum twitch values for I and FTI, after incubation of the muscle in 2 and 4 mm BDM, were linearly extrapolated back to zero FTI (Fig. 3A and B, bottom panels). The heat generated at zero FTI represents TIH. This value, when expressed as a fraction of I in the fully functioning twitch, is proportionately subtracted from I to yield the TDH traces of Fig. 3.
Figure 3. Time course of F, integrated force (force–time integral, FTI), I and tension-dependent heat (TDH) during a twitch for papillary muscles from a pressure overload (PO) and a propylthiouracil (PTU)-treated rabbit heart.
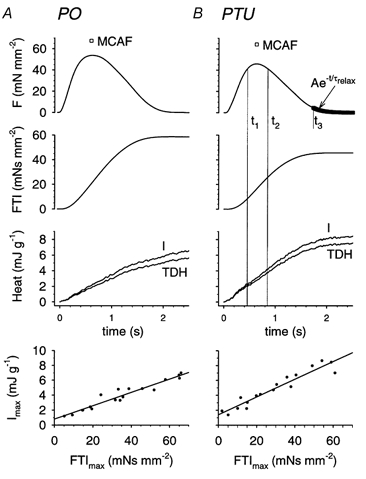
A, time course of F, FTI, I and TDH during a twitch for papillary muscles from a PO heart. B, time course of F, FTI, I and TDH during a twitch for papillary muscles from a PTU-treated heart. Also shown in the top panels of both A and B is the maximum Ca2+-activated force (MCAF, □) achieved during a high-Ca2+ tetanus. The time markers (t1 and t2) define an interval during which twitch force is greater than 90 % of its peak value (shown in B only for clarity). The increments in TDH and FTI over this period were used to compute the cross-bridge FTI (FTIXBr). The time value t3 indicates when twitch force had fallen to 10 % of its peak value; force subsequent to t3 is fitted to a single exponential (thick line) with time constant τrelax. The bottom panels show a linear fit to maximum (end of twitch) values for I versus FTI for multiple twitches, where FTI was altered using 2 and 4 mm BDM. The intercept represents tension-independent heat (TIH).
The following equations demonstrate how myothermal and mechanical data at the whole-muscle level can provide a composite view of the mechanical and kinetic aspects of the cross-bridge. Sarcomeres are arranged in series within the muscle, so each sarcomere must develop the same force as its neighbours. It is therefore reasonable to examine muscle parameters at the sarcomeric level.
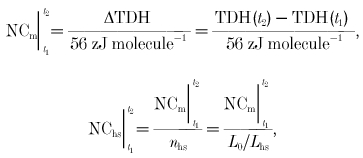
The number of cross-bridge cycles during a given time period can be computed from the cross-bridge enthalpy change (TDH) by assuming the enthalpy of creatine phosphate hydrolysis to be 34 kJ mole−1 (Woledge & Reilly, 1988), or 56 zJ molecule−1 (56 × 10−21 J molecule−1 = (34 × 103 J mole−1)/6.022 × 1023 molecules mole−1). The number of cycles during a time period t1 to t2, in the muscle (NCm) and in the half-sarcomere (NChs), is:
 |
(1) |
where nhs is the number of half-sarcomeres, L0 is muscle length and Lhs is the length of a half-sarcomere. These experiments were conducted at a muscle length where developed force is maximum, meaning that there is maximum cross-bridge overlap within each sarcomere. This occurs at a sarcomere length of 2 μm (Lhs = 1 μm).
FTIXBr is computed as muscle force–time integral (FTIm) normalized to the number of cross-bridge cycles occurring in a half-sarcomere (NChs). This has traditionally been calculated for the entire twitch (Hasenfuss et al. 1991). We have made this calculation, but the entire twitch may include some shortening of the sarcomeres due to series compliance at the ends of the muscle (Peterson et al. 1991). Since this is intended to be an isometric analysis of the cross-bridge, we also considered only the time period surrounding peak twitch force, where force and sarcomere length are relatively constant:
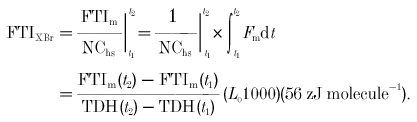 |
(2) |
The time frame chosen here (and used in the analysis below) is the period where twitch force exceeds 90 % of its peak value, as illustrated in Fig. 3B; thus, t1 and t2 are chosen such that F(t1) =F(t2) = 0.9P0, where P0 is peak twitch force. FTI for the entire twitch is calculated by evaluating between t1 = 0 and t2 = twitch time (TT) in eqn (2).
Two-state cross-bridge analysis
We have extended the above standard myothermal-mechanical analysis by considering a two-state model of cross-bridge cycling (Huxley, 1957; Brenner, 1988; Peterson & Alpert, 1998) where the bridge is either attached and generating force (A) or detached (D):
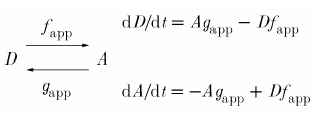 |
(3) |
Cross-bridge kinetics are defined by the apparent rate constants for attachment (fapp) and detachment (gapp). In the steady state, the number of attached and detached cross-bridges remains constant.
Thus,
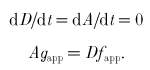 |
(4) |
The flux of cross-bridges away from the attached state is thus equal to the flux away from the detached state. This flux is in units of cross-bridges per second. To obtain the cycling rate (CR) of an individual cross-bridge, one must normalize this flux by the total number of cross-bridges (A+D).
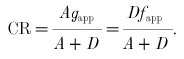 |
(5) |
The quantity A/(A+D), equal to the fraction of attached cross-bridges, can be related to the apparent rate constants as follows:
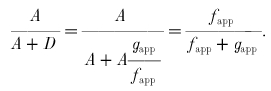 |
(6) |
Substituting eqn (6) into eqn (5), the cross-bridge CR is:
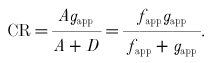 |
(7) |
In the steady state, the fraction of attached cross-bridges would be equal to the fraction of time spent by an individual cross-bridge in the attached state. This time ratio is known as the duty cycle (DC):
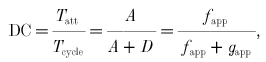 |
(8) |
where Tatt is the cross-bridge attachment time and Tcycle is the time required to complete one cross-bridge cycle. Tcycle (s cycle−1) is the reciprocal of CR (cycles s −1), so Tatt can be obtained by substituting eqn (7) into eqn (8) and solving:
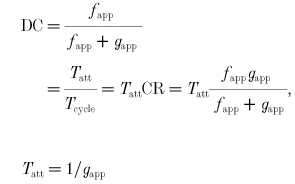 |
(9) |
We now have expressions for CR, DC and Tatt in terms of the apparent rate constants fapp and gapp. These expressions are valid only for a two-state model, and only during steady state. The next several equations explore different approaches for expressing the force developed within a cross-bridge.
The time course of cross-bridge force development is dependent upon many factors, including cross-bridge strain and filament velocity. For this analysis, we assume that during the peak of the twitch, under isometric conditions such that the thick and thin filaments are not sliding with respect to each other, the attached cross-bridge develops a constant force, Funi, while the detached cross-bridge develops zero force. Thus:
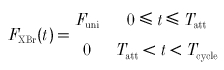 |
(10) |
where Funi is the constant, unitary force developed during attachment.
Over time, the average force (Favg) developed depends on attached force and DC:
| (11) |
Over the course of one cross-bridge cycle, the FTI is:
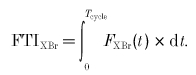 |
(12) |
From eqn (10), force is constant during attachment:
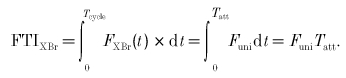 |
(13) |
Two-state parameter derivation from experimental results. The most obvious connection between experimental data and model parameters concerns FTIXBr, where the myothermal result (eqn (2)) can be directly applied to eqn (13):
| (14) |
The myothermal results can therefore provide an estimate of the product of Funi and attachment time, but are insufficient to estimate either parameter by itself. As an estimate of attachment time, consider a situation in which cross-bridges are not permitted to reattach once they have detached (i.e. fapp = 0). If no further attachments are permitted, eqn (3) can be represented as:
| (15) |
The solution to eqn (15) is:
| (16) |
where K is a constant. There is thus an exponential decline in the number of attached cross-bridges. Experimentally, this situation arises at the end of the twitch, where free Ca2+ has plummeted to baseline levels and little or no Ca2+ is bound to the thin filaments (Peterson et al. 1991). Taking force as a surrogate for A(t) in eqn (16), τrelax is obtained as the time constant of a single exponential curve fitted to late force decline (force time course corresponding to < 10 % of peak force; starting at time t3 in Fig. 3B). Tatt and gapp are related to τrelax by:
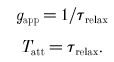 |
(17) |
Finally, maximum activation, achieved by tetanizing the muscle under high extracellular Ca2+ as discussed under ‘Procedures’, implies that all available cross-bridges are contributing to muscle force. We therefore estimated average cross-bridge force (Favg) as the ratio of maximum Ca2+-activated force (MCAF) to the number of cross-bridges in a half-sarcomere (Nhs):
| (18) |
The value of Nhs is taken as the concentration of myosin heads in the muscle (CXBr), scaled to the volume of a half-sarcomere:
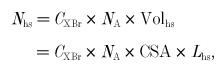 |
(19) |
where NA is Avogadro's number (6.022 × 10²³ mole−1), Volhs is the volume of a half-sarcomere, CSA is muscle cross-sectional area (mm2) and Lhs is the length of a half-sarcomere (0.001 mm). CXBr is taken as 160 × 10−6m = 160 × 10−12 mole mm−3 (Ferenczi et al. 1984).
In summary, gapp and Tatt are obtained directly from late relaxation force decline (eqn (17)). This allows the calculation of Funi from Tatt and the myothermal estimate of FTIXBr (eqn (14)). Favg is found from muscle dimensions and MCAF (eqns (18) and (19)). DC is obtained from Favg and Funi (eqn (11)), while fapp is found from DC and gapp (eqn (8)). Tcycle and CR are obtained from fapp and gapp (eqn (9)).
RESULTS
Measures of hypertrophy
The extent of right ventricular hypertrophy in the PO relative to the PTU group was assessed using measurements of right ventricular wall mass and thickness. Wall mass was 0.62 ± 0.04 g (mean ±s.e.m..) for the PTU group and 1.14 ± 0.15 g for the PO group, while wall thickness was 1.87 ± 0.09 mm for the PTU group and 2.84 ± 0.13 mm for the PO group. Hypertrophy, as defined by the change in both wall mass and thickness, was statistically significant (Hotelling's T2 test, P < 0.001)
Mechanical and myothermal measurements
Representative traces of isometric twitch force (F), FTI, I and TDH for the PO and PTU hearts are presented in Fig. 3. Table 1 shows force parameters (twitch P0 and FTI, tetanic MCAF), timing parameters for the twitch (time to peak tension (TPT), TT and τrelax), and the myothermal measurements of I, TIH and TDH for the PO and PTU preparations. Cool-off after sinusoidal heating yielded a time constant of 7.55 ± 0.48 s (mean ±s.e.m.., n = 11), for an effective heat capacity of 17.1 ± 1.1 mJ °C−1 for the muscle and thermopile.
Table 1.
Mechanical and myothermal muscle parameters for propylthiouracil (PTU) and pressure overload (PO) hearts
| PTU (n = 5) | PO (n = 6) | ||
|---|---|---|---|
| Muscle length | L0 (mm) | 5.3 ± 0.4 | 6.9 ± 0.4 * |
| Muscle cross-sectional area | CSA (mm2) | 0.64 ± 0.09 | 0.73 ± 0.11 |
| Isometric peak force | P0 (mN mm−2) | 42.4 ± 5.6 | 48.8 ± 5.0 |
| Maximum Ca2+-activated force | MCAF (mN mm−2) | 64.3 ± 4.7 | 59.1 ± 4.8 |
| Time to peak tension | TPT (ms) | 589 ± 20 | 599 ± 23 |
| Twitch time | TT (ms) | 1780 ± 130 | 1770 ± 190 |
| Relaxation time constant | τrelax (ms) | 170 ± 20 | 150 ± 20 |
| Initial heat | I (mJ g−1) | 8.6 ± 1.2 | 6.9 ± 1.1 |
| Tension-independent heat | TIH (mJ g−1) | 0.45 ± 0.2 | 0.68 ± 0.1 |
| Force–time integral, twitch | FTI (mN s mm−2) | 40.0 ± 6.7 | 48.6 ± 7.4 |
| Tension-dependent heat, twitch | TDH (mJ g−1) | 7.8 ± 1.1 | 6.1 ± 1.0 |
| FTI/TDH ratio, entire twitch duration | FTI/TDH | 4.9 ± 0.6 | 8.1 ± 1.0 * |
| Force–time integral, twitch peak | FTIpeak (mN s mm−2) | 15.3 ± 2.7 | 20.5 ± 3.3 |
| Tension-dependent heat, twitch peak | TDHpeak (mJ g−1) | 2.0 ± 0.3 | 1.7 ± 0.3 |
| FTI/TDH ratio, twitch peak | FTIpeak/TDHpeak | 7.6 ± 0.9 | 13.1 ± 1.7 * |
Values are means ±s.e.m. Statistically significant differences (P < 0.05, Student's unpaired t test) are marked with an asterisk. Force–time integral (FTI) and tension-dependent heat (TDH) measurements were obtained during the entire twitch and during the peak of the twitch, as explained in the text.
Cross-bridge FTI
We tested the hypothesis that the FTIXBr was increased in hypertrophy, even when no difference in MHC isoform composition was present, by comparing the FTIXBr in the PO and the PTU groups. According to eqn (2), the FTIXBr is essentially FTIm normalized to TDH. The combination of a higher FTIm with lower TDH in this ratio for the PO group yields a FTIXBr of 0.49 pN s, which was 63 % higher than that obtained for the PTU group (Table 2). Since internal shortening within the muscle can introduce errors in this estimate of FTI, we have also calculated the FTIXBr at the peak of the twitch, where force exceeds 90 % of its peak value (from t1 to t2 in Fig. 3B). This minimizes any possible artefacts introduced by internal shortening within the muscle, since force (and therefore compliant extension) remains relatively constant. In this case, FTIXBr at 0.9P0 (FTIXBr,0.9P0) was 0.8 pN s in the PO group, which was 78 % greater than for the PTU group, the difference being statistically significant (P = 0.01, two-tailed t test).
Table 2.
Derived cross-bridge parameters for PTU and PO hearts
| PTU (n = 5) | PO (n = 6) | ||
|---|---|---|---|
| Thermomechanical measurement | |||
| Cross-bridge force–time integral, entire twitch | FTIXBr,Tw (pN s) | 0.30 ± 0.03 | 0.49 ± 0.06 * |
| Cross-bridge force–time integral, peak of twitch | FTIXBr,0.9Po (pN s) | 0.45 ± 0.05 | 0.80 ± 0.10 * |
| Two-state model derivation | |||
| Unitary force | Funi (pN) | 2.7 ± 0.3 | 5.8 ± 0.9 * |
| Average force | Favg (pN) | 0.67 ± 0.05 | 0.61 ± 0.05 |
| Attachment time | Tatt (ms) | 170 ± 20 | 150 ± 20 |
| Cycle time | Tcycle (ms) | 690 ± 70 | 1190 ± 150 * |
| Cycling rate | CR (s−1) | 1.50 ± 0.14 | 0.89 ± 0.10 * |
| Duty cycle | DC | 0.24 ± 0.02 | 0.14 ± 0.03 * |
| Attachment rate | fapp (s−1) | 2.0 ± 0.2 | 1.0 ± 0.1 * |
| Detachment rate | gapp (s−1) | 6.3 ± 0.7 | 7.2 ± 1.0 |
Values are means ±s.e.m. Statistically significant differences (P < 0.05, Student's unpaired t test) are marked with an asterisk.
Derived cross-bridge parameters
The inter-relationship of the derived cross-bridge parameters as presented in Table 2 is shown schematically in Fig. 7. The Funi value of 2.7 ± 0.3 pN in the PTU hearts was 50 % of that generated in the PO preparations (P = 0.02). The DC and CR in PTU hearts were 0.24 ± 0.02 and 1.50 ± 0.14 s−1, respectively. DC and CR were 40–50 % less in the PO preparations than in the PTU preparations (P = 0.02 and P = 0.007, respectively).
Figure 7. Schematic representation of cross-bridge dynamics for PO and PTU hearts.
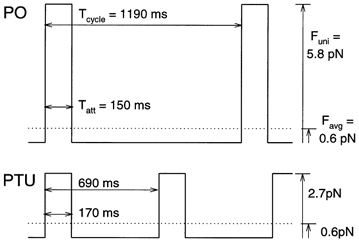
Both unitary force (Funi) and cycle times are significantly higher in the PO group than in the PTU group. Similar attachment times (Tatt) in the two groups, with a longer cycle duration (Tcycle) for PO, support the conclusion that the higher values reported previously for PO FTIXBr are entirely due to a higher Funi. The shorter duty cycle, combined with the higher Funi, yields an average force (Favg) for PO that is similar to that for PTU.
Biochemical analysis
Myosin
To confirm that the two experimental groups had similar myosin isoenzyme profiles, the relative percentages of the three isoenzymes of myosin, V1, V2 and V3, were measured. Pyrophosphate polyacrylamide gels indicated that V3 myosin was 99 ± 1 % (n = 5) of total myosin for PTU, and 100 ± 0 % (n = 4) for PO. Thus, any mechanical and kinetic changes involving the myocardial cross-bridge cycle in these animal models cannot be ascribed to shifts in the myosin isoform.
MLC1 and MLC2
MLC1 and MLC2 isoform expression was compared in the PO and PTU preparations, using normal rabbit atrial and ventricular myocardium as a reference for the heart chamber-specific isoforms. Western blot analysis demonstrated that only the ventricular isoform of MLC1 and of MLC2 were expressed in the PO and PTU right ventricular samples (Fig. 4). The electrophoretic mobility of MLC2 was the same in the PO and PTU preparations, suggesting no difference in phosphorylation (Liu et al. 1995).
Figure 4. Troponin I (TnI), myosin light chain 1 (MLC1) and myosin light chain 2 (MLC2) expression.
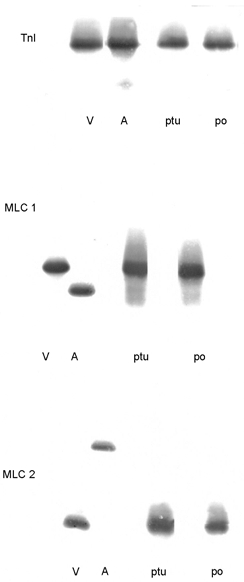
Tnl, right ventricular (V) and atrial (A) myocardium from a normal rabbit, and right ventricular myocardium from PTU and PO hearts were probed with a monoclonal antibody (MAb) that recognizes cardiac TnI (cTnI) and slow skeletal muscle TnI (ssTnI). The single band in the PTU and PO hearts indicates that only cTnI is expressed in these tissues. In the normal rabbit atrium, a band with a faster electrophoretic mobility than cTnI is present. This band has a different mobility from that of ssTnI and is probably a fragment of cTnI. MLC1, a MAb that recognizes atrial and ventricular MLC1 isoforms recognized only the ventricular isoform in the PTU and PO preparations. MLC2, a MAb that recognizes the atrial and ventricular isoforms of MLC2 recognized only the ventricular isoform in the PTU and PO preparations.
TnI
Experiments with a MAb specific for cTnI and slow skeletal muscle TnI demonstrated that only cTnI was expressed in the PO and PTU samples (Fig. 4). In both the PO and PTU preparations, a single band of cTnI with the same electrophoretic mobility was seen. Based on our previous study of cTnI phosphorylation in the human myocardium (Bodor et al. 1997), these results are consistent with the cTnI phosphorylation state being the same in the two groups. The MAb for cTnI did not recognize proteins with faster electrophoretic mobilities than cTnI. These results are consistent with the absence of cTnI proteolysis in both the PO and PTU preparations (Murphy et al. 2000).
TnT
Western blot and corresponding densitometric traces of right ventricular papillary muscles from PO and PTU hearts showed the presence of four cTnT isoforms (cTnT1–4; Fig. 5A and B). The cTnT MAb did not recognize proteins with faster electrophoretic mobilities than the cTnT isoforms, consistent with the absence of cTnT proteolysis in the PO and PTU myocardium (Chai et al. 2000). The differences in electrophoretic mobility among the isoforms are a result of the variable inclusion of two amino-terminal peptides (6 and 10 residues in length, Fig. 5C; Greig et al. 1994). We compared the relative amounts of TnT2 and TnT3 in the PO and PTU groups using Hotelling's T2 multivariate test (TnT4 was omitted since % TnT4 = 100–% TnT2–% TnT3, while the cTnT1 isoform was present in such small amounts as to be unmeasurable). The TnT isoform profile was significantly different (P = 0.001) between the two groups. A ternary plot showing the TnT isoform composition in the two groups is represented in Fig. 6. The two group clusters are separated along the TnT2 axis but not the two other axes (TnT3 and TnT4), indicating that the difference in the troponin T isoform profile is due to a difference in the percentage of TnT2 alone. The percentage composition for the cTnT2–4 isoforms for the PO and PTU ventricular preparations is presented in Table 3, where it can be seen that cTnT2 was 2.3 times greater in PO than in PTU.
Figure 5. Cardiac troponin T (TnT) isoforms.
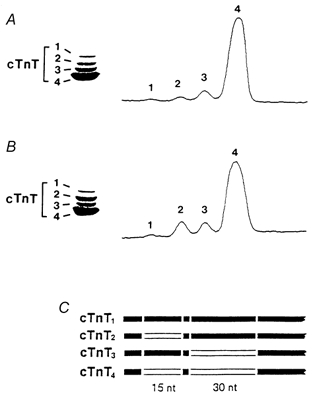
Western blot and densitometric scan of cTnT isoforms from a PTU-treated heart (A) and a PO heart (B). C, schematic representation of the N-terminus of the four cTnT isoforms, showing the alternatively spliced regions.
Figure 6. Ternary plot comparing PO and PTU ventricular TnT isoform composition.
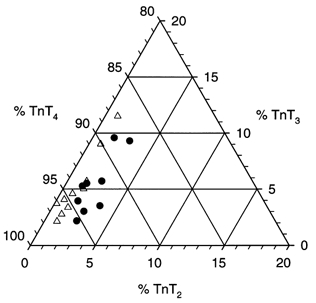
Since TnT1 was present in very small quantities, the sum of TnT2, TnT3 and TnT4 yields 100 % in each sample. The points are clustered near 1 % TnT2, 5 % TnT3 and 94 % TnT4. The PTU (▵) and PO (•) groups separate along the TnT2 axis but not along the other two axes, indicating that only the TnT2 isoform accounted for the significant difference in the TnT isoform profile of the two groups.
Table 3.
Right ventricular mass and isoforms of cardiac troponin T (cTnT) in PTU and PO hearts
| PTU (n = 10) | PO (n = 9) | |
|---|---|---|
| Percentage cTnT2 | 0.98 ± 0.013 | 2.29 ± 0.025 * |
| Percentage cTnT3 | 5.19 ± 0.93 | 5.33 ± 0.87 |
| Percentage cTnT4 | 93.83 ± 0.95 | 92.38 ± 0.86 |
| Wall thickness (mm) | 1.87 ± 0.09 | 2.84 ± 0.13 * |
| Wall mass (g) | 0.62 ± 0.04 | 1.14 ± 0.15 * |
cTnT values are expressed as a percentage of total cTnT, means ±s.e.m. Statistically significant differences (P < 0.05, Student's unpaired t test) are marked with an asterisk.
DISCUSSION
Alterations in cross-bridge kinetics as a result of age or hormonal intervention correlate well with the V3 MHC isoform in small mammals (Hasenfuss et al. 1991). Compared to V1 myosin, the V3 isoform is associated with reduced maximum shortening velocity (Pagani & Julian, 1984), reduced myosin and myofibrillar ATPase activity (Alpert et al. 1979; Litten et al. 1982), and increased economy of isometric force development (Holubarsch et al. 1985; Hasenfuss et al. 1992).
This mechanism for fine tuning myocardial performance is not available in humans since altered cross-bridge kinetics in heart failure is not associated with a shift in myosin isoform expression. Hasenfuss et al. (1991) observed that the PO rabbit ventricle showed characteristics similar to those observed in association with human heart failure, exhibiting significantly altered FTIXBr, with a small change in the MHC isoform relative to control tissue (100 % V3versus 88 % V3 in PO tissue versus control tissue, respectively).
This observation raised the intriguing possibility that similar mechanisms alter cross-bridge kinetics in human and rabbit hearts experiencing haemodynamic overload. However, one confounding factor is the small shift in myosin isoform population from control to PO in the rabbit. To exclude this isoform shift as a candidate for altering cross-bridge characteristics, in the study described here we compared the PO group to a group in which PTU was used to hormonally shift the myosin isoform population to 100 % V3 without causing ventricular hypertrophy. The 80 % greater ventricular free-wall mass and 50 % greater wall thickness in the PO group clearly confirm the presence of right ventricular hypertrophy.
Myocardial contraction energetics
Myothermal estimates of the FTIXBr have been used previously as an index of isometric cross-bridge performance in the intact muscle (Hasenfuss et al. 1991, 1992). We have shown a 60 % greater FTIXBr in the PO than in the PTU hearts, with no difference in the MHC isoform expression (100 % V3). Under these circumstances, the development of isometric force in the PO group is more economical than in the PTU hearts (i.e. less ATP is required for each unit of FTIm developed). This may be considered an adaptive response in that there is a decrease in coronary supply per unit of myocardium in the hypertrophied heart (Krams et al. 1998). With no difference in the measured MHC population between PO and PTU, these altered cross-bridge parameters must be mediated by mechanisms that are independent of the MHC population.
Thin and thick filament proteins
TnI, MLC1 and MLC2 isoforms
We tested whether the differences in FTIXBr were associated with altered expression of the TnI, MLC1 and MLC2 isoforms. These isoforms affect myofilament function (Kelly & Buckingham, 1997; Pawloski-Dahm et al. 1998; Schaub et al. 1998; Fentzke et al. 1999). Only cardiac TnI and the ventricular isoforms of MLC1 and MLC2 were expressed in the PO and PTU preparations (Fig. 4). Therefore, differences observed in cross-bridge kinetics and FTIXBr between the PO and PTU groups cannot be explained by the occurrence of switching in these contractile protein isoforms.
Alterations in the phosphorylation state of the contractile proteins can also affect myofilament function. cAMP-dependent phosphorylation of cardiac TnI has been shown to decrease the sensitivity of the myofilaments to Ca2+, and protein kinase C phosphorylation of cardiac TnI has been shown to decrease maximal myofibrillar ATPase activity (Noland et al. 1995). In our study of cardiac TnI phosphorylation in the human heart, we found that cardiac TnI was present as two bands in myocardium taken from the normal heart, and essentially only one of these bands was found in myocardium taken from failing human hearts (Bodor et al. 1997). Using the catalytic unit of protein kinase A (PKA) and a MAb specific for the cardiac TnI sequence containing the serines phosphorylated by PKA, we found that the additional band of cardiac TnI in the normal human heart was a more phosphorylated form apparently due to cAMP-dependent phosphorylation (Bodor et al. 1997). The similarity of cTnI electrophoretic mobility in PO and PTU preparations from this current study indicates that the phosphorylation state of cardiac TnI was the same in these preparations. We also found that the electrophoretic mobility of MLC2 was the same in the PO and PTU preparations, suggesting that the phosphorylation state was the same (Liu et al. 1995).
TnT isoforms
In the study presented here, we have demonstrated a greater expression of the cTnT2 isoform in PO myocardium. Although we do not know whether the small change in isoform expression contributed to the observed changes in cross-bridge kinetics, the results of previous studies suggest that the TnT isoforms modulate myofilament function (Tobacman & Lee, 1987; McAuliffe et al. 1990; Anderson et al. 1991; Godt et al. 1991; Nassar et al. 1991; Saba et al. 1996). In the normal and failing human heart, where V3 is the dominant MHC isoform, a correlation has been found between cTnT isoform expression and maximal myofibrillar ATPase activity (Anderson et al. 1991, 1995). It has been found that in the rabbit heart, greater expression of cTnT2 is associated with an increase in myofilament sensitivity to Ca2+ (Nassar et al. 1991). In myocardium from the neonatal rabbit, McAuliffe et al. (1990) found that a decrease in myofilament sensitivity to Ca2+ was associated with a fall in the expression of cTnT1 and cTnT2. Future studies using myocardium from transgenic animals will test whether a change in cTnT2 expression caused the differences in cross-bridge kinetics we observed between the PO and PTU preparations.
Our analysis of potential changes in the thick and thin filament proteins was not exhaustive. Modifications or changes in the isoform expression of other contractile proteins may have contributed to the difference in the FTIXBr between the PO and PTU hearts.
The two-state cross-bridge model
From mechanical and thermal measurements we were able to determine the FTIXBr. By combining these measurements with a two-state cross-bridge model, we can provide a framework for additional insight into the cross-bridge cycle in PTU and PO hearts. For example, our data indicate that the greater FTI found in the PO hearts results primarily from a doubling of Funi.
The greatest benefit of applying this analysis to the intact muscle is that the cross-bridge is in its native environment. The intracellular milieu, osmotic forces and filament superstructure are unchanged from their in situ values. In using the two-state model, however, one must be cognisant of the assumptions underlying this analysis. Besides the obvious assumption of a two-state cross-bridge, we assumed that MCAF and myosin concentration can be used to calculate Favg (eqn (18)). We further assumed that the time constant of force decay during the last portion of the isometric twitch can be used to calculate cross-bridge gapp (eqns (15)–(17)).
Figure 7 shows an idealized summary of our model results. The PO and PTU cross-bridges stay attached for the same amount of time during the cycle, although the longer cycle duration (Tcycle) for PO results in a diminished DC. While attached, the PO cross-bridge develops more force than the PTU cross-bridge, leading to a greater FTI. Favg is similar in the two groups, since the greater Funi in the PO preparations is offset by a decreased DC. In essence, the similar Favg in the PO and PTU groups is a result of a doubled Funi in PO coupled with a 50 % decrease in attachment rate (see Table 2 and Fig. 7).
Two of these derived parameters, Funi and DC, have been measured by others using a variety of techniques. A comparison of our results with the literature indicates that our model-based interpretation of the myothermal- mechanical data is in line with other techniques.
Isometric Funi for single myosin molecules has been measured using a dual-beam laser trap system under feedback control (Palmiter et al. 1999). The Funi for V3 myosin was 0.8 ± 0.4 pN (n = 16). In another system using a single-beam laser trap system under feedback control, V3 myosin developed a Funi of 1.6 ± 0.9 pN (n = 457; Suguira et al. 1998). These values differ by a factor of two, though they are both lower than our lowest derived value (2.7 pN for PTU). Given the variability in technique, and our hypothesis that non-contractile proteins may play an important role in force development, we feel that the in vitro results are compatible with our own.
The characterization of cross-bridge DC has been a subject of some controversy. The present study proposes DCs in the range of 0.14–0.24, which is equivalent to 14–24 % of the cross-bridges being attached at any given moment in a fully activated muscle. This is comparable to the 25 % binding seen in activated cross-linked skeletal myofibrils, estimated with tryptic digestion rates (Duong & Reisler, 1989; Berger & Thomas, 1993). In contrast, active stiffness in skeletal muscle fibres is approximately 70 % of rigor stiffness (Kawai et al. 1993; Barnett & Thomas, 1989), implying that 70 % of the cross-bridges are attached. However, stiffness measurements should be interpreted with caution since electron paramagnetic resonance studies have shown that cross-bridge binding can be reduced by 50 % on addition of pyrophosphate or adenylyl imidophosphate, with no change in stiffness (Pate & Cooke, 1988; Barnett & Thomas, 1989). This is consistent with the notion that the stiffness contributed by a myosin molecule is present whether one or both of the cross-bridges on that molecule are attached, such that stiffness could overestimate cross-bridge attachment by a factor of two. With this factor in mind, the 50 % relative stiffness reported by Kawai & Zhao (1993) in ferret myocardium is in agreement with the 24 % DC seen here for the PTU rabbit. This value is further decreased in the PO group.
Conclusion
Cross-bridge interaction kinetics, as exemplified by the FTIXBr, are known to depend on the MHC profile in small mammals. Similar kinetic changes are observed in the failing heart of humans and of small mammals, yet the MHC profile of the human heart remains constant at 100 % V3. The results of the present study demonstrate that FTIXBr in the haemodynamically stressed PO rabbit heart is 60 % higher than that of the PTU-treated heart, while both preparations contain 100 % V3 MHC. Based on a synthesis of myothermal, biochemical and mathematical approaches, we suggest that cross-bridge Funi in the PO heart is twice that of the PTU heart, while both DC and CR are roughly half of the PTU values. Further studies are clearly warranted to test rigorously whether TnT2 or unrecognized changes in other proteins cause the observed haemodynamic overload changes in cross-bridge cycling kinetics.
Acknowledgments
This work was supported in part by National Heart, Lung, and Blood Institute grants R29 HL50603 (J.N.P.), P01 HL28001, R01 HL55641, R01 HL66157 (N.R.A.), and R01 HL42250, R01 HL20749 and R01 HL63937 (P.A.W.A., R.N.). The authors thank Ilene Morgan for surgical assistance and Annette E. Oakeley for her help in acquiring and analysing the SDS-PAGE and Western blot data and in the preparation of the manuscript.
References
- Alpert NR, Blanchard EM, Mulieri LA. Tension-independent heat in rabbit papillary muscle. Journal of Physiology. 1989a;414:433–453. doi: 10.1113/jphysiol.1989.sp017697. [DOI] [PMC free article] [PubMed] [Google Scholar]
- Alpert NR, Blanchard EM, Mulieri LA, Nagai R, Zarain-Herberg A, Periasamy M. Genetic and non-genetic control of myocardial calcium. Basic Research in Cardiology. 1989b;84:55–66. doi: 10.1007/BF02650347. [DOI] [PubMed] [Google Scholar]
- Alpert NR, Gordon MS. Myofibrillar adenosine triphosphatase activity in congestive heart failure. American Journal of Physiology. 1962;202:940–946. doi: 10.1152/ajplegacy.1962.202.5.940. [DOI] [PubMed] [Google Scholar]
- Alpert NR, Mulieri LA, Litten RZ. Functional significance of altered myosin adenosine triphosphatase activity in enlarged hearts. American Journal of Cardiology. 1979;44:946–953. doi: 10.1016/0002-9149(79)90227-3. [DOI] [PubMed] [Google Scholar]
- Anderson PA, Greig A, Mark TM, Malouf NN, Oakeley AE, Ungerleider RM, Allen PD, Kay BK. Molecular basis of human cardiac troponin T isoforms expressed in the developing, adult, and failing heart. Circulation Research. 1995;76:681–686. doi: 10.1161/01.res.76.4.681. [DOI] [PubMed] [Google Scholar]
- Anderson PA, Malouf NN, Oakeley AE, Pagani ED, Allen PD. Troponin T isoform expression in humans. A comparison among normal and failing adult heart, fetal heart, and adult and fetal skeletal muscle. Circulation Research. 1991;69:1226–1233. doi: 10.1161/01.res.69.5.1226. [DOI] [PubMed] [Google Scholar]
- Anderson PA, Moore GE, Nassar RN. Developmental changes in the expression of rabbit left ventricular troponin T. Circulation Research. 1988;63:742–747. doi: 10.1161/01.res.63.4.742. [DOI] [PubMed] [Google Scholar]
- Anderson PA, Oakeley AE. Immunological identification of five troponin T isoforms reveals an elaborate maturational troponin T profile in rabbit myocardium. Circulation Research. 1989;65:1087–1093. doi: 10.1161/01.res.65.4.1087. [DOI] [PubMed] [Google Scholar]
- Arai M, Otsu K, Maclennan DH, Alpert NR, Periasamy M. Effect of thyroid hormone on the expression of mRNA encoding sarcoplasmic reticulum proteins. Circulation Research. 1991;69:266–276. doi: 10.1161/01.res.69.2.266. [DOI] [PubMed] [Google Scholar]
- Barnett VA, Thomas DD. Microsecond rotational motion of spin-labeled myosin heads during isometric muscle contraction. Saturation transfer electron paramagnetic resonance. Biophysical Journal. 1989;56:517–523. doi: 10.1016/S0006-3495(89)82698-0. [DOI] [PMC free article] [PubMed] [Google Scholar]
- Berger CL, Thomas DD. Rotational dynamics of actin-bound myosin heads in active myofibrils. Biochemistry. 1993;32:3812–3821. doi: 10.1021/bi00065a038. [DOI] [PubMed] [Google Scholar]
- Blanchard EM, Alpert NR. Tension independent heat reflects phospholamban regulation of sarcoplasmic reticulum activity in rabbit papillary muscle. Progress in Clinical and Biological Research. 1989;315:606–607. [PubMed] [Google Scholar]
- Bodor GS, Oakeley AE, Allen PD, Crimmins DL, Ladenson JH, Anderson PAW. Troponin I phosphorylation in the normal and failing human heart. Circulation. 1997;96:1495–1500. doi: 10.1161/01.cir.96.5.1495. [DOI] [PubMed] [Google Scholar]
- Brenner B. Effect of Ca2+ on cross-bridge turnover kinetics in skinned single rabbit psoas fibers: implications for regulation of muscle contraction. Proceedings of the National Academy of Sciences of the USA. 1988;85:3265–3269. doi: 10.1073/pnas.85.9.3265. [DOI] [PMC free article] [PubMed] [Google Scholar]
- Bugnard L. The relation between total and initial heat in single muscle twitches. Journal of Physiology. 1934;82:509–519. doi: 10.1113/jphysiol.1934.sp003203. [DOI] [PMC free article] [PubMed] [Google Scholar]
- Chai PJ, Nassar R, Oakeley AE, Craig DM, Quick G, Jaggers J, Sanders SP, Ungerleider RM, Anderson PAW. Soluble complement receptor-1 protects heart, lung, and cardiac myofilament function from cardiopulmonary bypass damage. Circulation. 2000;101:541–546. doi: 10.1161/01.cir.101.5.541. [DOI] [PubMed] [Google Scholar]
- Daoud E, Porter S, Landt Y, Ladenson Y, Ladenson J. Development and characterization of monoclonal antibodies specific for myosin light chains. Clinical Chemistry. 1992;38:989. [Google Scholar]
- Dobrunz LE, Backx PH, Yue DT. Steady-state [Ca2+]i-force relationship in intact twitching cardiac muscle: direct evidence for modulation by isoproterenol and EMD 53998. Biophysical Journal. 1995;69:189–201. doi: 10.1016/S0006-3495(95)79889-7. [DOI] [PMC free article] [PubMed] [Google Scholar]
- Duong AM, Reisler E. Binding of myosin to actin in myofibrils during ATP hydrolysis. Biochemistry. 1989;28:1307–1313. doi: 10.1021/bi00429a054. [DOI] [PubMed] [Google Scholar]
- Fentzke RC, Buck SH, Patel JR, Lin H, Wolska BM. Impaired cardiac myocyte relaxation and diastolic function in transgenic mice expressing slow skeletal troponin I in the heart. Journal of Physiology. 1999;517:143–157. doi: 10.1111/j.1469-7793.1999.0143z.x. [DOI] [PMC free article] [PubMed] [Google Scholar]
- Ferenczi MA, Homsher E, Trentham DR. The kinetics of magnesium adenosine triphosphate cleavage in skinned muscle fibres of the rabbit. Journal of Physiology. 1984;352:575–599. doi: 10.1113/jphysiol.1984.sp015311. [DOI] [PMC free article] [PubMed] [Google Scholar]
- Godt RE, Fogaca RT, Nosek TM. Changes in force and calcium sensitivity in the developing avian heart. Canadian Journal of Physiology and Pharmacology. 1991;69:1692–1697. doi: 10.1139/y91-251. [DOI] [PubMed] [Google Scholar]
- Greig A, Hirschberg Y, Anderson PA, Hainsworth C, Malouf NN, Oakeley AE, Kay BK. Molecular basis of cardiac troponin T isoform heterogeneity in rabbit heart. Circulation Research. 1994;74:41–47. doi: 10.1161/01.res.74.1.41. [DOI] [PubMed] [Google Scholar]
- Hamrell BB, Alpert NR. The mechanical characteristics of hypertrophied rabbit cardiac muscle in the absence of congestive heart failure: the contractile and series elastic elements. Circulation Research. 1977;40:20–25. doi: 10.1161/01.res.40.1.20. [DOI] [PubMed] [Google Scholar]
- Hamrell BB, Dey SK. Sarcomere shortening velocity in pressure overload hypertrophied rabbit right ventricular myocardium at physiological sarcomere lengths. Journal of Molecular and Cellular Cardiology. 1993;25:1483–1500. doi: 10.1006/jmcc.1993.1164. [DOI] [PubMed] [Google Scholar]
- Hasenfuss G, Mulieri LA, Blanchard EM, Holubarsch C, Leavitt BJ, Ittleman F, Alpert NR. Energetics of isometric force development in control and volume-overload human myocardium. Comparison with animal species. Circulation Research. 1991;68:836–846. doi: 10.1161/01.res.68.3.836. [DOI] [PubMed] [Google Scholar]
- Hasenfuss G, Mulieri LA, Leavitt BJ, Allen PD, Haeberle JR, Alpert NR. Alteration of contractile function and excitation-contraction coupling in dilated cardiomyopathy. Circulation Research. 1992;70:1225–1232. doi: 10.1161/01.res.70.6.1225. [DOI] [PubMed] [Google Scholar]
- Hill AV. Recovery heat in muscle. Proceedings of the Royal Society. 1939;127:297–307. [Google Scholar]
- Hoh JF, McGrath PA, Hale PT. Electrophoretic analysis of multiple forms of rat cardiac myosin: effects of hypophysectomy and thyroxine replacement. Journal of Molecular and Cellular Cardiology. 1978;10:1053–1076. doi: 10.1016/0022-2828(78)90401-7. [DOI] [PubMed] [Google Scholar]
- Holubarsch C, Goulette RP, Litten RZ, Martin BJ, Mulieri LA, Alpert NR. The economy of isometric force development, myosin isoenzyme pattern and myofibrillar ATPase activity in normal and hypothyroid rat myocardium. Circulation Research. 1985;56:78–86. doi: 10.1161/01.res.56.1.78. [DOI] [PubMed] [Google Scholar]
- Huxley AF. Muscle structure and theories of contraction. Progress in Biophysics and Biophysical Chemistry. 1957;7:255–318. [PubMed] [Google Scholar]
- Kawai M, Saeki Y, Zhao Y. Crossbridge scheme and the kinetic constants of elementary steps deduced from chemically skinned papillary and trabecular muscles of the ferret. Circulation Research. 1993;73:35–50. doi: 10.1161/01.res.73.1.35. [DOI] [PubMed] [Google Scholar]
- Kawai M, Zhao Y. Cross-bridge scheme and force per cross-bridge state in skinned rabbit psoas muscle fibers. Biophysical Journal. 1993;65:638–651. doi: 10.1016/S0006-3495(93)81109-3. [DOI] [PMC free article] [PubMed] [Google Scholar]
- Kelly R, Buckingham M. Manipulating myosin light chain 2 isoforms in vivo: a transgenic approach to understanding contractile protein diversity. Circulation Research. 1997;80:751–753. doi: 10.1161/01.res.80.5.751. [DOI] [PubMed] [Google Scholar]
- Krams R, Kofflard MJ, Duncker DJ, Von Birgelen C, Carlier S, Kliffen M, Ten Cate FJ, Serruys PW. Decreased coronary flow reserve in hypertrophic cardiomyopathy is related to remodeling of the coronary microcirculation. Circulation. 1998;27:230–233. doi: 10.1161/01.cir.97.3.230. [DOI] [PubMed] [Google Scholar]
- Ling E, O'Brien PJ, Salemo T, Ianuzzo CD. Effects of different thyroid treatments on the biochemical characteristics of rabbit myocardium. Canadian Journal of Cardiology. 1988;4:301–306. [PubMed] [Google Scholar]
- Litten RZ, Martin BJ, Buchthal RH, Nagai R, Low RB, Alpert NR. Heterogeneity of myosin isozyme content of rabbit heart. Circulation Research. 1985;57:406–414. doi: 10.1161/01.res.57.3.406. [DOI] [PubMed] [Google Scholar]
- Litten RZ, 3rd, Martin BJ, Low RB, Alpert NR. Altered myosin isozyme patterns from pressure-overloaded and thyrotoxic hypertrophied rabbit hearts. Circulation Research. 1982;50:856–864. doi: 10.1161/01.res.50.6.856. [DOI] [PubMed] [Google Scholar]
- Liu X, Shao Q, Dhalla NS. Myosin light chain phosphorylation in cardiac hypertrophy and failure due to myocardial infarction. Journal of Molecular Cell and Cardiology. 1995;27:2613–2621. doi: 10.1006/jmcc.1995.0048. [DOI] [PubMed] [Google Scholar]
- McAuliffe JJ, Gao LZ, Solaro RJ. Changes in myofibrillar activation and troponin C Ca2+ binding associated with troponin T isoform switching in developing rabbit heart. Circulation Research. 1990;66:1204–1216. doi: 10.1161/01.res.66.5.1204. [DOI] [PubMed] [Google Scholar]
- McMahon DK, Anderson PA, Nassar R, Bunting JB, Saba Z, Oakeley AE, Malouf NN. C2C12 cells: biophysical, biochemical, and immunocytochemical properties. American Journal of Physiology. 1994;266:C1795–1802. doi: 10.1152/ajpcell.1994.266.6.C1795. [DOI] [PubMed] [Google Scholar]
- Malouf NN, McMahon D, Oakeley AE, Anderson PA. A cardiac troponin T epitope conserved across phyla. Journal of Biological Chemistry. 1992;267:9269–9274. [PubMed] [Google Scholar]
- Maughan D, Low E, Litten R, Brayden J, Alpert N. Calcium-activated muscle from hypertrophied rabbit hearts. Circulation Research. 1979;44:279–287. doi: 10.1161/01.res.44.2.279. [DOI] [PubMed] [Google Scholar]
- Mulieri LA, Luhr G, Trefry J, Alpert NR. Metal-film thermopiles for use with rabbit right ventricular papillary muscles. American Journal of Physiology. 1977;233:C146–156. doi: 10.1152/ajpcell.1977.233.5.C146. [DOI] [PubMed] [Google Scholar]
- Murphy AM, Kögler H, Georgakopoulos D, McDonough JL, Kass DA, Van Eyk JE, Marbán E. Transgenic mouse model of stunned myocardium. Science. 2000;287:488–491. doi: 10.1126/science.287.5452.488. [DOI] [PubMed] [Google Scholar]
- Nassar R, Malouf NN, Kelly MB, Oakeley AE, Anderson PA. Force-pCa relation and troponin T isoforms of rabbit myocardium. Circulation Research. 1991;69:1470–1475. doi: 10.1161/01.res.69.6.1470. [DOI] [PubMed] [Google Scholar]
- Noland TA, Jr, Guo X, Raynor RL, Jideama NM, Averyhart-Fullard V, Solaro RJ, Kuo JF. Cardiac troponin I mutants. Journal of Biological Chemistry. 1995;270:25445–25454. doi: 10.1074/jbc.270.43.25445. [DOI] [PubMed] [Google Scholar]
- Pagani ED, Alousi AA, Grant AM, Older TM, Dziuban SW, Jr, Allen PD. Changes in myofibrillar content and Mg-ATPase activity in ventricular tissues from patients with heart failure caused by coronary artery disease, cardiomyopathy, or mitral valve insufficiency. Circulation Research. 1988;63:380–385. doi: 10.1161/01.res.63.2.380. [DOI] [PubMed] [Google Scholar]
- Pagani ED, Julian FJ. Rabbit papillary muscle myosin isozymes and the velocity of muscle shortening. Circulation Research. 1984;54:586–594. doi: 10.1161/01.res.54.5.586. [DOI] [PubMed] [Google Scholar]
- Palmiter KA, Tyska MJ, Dupuis DE, Alpert NR, Warshaw DM. Kinetic differences at the single molecule level account for the functional diversity of rabbit cardiac myosin isoforms. Journal of Physiology. 1999;519:669–678. doi: 10.1111/j.1469-7793.1999.0669n.x. [DOI] [PMC free article] [PubMed] [Google Scholar]
- Pate EF, Cooke R. Energetics of the actomyosin bond in the filament array of muscle fibers. Biophysical Journal. 1988;53:561–573. doi: 10.1016/S0006-3495(88)83136-9. [DOI] [PMC free article] [PubMed] [Google Scholar]
- Pawloski-Dahm CM, Song G, Kirkpatrick DL, Palermo J, Gulick J, Dorn GW, 2nd, Robbins J, Walsh RA. Effects of total replacement of atrial myosin light chain-2 with the ventricular isoform in atrial myocytes of transgenic mice. Circulation. 1998;97:1508–1513. doi: 10.1161/01.cir.97.15.1508. [DOI] [PubMed] [Google Scholar]
- Peterson JN, Alpert NR. Cross-bridge dynamics in the contracting heart. Advances in Experimental Medicine and Biology. 1998;453:117–123. doi: 10.1007/978-1-4684-6039-1_14. [DOI] [PubMed] [Google Scholar]
- Peterson JN, Hunter WC, Berman MR. Estimated time course of Ca2+ bound to troponin C during relaxation in isolated cardiac muscle. American Journal of Physiology. 1991;260:H1013–1024. doi: 10.1152/ajpheart.1991.260.3.H1013. [DOI] [PubMed] [Google Scholar]
- Saba Z, Nassar R, Ungerleider RM, Oakeley AE, Anderson PAW. Cardiac troponin T isoform expression correlates with pathophysiological descriptors in patients who underwent corrective surgery for congenital heart disease. Circulation. 1996;94:472–476. doi: 10.1161/01.cir.94.3.472. [DOI] [PubMed] [Google Scholar]
- Schaub MC, Hefti MA, Zuellig RA, Morano I. Modulation of contractility in human cardiac hypertrophy by myosin essential light chain isoforms. Cardiovascular Research. 1998;37:381–404. doi: 10.1016/s0008-6363(97)00258-7. [DOI] [PubMed] [Google Scholar]
- Schiaffino S, Reggiani C. Molecular diversity of myofibrillar proteins: gene regulation and functional significance. Physiological Reviews. 1996;76:371–423. doi: 10.1152/physrev.1996.76.2.371. [DOI] [PubMed] [Google Scholar]
- Suguira S, Kobayakawa N, Fujita H, Yamishita H, Monomura S, Chaen S, Omata M, Sugi H. Comparison of unitary displacements and forces between two cardiac myosin isoforms by optical trap technique. Circulation Research. 1998;82:1029–1034. doi: 10.1161/01.res.82.10.1029. [DOI] [PubMed] [Google Scholar]
- Tobacman LS, Lee R. Isolation and functional comparison of bovine cardiac troponin T isoforms. Journal of Biological Chemistry. 1987;262:4059–4064. [PubMed] [Google Scholar]
- Woledge RC, Reilly PJ. Molar enthalpy change for hydrolysis of phosphorylcreatine under conditions in muscle cells. Biophysical Journal. 1988;54:97–104. doi: 10.1016/S0006-3495(88)82934-5. [DOI] [PMC free article] [PubMed] [Google Scholar]