

Abstract
Caveolins are integral proteins of glycolipid/cholesterol-rich plasmalemmal caveolae domains, where, they may function as a plasma membrane scaffold onto which many classes of signalling molecules, including receptors and heterotrimeric G proteins, can assemble. To ascertain whether caveolins influence G protein-mediated signal transduction, we stably expressed caveolin-1 and −3 isoforms in the neuroblastoma × glioma NG108–15 hybrid cell line, lacking endogenous caveolins. Subsequently, using whole-cell voltage clamp methods, we examined whether the modulation of N-type voltage-gated Ca2+ channels by Go protein-coupled, δ-type opioid receptors might be affected by recombinant caveolin expression.
In transfected NG108–15 cells, caveolins localized at the plasma membrane and, upon subcellular fractionation on sucrose density gradients, they co-localized in Triton-resistant, low buoyancy fractions, with endogenous Go protein α-subunits.
The voltage-dependent inhibition of ω-conotoxin GVIA-sensitive Ba2+ currents following either activation of δ-opioid receptors by the agonist [o-pen2,o-pen5]-enkephalin (DPDPE), or direct stimulation of G proteins with guanosine 5′-O-(thiotriphosphate) (GTPγS) was significantly attenuated in caveolin-expressing cells. The kinetics of Ca2+ channel inhibition were also modified by caveolins.
Overall, these results suggest that caveolins may negatively affect G protein-dependent regulation of voltage-gated N-type Ca2+ channels, presumably by causing a reduction of the available pool of activated G proteins.
Several lines of evidence suggest that G protein-coupled receptors (GPCRs), heterotrimeric G proteins, and intracellular effectors are not freely mobile molecules within the plane of the membrane, but are assembled as spatially organized complexes (Neubig, 1994). Recent support of this view for come from the isolation of detergent-insoluble membrane domains, enriched with glycosphingolipids and cholesterol (generally termed lipid rafts). At least two types of these domains have been described: caveolae domains, which contain caveolins as main structural protein components, and non-caveolar domains, which lack caveolins. As both types of domains contain a number of signalling proteins, including GPCR and G proteins (Harder & Simons, 1997; Anderson, 1998), they may represent plasma membrane ‘hot spots’ where signal transducing polypeptides are spatially compartmentalized (Okamoto et al. 1998; Shaul & Anderson, 1998).
Besides representing the main structural proteins of caveolae, caveolins may functionally regulate the activation state of caveolae-associated G protein α-subunits, by preferentially binding and stabilizing their inactive conformations, through the inhibition of GDP-GTP exchange (GDI-like activity), and/or the stimulation of GTP hydrolysis (GAP-like activity) (Li et al. 1995). Whether these findings have any bearing on G protein-mediated signal transduction cascades remains to be seen.
In the present study we wanted to determine whether caveolins could affect the G protein-mediated regulation of N-type Ca2+ channels. To achieve this, we stably expressed recombinant caveolin-1 and −3 isoforms in the neuroblastoma × glioma NG108–15 hybrid cell line, lacking endogenous caveolins and caveolae (Gorodinsky & Harris, 1995). Upon in vitro differentiation NG108–15 cells acquire a neuron-like phenotype and express N-type Ca2+ channels (Kasai & Neher, 1992), that are inhibited by Go protein-coupled δ-opioid receptors (Kasai, 1992; Toselli et al. 1999). These features make these cells an ideal model for investigating whether caveolins play any modulatory role in a G protein-mediated signal transduction cascade, represented by opioid receptor regulation of the voltage-gated Ca2+ channel effector system. This might be physiologically relevant in view of the recent finding that caveolin-1 has been detected in differentiating PC12 cells, and dorsal root ganglion (DRG) neurons (Galbiati et al. 1998), both carrying δ-opioid receptors negatively coupled to N-type Ca2+ channels (Streit & Lux, 1987; Womack & McCleskey, 1995; Yeh et al. 1998).
Down-modulation of N-type Ca2+ channel activity is an important mechanism of presynaptic inhibition (Koh & Hille, 1997) involving both cytosolic and membrane-delimited pathways (Diversé-Pierluissi et al. 1995; Toselli & Taglietti, 1995). The latter can be relieved by brief and strong depolarizations through a mechanism termed facilitation (Bean, 1989; Grassi & Lux, 1989). This mechanism could be physiologically important in relieving presynaptic inhibition in vivo (Brody et al. 1997; Park & Dunlap, 1998; Tosetti et al. 1999).
We show herein that in caveolin-1 (cav1(+))- and caveolin-3 (cav3(+))-expressing NG108–15 cells the inhibition of N-type Ca2+ channels, achieved by the agonist-induced stimulation of δ-opioid receptors, or by the direct activation of G proteins with guanosine 5′-O-[thiotrisphosphate] (GTPγS), is significantly attenuated. These results may be useful for making predictions about the effects of endogenous caveolins in neurons, where they might significantly influence G protein modulation of voltage-gated Ca2+ channels.
METHODS
Materials
The pCB-7 eukaryotic expression vectors, carrying the hygromycin resistance gene encoding canine caveolin-1 and rat caveolin-3 cDNAs, were a kind gift from M. P. Lisanti (Albert Einstein College of Medicine, Bronx, NY, USA). The antibodies used and their sources are as follows: polyclonal antibody (N20) directed against residues 2–21 of caveolin-1 (Santa Cruz Biotechnology); monoclonal antibody against caveolin-3 (clone 26) (Transduction Labs); rabbit anti-Goα polyclonal antiserum (ON1) raised against a synthetic peptide corresponding to amino acids 2–17 of the Goα subunit (kindly donated by G. Milligan, University of Glasgow, Scotland). The δ-opioid agonist [o-Pen2, o-Pen5]-enkephalin (DPDPE), guanosine 5′-O-(thiotriphosphate) (GTPγS), guanosine 5′-O-(thiodiphosphate) (GDPβS), theophylline, and prostaglandin E1 (PGE1) were purchased from Sigma Chemical Co., and pertussis toxin from List Biological Laboratories (Campbell, CA, USA). All other biochemicals used were of the highest purity available and obtained from regular commercial sources.
Cell culture and stable transfections
NG108–15 neuroblastoma × glioma hybrid cells were cultured in a 5 % CO2 humidified atmosphere at 37 °C in Dulbecco's modified Eagle's medium (DMEM), supplemented with 4500 mg l−1 glucose (Sigma), 10 % heat-inactivated fetal bovine serum (Sigma), 2 mml-glutamine, 100 μg ml−1 streptomycin, 100 units ml−1 penicillin, and hypoxanthine- aminopterin-thymidine (HAT). Cell monolayers in 60 mm dishes (about 70 % confluent) were transfected with 10 μg each of plasmid using the Lipofectamine reagent (Life Technologies), following the manufacturer's instructions. After 48 h, the cells were split 1:10 and maintained in medium containing 400 μg ml−1 hygromycin B (Roche), which was changed every 3–4 days. Hygromycin-resistant clones were isolated after 2 weeks and individually screened for caveolin-1 and −3 expression by Western immunoblotting.
To induce differentiation and development of Ca2+ channels (Kasai & Neher, 1992) NG108–15 cells (about 30 % confluent) were cultured in the presence of 10 μm PGE1 and 1 mm theophylline for at least 5 days prior to electrophysiological recordings.
Cell fractionation
Low-density, Triton-insoluble subcellular fractions were isolated from NG108–15 cells following the procedure described by Li et al. (1995). Briefly, cells were scraped into 2 ml of ice-cold Mes-buffered saline (MBS, 25 mm Mes, pH 6.5, 0.15 m NaCl) containing 1 % (v/v) Triton X-100. Homogenization was carried out at 4 °C with 10 strokes of a loose-fitting Dounce homogenizer. The homogenate was adjusted to 40 % sucrose by the addition of 2 ml of 80 % sucrose prepared in MBS and placed at the bottom of an ultracentrifuge tube. Two 4 ml layers of 30 and 5 % sucrose in MBS were overlaid atop the homogenate and the resulting gradient centrifuged at 190 000 g for 16–20 h at 4 °C in a SW41 rotor (Beckman Instruments). From the top of each gradient, 1 ml fractions were collected to yield a total of 12 fractions. A light-scattering band at the interface between the 5 % and 30 % sucrose regions (fractions 4 and 5) was observed that contained caveolin-1 and −3 but excluded most of other cellular proteins, as determined by total protein staining with Ponceau S. After precipitation with trichloroacetic acid, the protein concentrations of each fraction were quantified using the BCA kit (Pierce) and equal amounts of protein separated by SDS-PAGE.
Western immunoblotting
Cellular proteins were resolved on SDS-PAGE gel (12.5 % acrylamide) and transferred to nitrocellulose membranes. Blots were incubated overnight at 4 °C in TBST (10 mm Tris-HCl, pH 8.0, 150 mm NaCl, 0.2 % Tween 20) containing 5 % (w/v) dry skimmed milk. After washing with TBST, membranes were incubated at room temperature for 3 h with the primary antibody (diluted in TBST-milk) and for 2 h with horseradish peroxidase-conjugated goat anti-rabbit/mouse IgG (diluted in TBST-milk; Pierce). Proteins were detected by chemiluminescence using the SuperSignal detection kit (Pierce).
Immunofluorescence
Cells grown on poly-l-lysine-coated glass coverslips were washed twice with PBS-Ca2+-Mg2+, and fixed for 10 min at room temperature with 4 % (w/v) paraformaldehyde in 100 mm sodium phosphate buffer, pH 7.4. Fixed cells were rinsed with PBS- Ca2+- Mg2+, preincubated for 15 min in GDB buffer (20 mm sodium phosphate buffer, pH 7.4, containing 450 mm NaCl, 0.1 % gelatin), containing 0.3 % Triton X-100, and incubated with primary antibody in GDB buffer for 2 h at room temperature. After washing thoroughly with PBS-Ca2+-Mg2+, samples were incubated for 1.5 h with Texas Red-conjugated secondary antibody in GDB buffer, washed with PBS-Ca2+-Mg2+, and mounted on glass slides with 1 mg ml−1p-phenylenediamine anti-bleaching in PBS-Ca2+-Mg2+−70 % glycerol. Slides were observed under a Zeiss Axioplan fluorescence microscope.
Electrophysiology
In electrophysiological experiments the patch pipettes were filled with (mm): 120 CsCl, 20 tetraethylammonium chloride, 10 EGTA, 2 MgCl2, 4 Mg-ATP, 0.1 GTP, 10 Hepes-CsOH (pH 7.4). Seals between electrodes and cells were established in a solution consisting of (mm): 135 NaCl, 1.8 CaCl2, 2 MgCl2, 5.5 KCl, 10 glucose, 10 Hepes-NaOH (pH 7.4). After establishing the whole-cell configuration, cells were perfused with an external saline containing (mm): 130 NaCl, 10 BaCl2, 2 MgCl2, 10 glucose, 10 Hepes-NaOH (pH 7.4), 1 4-aminopyridine, 10 tetraethylammonium chloride, 10−3 tetrodotoxin (Sigma). During recording, extracellular Ca2+ was substituted with Ba2+ to minimize Ca2+-dependent inactivation of Ca2+ channel currents. Most in vitro differentiated NG108–15 cells expressed both low-voltage-activated (LVA) and high-voltage-activated (HVA), L-type (nifedipine-sensitive) and N-type (ω-conotoxin GVIA-sensitive) Ca2+ channels, as previously reported (Tsunoo et al. 1986; Kasai & Neher, 1992). Ten micromolar nifedipine (Bayer AG, Wuppertal, Germany) and −40 mV holding potential were employed in all experiments to eliminate contamination from LVA and L-type Ca2+ currents when present. External solutions were exchanged by a fast multi-barrelled delivery system positioned close to cells. Whole-cell patch clamp currents were recorded at room temperature (20–24 °C) with a List LM/EPC7 patch clamp amplifier (List Electronic, Darmstadt, Germany), and digitized at sampling intervals of 26–100 μs using a 12 bit A/D Tecmar LabMaster Board interfaced with an Intel 486-based computer. Stimulation, acquisition, and data analysis were carried out using pCLAMP software (Axon Instruments Inc., Burlingame, CA, USA) and Origin (Microcal Software, Inc., Northampton, MA, USA). Linear components of leak and capacitive currents were first reduced by analog circuitry and then almost completely cancelled with the P/N method. Patch pipettes were made from borosilicate glass tubing (Chr. Bardram, Birkerod, Denmark) and fire polished. Pipettes had a final resistance of 0.5–2.0 MΩ when filled with the internal solution. Currents were filtered at 3 kHz. The sizes of current inhibition by DPDPE or GTPγS, when not stated otherwise, were measured at the onset of the test pulse (about 20 ms after beginning) and following a cell exposure to agonists until reaching the steady state. All data in text and figures are given as means ±s.e.m. for n observations. Significance (P) was calculated using Student's paired t test. Curve fitting was performed by a non-linear regression method based on the Levenberg-Marquardt algorithm.
RESULTS
Constitutive expression of recombinant caveolin-1 and −3 in NG108–15 cells
To investigate the role of caveolins in the G protein-mediated signalling cascade, we generated neuroblastoma × glioma NG108–15 clones that stably express caveolin-1 and −3 after transfection. Among the various hygromycin-resistant clones, two were selected that expressed higher levels of caveolin-1 (hereafter termed cav1(+)), or −3 (cav3(+)), by Western immunoblotting (Fig. 1A). Untransfected NG108–15 cells, and one clone transfected with the empty pCB7 vector (cav(-)) were negative.
Figure 1. Expression of recombinant caveolin in NG108–15 cells.

A, expression of caveolin-1 and −3 in stably transfected NG108–15 clones. Antibiotic-resistant clones transfected with caveolin-1 (cav1(+)), caveolin-3 (cav3(+)), or the empty pCB7 vector (cav(-)), and untransfected NG108–15 cells (NG) were individually analysed by 12.5 % SDS-PAGE and Western immunoblotting. B, recombinant caveolin-1 and −3 are targeted to the plasma membrane in transfected NG108–15 cells. Undifferentiated cav1(+) and cav3(+) cells, and differentiated cav1(+) cells were stained with caveolin-1-, or −3-specific antibodies, and visualized by indirect immunofluorescence. C, recombinant caveolin-1 and −3 partition in detergent-insoluble low-buoyancy membrane fractions. Undifferentiated cav1(+) and cav3(+) cells, and differentiated cav1(+) cells, were extracted in 1 % Triton X-100 at 4 °C and subjected to ultracentrifugation on flotation sucrose density gradients, as reported (Li et al. 1995). Equal amounts of proteins from each fraction (approximately 5 μg) were separated by SDS-PAGE and analysed by Western blotting. A negative control with untransfected cells is also shown (contr). D and E, whole-cell content and membrane partitioning of endogenous Goα-subunits are not affected by recombinant caveolin-1 expression. The content of Goα was determined by Western immunoblotting of whole extracts (D) or gradient fractions (E) of cav(-) and cav1(+) cells.
To investigate the intracellular distribution of recombinant caveolins, fixed cav1(+) and cav3(+) cells were examined by indirect immunofluorescence after staining with the specific antibodies. As shown in Fig. 1B the fluorescent signal was mostly localized around the edges of undifferentiated cav1(+) and cav3(+) cells, and cav1(+) differentiated with PGE1 and theophylline, thus suggesting that heterologously expressed caveolin-1 and −3 were successfully delivered to the plasma membrane. In contrast, untransfected and cav(-) cells showed no fluorescence (not shown).
Caveolins are concentrated within distinct subcompartments of the plasma membrane, known as caveolae. Due to their high content of cholesterol and glycosphingolipids, caveolar membranes are resistant to extraction at 4 °C by non-ionic detergents, such as Triton X-100, and float to low density sucrose fractions on bottom-loaded gradients. Using a well-defined procedure (Li et al. 1995) that combines both of these physico-chemical properties to separate low-density, Triton-insoluble membranes containing caveolins from the bulk of cellular membranes and cytosolic proteins, we next analysed by Western blotting the content of caveolin-1 and −3 in sucrose density gradient fractions obtained from cav1(+) and cav3(+) clones.
As might be anticipated (Fig. 1C), caveolin-1 and −3 immunoreactivities were almost exclusively detected in the low buoyancy fractions (fractions 4 and 5, at the boundary between 5 and 30 % sucrose layers). Differentiation of cav1(+) cells did not affect the partitioning of caveolin-1 in the gradient fractions. However, some increase in the total content of caveolin-1 was noticed in differentiated cells (Fig. 1C).
Heterotrimeric G proteins are enriched in Triton-insoluble low buoyancy membrane domains (Li et al. 1995; Anderson, 1998). To check whether recombinant caveolins might affect the level of expression and/or the membrane partitioning of endogenous Go protein, we compared the Goα immunoreactivity in whole lysates and gradients obtained from cav(-) and cav1(+) cells. As reported in Fig. 1D, the total cellular content of the Goα-subunit was unaffected by caveolin-1 expression. Likewise, the Goα-subunit was enriched in the Triton-insoluble low density fractions obtained from either clones (Fig. 1E), thus suggesting that the induction of caveolin-1 expression does not significantly affect the membrane partitioning of heterotrimeric G proteins.
Upon inspection by transmission electron microscopy cav1(+) cells did not show any caveolae-like invaginations (data not shown).
Effect of the expression of recombinant caveolins on N-type Ca 2+ channel currents
To look for possible functional effect(s) of caveolins, ω-conotoxin GVIA-sensitive Ba2+ currents (N-type currents) were analysed in differentiated untransfected NG108–15 cells, and cav(-), cav1(+), and cav3(+) clones, using the whole-cell patch clamp technique. Sample tracings of superimposed Ba2+ currents elicited in control saline at different test potentials (−20/+20 mV) in control NG108–15 cells, and cav1(+) and cav3(+) clones are reported in Fig. 2A. Upon inspection of these representative tracings, no significant difference was evident in the time course of activation of the N-type Ba2+ currents between control cells (upper tracings) and caveolin-positive clones (cav1(+), middle; cav3(+), lower). Likewise, the time courses of current activation at each test potential could be fitted by single exponential functions (not shown). Mean values of the activation time constant at +10 mV were: 4.2 ± 0.41 ms (n = 19) in control NG108–15 cells; 4.1 ± 0.34 ms (n = 17) in cav1(+) clones; and 4.4 ± 0.28 ms (n = 21) in cav3(+) clones. Ba2+ current inactivation was similarly slow and incomplete in control and in caveolin-expressing clones (τ > 200 ms at +10 mV). The voltage dependence of steady-state N-type current activation was estimated from the ratio between the current measured at each test potential (voltage range: −30/+30 mV) and the corresponding driving force. The resulting normalized conductance did not differ significantly between control cells and caveolin-positive clones, as illustrated in Fig. 2B. Likewise, no major differences among the different clones were observed in the voltage dependence of inactivation, tested between −100 and −40 mV (Fig. 2C). Overall, these results suggest that, in control saline, the activation and inactivation gating properties of the N-type Ca2+ channels were not significantly affected by the expression of recombinant caveolin-1 and −3.
Figure 2. N-type Ca2+ channel currents in untransfected and in recombinant caveolin-1- and −3-expressing NG108–15 cells.

A, representative Ba2+ current profiles obtained from a normal NG108–15 cell (upper tracings), a cav1(+) cell (middle tracings), and a cav3(+) cell (lower tracings). Steps of 370 ms duration were applied to increasing test potentials (−20 to +20 mV) from a holding potential of −40 mV. Cells were bathed in control saline. B, voltage dependence of N-type Ca2+ channel conductance (normalized) for untransfected NG108–15 cells (filled circles, n = 15), and cav1(+) (filled triangles, n = 19) and cav3(+) clones (open triangles, n = 11). The conductance of the N-type current was estimated according to the relation g =IBa/(V − VBa), where IBa refers to peak current values and VBa is the extrapolated reversal potential (+60 mV). The continuous line through data points is the least-squares best fit of the Boltzmann equation: gnorm = 1/{1 + exp((V+V1/2)/k)} where V1/2 and k values for the three different clones (NG, cav1(+) and cav3(+)) were 3.7, 2.3 and 4.1 mV, and −5.2, −5.5 and −5.9 mV, respectively. C, average Ba2+ current inactivation (h(3s)) vs. membrane potential for untransfected NG108–15 cells (filled circles, n = 3), and cav1(+) (filled triangles, n = 4) and cav3(+) clones (open triangles, n = 2). Currents were elicited to +10 mV after a 3 s prepulse to the potentials indicated (−100 to −40 mV). The continuous lines through data points are the least-squares best fits of the Boltzmann equation: h = 1/{1 +exp((V+V1/2)/k)} where V1/2 and k values for the three different clones (NG, cav1(+) and cav3(+)) were 13.5, 13.8 and 12.3 mV and 29.2, 33.6 and 30.3 mV, respectively.
Recombinant caveolins attenuate the G protein-coupled receptor-mediated inhibition of N-type Ca2+ channel activity
The most common signal transduction pathway for receptor-mediated down-modulation of N-type Ca2+ channel activity involves the activation of a pertussis toxin (PTX)-sensitive G protein, presumably Go, to produce a voltage-dependent inhibition (for review see Dolphin, 1995). Caveolins contain a core domain that is sufficient for binding to certain G protein α-subunits in vitro (Li et al. 1995). To determine whether caveolins can influence the G-protein-dependent modulation of N-type Ca2+ channels, we compared the receptor-mediated inhibition of N-type Ba2+ currents in caveolin-expressing and control NG108–15 cells.
The representative tracings shown in Fig. 3A–C indicate that the selective δ-opioid receptor agonist DPDPE (100 nm) reversibly inhibited a fraction of the N-type Ba2+ current both in untransfected NG108–15 cells and in cav1(+) or cav3(+) clones. However, in spite of such qualitative similarities, current tracings in Fig. 3B and C show that the percentage of DPDPE-induced inhibition was lower in cav1(+) and cav3(+) cells (about 31 %) than in control cells (69 %, Fig. 3A), with a net reduction of agonist efficacy of about 55 %. The mean percentages of current inhibition at +10 mV are summarized in the bar graphs of Fig. 3D. These results demonstrate that caveolin-1 and −3 are equally effective in significantly attenuating (t test, P < 0.0001) the opioid receptor-mediated inhibition of N-type Ca2+ channels. The mean normalized current-voltage relationships obtained in control saline and during DPDPE application with untransfected NG108–15, cav1(+) and cav3(+) cells are shown in Fig. 3E–G.
Figure 3. DPDPE-induced inhibition of N-type Ba2+ current.
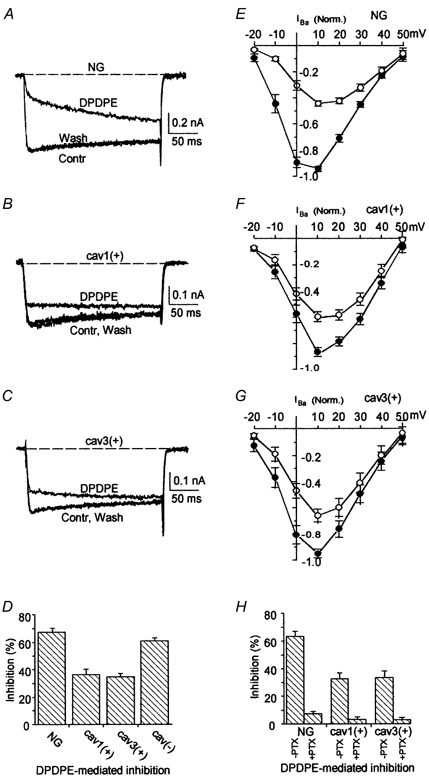
A–C, superimposed current traces were elicited by a voltage step from −40 to +10 mV from an untransfected NG108–15 cell (A), a cav1(+) (B), and a cav3(+) cell (C) during focal perfusion with control saline (Contr), 100 nm DPDPE (DPDPE), and following washout with control saline (Wash). D, mean percentages of DPDPE-induced Ba2+ current inhibition in NG108–15 (n = 37), cav1(+) (n = 26), cav3(+) (n = 47), and cav(-) (n = 29) cells. E–G, normalized mean current- voltage relationship of Ba2+ currents before (filled symbols) and during application of 100 nm DPDPE (open symbols) from normal NG108–15 cells (n = 16) (E); cav1(+) cells (n = 19) (F) and cav3(+) cells (n = 8) (G). H, mean percentages of DPDPE-induced Ba2+ current inhibition in control NG108–15, cav1(+), and cav3(+) cells, including those unresponsive to DPDPE, and in cells pre-incubated for 24 h with 50 ng ml−1 PTX (+PTX) or not pre-incubated (-PTX).
To determine any dependence on the holding potential the degree of current inhibition and the attenuation of inhibition were measured in caveolin-expressing cells starting at potentials more negative than −40 mV. For these experiments cells lacking the fast inactivating (T-type-like) current component were employed (∼15− 20 % of tested cells). Indeed the fraction of inhibited current measured at +10 mV was similar at the different holding potentials: 0.60 (−100 mV), 0.58 (−80 mV), 0.62 (−60 mV) and 0.61 (−40 mV) in untransfected NG108–15 cells (n = 4) and 0.37 (−100 mV), 0.33 (−80 mV), 0.34 (−60 mV), and 0.37 (−40 mV) in cav1(+) cells (n = 4).
To verify whether caveolin-1 and −3 were disrupting N-type current inhibition by the PTX-sensitive, membrane-delimited pathway, cells were pre-incubated for 24 h with PTX (50 ng ml−1) before testing. Under these conditions the DPDPE-induced inhibition of Ba2+ current was negligible in all cell types, as summarized in Fig. 3H, thus confirming that the inhibitory effect was dependent upon the integrity of a PTX-sensitive G protein both in untransfected and in caveolin-expressing clones. This conclusion was supported by the observation that, both in untransfected and in cav1(+) cells (n = 6), DPDPE-induced inhibition was negligible following internal dialysis with GDPβS (1 mm), an inhibitor of G protein activation.
N-type Ca2+ channel current facilitation occurs both in control and in caveolin-expressing NG108–15 cells
A common feature of N-type Ca2+ channel current inhibition is a time- and voltage-dependent recruitment of channels from inhibition at depolarizing potentials, termed facilitation (Bean, 1989; Grassi & Lux, 1989; Elmslie et al. 1990; Pollo et al. 1992; Kasai, 1992; Golard & Siegelbaum, 1993; Toselli et al. 1999). The strong voltage dependence of N-type current facilitation in both untransfected NG108–15, and in caveolin-expressing cells, during DPDPE application, was confirmed by applying the prepulse protocol shown in Fig. 4D. Sample tracings of superimposed Ba2+ currents are shown in Fig. 4A–C for a control NG108–15, a cav1(+), and a cav3(+) cell, respectively. In all cells the conditioning pulse to +80 mV caused a current recovery from DPDPE-induced inhibition greater than 90 % and the percentage current facilitation approximated the percentage current inhibition measured in the same cells, as summarized by bar graphs of Fig. 4E. By contrast, facilitation was negligible in control saline for all cell types. These results indicate that, like in untransfected NG108–15 cells, also in caveolin-expressing cells the inhibition of the N-type current by DPDPE can be quickly and almost completely overcome by strong depolarizations.
Figure 4. N-type Ca2+ channel current facilitation in control NG108–15 cells and in caveolin-expressing cells.

A–C, superimposed current traces were elicited by applying the protocol shown in D to cells (NG108–15, A; cav1(+), B; cav3(+), C) either bathed with control saline (Contr) or perfused with DPDPE (DPDPE), either starting directly from the holding potential of −40 mV (-PS) or following a conditioning pulse to +80 mV (+PS). E, mean percentage of DPDPE-dependent inhibition (open columns, labelled DPDPE) and of current facilitation (hatched columns) in the presence of agonist (DPDPE+PS) and in control saline (CONTR+PS), in control cells (NG, n = 16), in cav1(+) cells (n = 15), and in cav3(+) cells (n = 11). This definition of facilitation differs from the measure used in other studies of Ca2+ channel modulation: the extent of facilitation of the agonist-modified current was evaluated by subtracting the amplitude of the Ba2+ current elicited at +10 mV without pre-pulse from that following the pre-pulse (both of them obtained during application of DPDPE), and by dividing that difference by the amplitude of the current elicited at +10 mV following the prepulse in control saline. The extent of facilitation in control saline was evaluated by subtracting the amplitude of the Ba2+ current elicited at +10 mV without pre-pulse from that following the pre-pulse, and by dividing that difference by the amplitude of the current following the pre-pulse.
The time course of reinhibition is slower in the presence of recombinant caveolins
At present, there is good evidence that the rapid, membrane-delimited and voltage-dependent inhibition of N-type Ca2+ channels is mediated by a G protein βγ dimer (Ikeda, 1996; Herlitze et al. 1996; Stephens et al. 1998a; Delmas et al. 1998) that directly binds to the Ca2+ channel α1 subunit (Zhang et al. 1996; De Waard et al. 1997; Zamponi & Snutch, 1998; Stephens et al. 1998b; Simen & Miller, 1998). It is also assumed that following repolarization, reinhibition occurs, presumably upon Gβγ subunit reassociation to the channel. Thus, any mechanism causing changes in the concentration of free Gβγ could affect the time constant of the decay of prepulse facilitation (reinhibition), following membrane repolarization. Therefore, we tested the effect of caveolin expression on the decay of prepulse facilitation. The time constant of reinhibition can be measured by applying the protocol shown in Fig. 5A. As shown in the current records of Fig. 5B and C, obtained during DPDPE application (100 nm), a gradual current reinhibition occurred by increasing the duration of the repolarizing interpulse to −40 mV following the pre-pulse to +80 mV. The onset of reinhibition at −40 mV could be approximated by a single exponential (Fig. 5D), and the mean time constants of reinhibition were significantly different (106.9 ± 5.4 ms in cav1(+) cells; 64.6 ± 4.4 ms in untransfected NG108–15 cells; t test, P < 0.0001). These data support the hypothesis that caveolin expression could cause a decrease in free Gβγ concentration, but do not rule out the alternative possibility that caveolins could act directly on the Ca2+ channel, causing a decrease of channel affinity for Gβγ.
Figure 5. Decay of prepulse facilitation during repolarization in NG108–15 cells and in caveolin-1-expressing cells.

A, protocol used to elicit currents shown in B and C. B and C, superimposed Ba2+ currents elicited by applying the protocol shown in A during application of 100 nm DPDPE in a control NG108–15 cell (B) and in a cav1(+) cell (C). D, percentage of current facilitation as a function of the duration of the repolarizing pulse for control NG108–15 cells (filled circles, n = 6) and for cav1(+)-expressing cells (open circles, n = 8). The fraction of reinhibited current for each repolarization interval was estimated by dividing the DPDPE-modified currents obtained at +10 mV following repolarization to −40 mV by that obtained following directly the prepulse to +80 mV without repolarization; current amplitudes were measured about 20 ms after the onset of the second test pulse. The continuous lines in D are the best fits of data points to single exponential functions.
At difference with the decay of facilitation, neither the voltage dependence of facilitation (Fig. 6A–D), nor its time dependence (Fig. 6E–H) were altered by caveolin expression. Since these measurements mainly reflect the voltage- and time-dependent dissociation of Gβγ from Ca2+ channel, these results render less likely the hypothesis that caveolin expression could cause a decrease of channel affinity for Gβγ.
Figure 6. Voltage and time dependence of current deinhibition in NG108–15 cells and in caveolin-1-expressing cells.

A, protocol used to elicit currents shown in B and C. B and C, superimposed Ba2+ currents during cell perfusion with 100 nm DPDPE in a control NG108–15 cell (B), and in a cav1(+) cell (C). D, voltage dependence of current deinhibition as a function of prepulse amplitude for control NG108–15 cells (filled circles, n = 8) and for cav1(+) cells (open circles, n = 7). The continuous lines are the fit of data points to the equation: 62 + 38/(1 + exp((V−V1/2)/k)} for caveolin-1-expressing cells (V1/2 = 14.1 mV; k =−8.3 mV) and to the equation: 36 + 64/(1 + exp((V−V1/2)/k)} for NG108–15 cells (V1/2 = 13.6 mV; k =−7.1 mV). E, protocol used to elicit currents shown in F and G. F and G, superimposed Ba2+ currents elicited by applying the protocol shown in E during cell perfusion with 100 nm DPDPE in a cav1(+) cell (F) and in a control NG108–15 cell (G). H, time course of current deinhibition as a function of prepulse duration for control NG108–15 cells (filled circles, n = 4) and for cav1(+) cells (open circles, n = 4). The continuous lines are the fit of data points to the equation: 99 − 42exp(−t/8.8) for cav1(+) cells, and to the equation: 99 − 66exp(−t/8.1) for NG108–15 cells.
Recombinant caveolins attenuate the GTPγS -mediated inhibition of N-type Ca 2+ channel activity
A caveolin-dependent decrease in free Gβγ concentration, suggested by the latter results, could be achieved in different ways. We could hypothesize that caveolin-1 and −3 act at the opioid receptor level to reduce the efficiency of coupling to G protein. Alternatively, these proteins may function as a negative regulator of G proteins by binding and stabilizing the inactive GDP-liganded form of Gα, as indicated by previous reports (Li et al. 1995, 1996). In both cases, a reduced concentration of activated G protein, and hence of free Gβγ, could be predicted, thus leading to a reduced inhibition of N-type channels.
The strategy we applied to distinguish between these different possibilities was to study Ca2+ channel modulation, by acting downstream of the receptor, through the direct activation of G proteins by GTPγS. Following internal cell dialysis with GTPγS, Ba2+ current depression and slow down of current activation occurred. Maximal effects were obtained about 10 min after the beginning of internal perfusion, since the diffusion rate of GTPγS through the patch pipette was relatively slow. The ability of GTPγS to closely mimic DPDPE-mediated Ba2+ current inhibition was examined quantitatively by applying the double pulse protocol shown in Fig. 7A. Immediately after the whole-cell configuration was achieved, with GTPγS (100 μm) in the patch pipette, the Ba2+ current amplitude was little, if at all, affected by the conditioning pulse (traces labelled -PS and +PS in Fig. 7B, D and F). Noticeably, at this stage DPDPE had a strong inhibitory effect (> 60 % in control NG108–15 cells) on the N-type current (traces labelled DPDPE in Fig. 7B, D and F). By contrast, after approximately 10 min of cell dialysis with GTPγS the control Ba2+ current became strongly depressed, displayed an activation slow down (traces labelled -PS in Fig. 7C, E and G) and was greatly relieved by the conditioning pulse (traces labelled +PS in Fig. 7C, E and G). Interestingly, following prolonged dialysis with GTPγS, DPDPE produced no, or little, additional current inhibition (traces labelled DPDPE in Fig. 7C, E and G). The percentage inhibition by DPDPE was used as a tool to estimate when GTPγS reached its maximum inhibitory effect. Mean facilitation at the beginning of and after prolonged dialysis with GTPγS is shown in the bar graph of Fig. 7H for control NG108–15, cav1(+), and cav3(+) cells, respectively. In all three cell types facilitation was negligible at the beginning of cell dialysis and raised up to 51, 26 and 29 % in control NG108–15, cav1(+) and cav3(+) cells, respectively, when the depressive action of GTPγS reached its peak effect. The latter values paralleled the percentage DPDPE-induced Ba2+ current inhibition measured in the three cell types at the beginning of the intracellular perfusion with GTPγS (59, 32 and 29 %; see bar graphs of Fig. 7I). This result indicates that the extent of current depression obtained by GTPγS and by δ-opioid receptor activation are similar. This is in line with the assumption that caveolins interact with a fraction of G proteins in their inactive, GDP-bound form, making it unable to be activated by GTPγS, as data from in vitro experiments suggest (Li et al. 1995). This also indicates that the reduced inhibition of Ba2+ currents in the caveolin-expressing clones is probably achieved at G protein, rather than at receptor, level.
Figure 7. N-type Ca2+ channel current inhibition and facilitation during intracellular dialysis with GTPγS in NG108–15 cells and in caveolin-1- and −3-expressing cells.
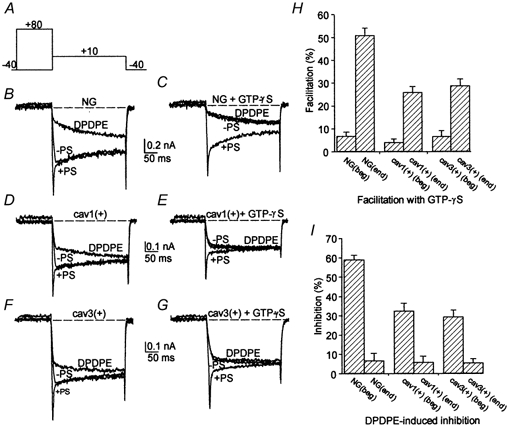
A, protocol used for the study of facilitation. B and C, superimposed current traces were obtained on step depolarization to +10 mV from a NG108–15 cell bathed in control saline, at the beginning of cell dialysis with GTPγS (B), and after about 10 min of dialysis with GTPγS (C), either starting directly from the holding potential of −40 mV (-PS) or following a conditioning pulse to +80 mV (+PS). The current traces elicited by step depolarization from −40 to +10 mV during application of DPDPE are also shown (traces labelled DPDPE). D and E, superimposed current traces were elicited in a cav1(+) cell by applying the same protocol shown in A, at the beginning of cell dialysis with GTPγS (D), and after about 10 min of dialysis with GTPγS (E). F and G, superimposed current traces were elicited in a cav3(+) cell by applying the same protocol shown in A, at the beginning of cell dialysis with GTPγS (F), and after about 10 min of dialysis with GTPγS (G). H, mean percentage of current facilitation (defined in Fig. 4) in untransfected NG108–15 cells (NG, n = 23) and in cav1(+) (n = 21), or cav3(+) (n = 19) cells, at the beginning of cell dialysis with GTPγS (beg), and after prolonged dialysis with GTPγS (end). I, mean percentage of DPDPE-induced Ba2+ current inhibition in untransfected NG108–15 cells, and in cav1(+) or cav3(+) cells (same as in H), at the beginning and after prolonged cell dialysis with GTPγS.
DISCUSSION
Our objective here was to determine whether caveolin proteins influence G protein-mediated inhibition of voltage-gated, N-type Ca2+ channel activity. To achieve this goal we induced the constitutive expression of caveolin-1 and −3 genes in the neuroblastoma × glioma NG108–15 hybrid cell line, which lacks any known caveolin isoform and is devoid of caveolae-like structures (Gorodinsky & Harris, 1995). The choice of caveolin-1 was motivated by the recent findings that this isoform is expressed in PC12 cells differentiated by nerve growth factor and in DRG neurons (Galbiati et al. 1998). In addition, to test whether caveolin-1-induced effects were isoform-specific, caveolin-3, normally expressed only in muscle tissue (Way & Parton, 1995; Tang et al. 1996), was employed.
Our results show that recombinant caveolin-1 and −3 mainly localized at the plasma membrane of transfected cells. Moreover, upon subcellular fractionation of cold Triton extracts on bottom-loaded, sucrose density gradients both caveolins were concentrated in the low buoyancy fractions, thus suggesting an association to glycolipid-rich domains, which is typical of endogenous caveolins in many cell types (Anderson, 1998).
In vitro differentiated NG108–15 cells express functional ω-conotoxin GVIA-sensitive, N-type Ca2+ channels, negatively modulated by Go protein-coupled, δ-type opioid receptors in a voltage-dependent manner (Hescheler et al. 1987; Kasai, 1992; Toselli et al. 1999).
Herein we show that when cells expressing recombinant caveolin-1 or −3 were bathed in control saline the kinetics of activation/inactivation, and the voltage dependence of N-type Ba2+ currents were not significantly altered with respect to control NG108–15 cells. Thus, these results exclude that the expression of either caveolin subtypes may have induced significant changes in the basal gating properties of the N-type Ca2+ channels. By contrast, we show that in cav1(+) and cav3(+) clones, the selective δ-opioid agonist DPDPE was less effective in lowering the N-type current than in caveolin-negative cells, thus suggesting that caveolins may interfere at some step along the G protein-dependent signal transduction cascade leading to N-type Ca2+ channel inhibition. The two caveolin isoforms were equally effective in attenuating N-type current inhibition, thus suggesting that the sequence differences between these two isoforms are not relevant to differentially affect Ca2+ channel modulation in NG108–15 cells. Caveolin-1 and −3 are about 65 % identical, and about 85 % similar based on conservative amino acid substitutions (Tang et al. 1996).
Internal cell dialysis with GDPβS, and preincubation of cells with PTX completely abolished the DPDPE-induced inhibition both in control NG108–15 and in caveolin-expressing cells, providing evidence that stable expression of caveolins was producing a specific G protein-mediated effect, and implying that a common PTX-sensitive G protein (presumably Go) was involved in the modulatory pathway leading to current inhibition both in control and in caveolin-expressing cells.
Our current understanding of the membrane-delimited inhibition of N-type Ca2+ currents involves the direct binding to the channel of the Gβγ subunits (Ikeda, 1996; Herlitze et al. 1996; Stephens et al. 1998a; Delmas et al. 1998). It is also assumed that following strong depolarization deinhibition occurs, while following repolarization, reinhibition occurs, presumably upon Gβγ subunit unbinding and rebinding to the channel respectively. Thus, any mechanism causing changes either in Ca2+ channel affinity for Gβγ, or in the concentration of free Gβγ, could affect the time courses of deinhibition or reinhibition. Our findings indicate that the voltage dependence and the time course of channel deinhibition were not significantly altered by the expression of recombinant caveolins (see Fig. 6). These results make less likely the hypothesis that caveolin expression could cause a decrease of Ca2+ channel affinity for Gβγ.
In contrast to deinhibition kinetics, the time course of reinhibition is slower in the caveolin-expressing clones (see Fig. 5), supporting the hypothesis that caveolin expression could cause a decrease of free Gβγ concentration following δ-opioid receptor activation.
A caveolin-dependent reduction in the concentration of activated G proteins could be achieved in different ways: (1) stable expression of caveolins may down-regulate G protein expression; (2) caveolins may cause a reduction of the δ-opioid receptor activity and consequently of the activated G protein levels; or (3) caveolins may selectively interact with G proteins and modulate their activation/inactivation states. The results in Fig. 1D show that the total levels of Goα-subunit immunoreactivity do not appear to differ in the caveolin-expressing clones compared with untransfected NG108–15 cells, thus excluding the first possibility. To test the other two hypotheses we employed the GTP analogue GTPγS as a tool to affect the channel activity downstream of opioid receptors. As during DPDPE application, the direct activation of endogenous G proteins with GTPγS depressed Ba2+ current significantly less in the caveolin-expressing cells. This would be in line with the assumption that caveolins, by binding to inactive G proteins, make it impossible for this fraction to be activated by GTPγS. In addition, we may hypothesize that the effect of caveolins-1 and −3 may occur at G protein, rather than at receptor level, since the extent of caveolin-induced attenuation of Ba2+ current inhibition was similar following activation of receptor or G protein.
Previous data have shown that caveolins directly interact with the inactive GDP-bound form of G protein α-subunits and negatively regulate their functions in vitro. G protein-binding activity was mapped to a 20 amino acid stretch of the N-terminal cytoplasmic domain, highly conserved in all known caveolin-1, −2 and −3 isoforms, and named the ‘caveolin-scaffolding domain’ (Li et al. 1995; Tang et al. 1996). When tested in vitro on purified Go and Gi2α-subunits, the corresponding caveolin-1-derived peptide (amino acid residues 53–81) caused an inhibition of GDP/GTP exchange (GDI-like activity) (Li et al. 1995), whereas caveolin-3-derived peptide (amino acid residues 55–74) exhibited a dual activity: as an activator of GTPase enzyme activity intrinsic to Gα-subunits (GAP-like activity), at nanomolar concentrations, or as a GDI-like effector at micromolar concentrations (Tang et al. 1996). Because we observed a caveolin-mediated attenuation of Ca2+ channel modulation during intracellular perfusion with non-hydrolysable GTPγS, a GAP-like activity of caveolins seems to be unlikely in our system.
Another class of regulators of G protein signalling, RGS proteins, seem to have similar effects on N-type Ca2+ channel down-modulation (Melliti et al. 1999). However, in this case, a GAP-like activity of RGS proteins has been postulated. Because of the critical role played by voltage-gated Ca2+channels in the regulation of neuronal excitability, it is not surprising to hypothesize that their activity may be tightly and dynamically regulated at multiple levels.
Despite the apparent lack of caveolae, we report here that recombinant caveolin-1 and −3 are partitioned within Triton-insoluble low buoyancy membrane domains (Fig. 1C), where Gαo is also found (Fig. 1D–E). We may speculate that the interaction between G proteins and N-type Ca2+ channels occurs within such domains. Interestingly, the targeting of voltage-dependent potassium channels (Kv2.1) to glycolipid rafts of rat brain was recently reported (Martens et al. 2000). Ionic channel compartmentalization within specific membrane domains could be an additional important determinant for control of electrical excitability in neurons.
Acknowledgments
The authors gratefully acknowledge T. Costa for helpful discussion. This work was supported by grants from the CNR (Target Project on Biotechnology) to M.P., from MURST (Cofin 1997 and 1998) to M.P., M.T. and A.P., and from INFM to M.T.
References
- Anderson RGW. The caveolae membrane system. Annual Review of Biochemistry. 1998;67:199–225. doi: 10.1146/annurev.biochem.67.1.199. [DOI] [PubMed] [Google Scholar]
- Bean BP. Neurotransmitter inhibition of neuronal calcium currents by changes in channel voltage dependence. Nature. 1989;340:153–156. doi: 10.1038/340153a0. [DOI] [PubMed] [Google Scholar]
- Brody DL, Patil PG, Mulle JG, Snutch TP, Yue DT. Bursts of action potential waveforms relieve G-protein inhibition of recombinant P/Q-type Ca2+ channels in HEK 293 cells. Journal of Physiology. 1997;499:637–644. doi: 10.1113/jphysiol.1997.sp021956. [DOI] [PMC free article] [PubMed] [Google Scholar]
- Delmas P, Brown DA, Dayrell M, Abogadie FC, Caulfield MP, Buckley NJ. On the role of endogenous G-protein βγ subunits in N-type Ca2+ current inhibition by neurotransmitters in rat sympathetic neurons. Journal of Physiology. 1998;506:319–329. doi: 10.1111/j.1469-7793.1998.319bw.x. [DOI] [PMC free article] [PubMed] [Google Scholar]
- De Waard M, Liu H, Walker D, Scott VE, Gurnett CA, Campbell KP. Direct binding of G-protein βγ complex to voltage-dependent calcium channels. Nature. 1997;385:446–450. doi: 10.1038/385446a0. [DOI] [PubMed] [Google Scholar]
- Diversé-Pierluissi M, Goldsmith PK, Dunlap K. Transmitter-mediated inhibition of N-type calcium channels in sensory neurons involves multiple GTP-binding proteins and subunits. Neuron. 1995;14:191–200. doi: 10.1016/0896-6273(95)90254-6. [DOI] [PubMed] [Google Scholar]
- Dolphin AC. Voltage-dependent calcium channels and their modulation by neurotransmitters and G proteins. Experimental Physiology. 1995;80:1–36. doi: 10.1113/expphysiol.1995.sp003825. [DOI] [PubMed] [Google Scholar]
- Elmslie KS, Jones SW. Concentration dependence of neurotransmitter effects on calcium current kinetics in frog sympathetic neurones. Journal of Physiology. 1994;481:35–46. doi: 10.1113/jphysiol.1994.sp020417. [DOI] [PMC free article] [PubMed] [Google Scholar]
- Elmslie KS, Zhou W, Jones SW. LHRH and GTP-γ-S modify calcium current activation in bullfrog sympathetic neurons. Neuron. 1990;5:75–80. doi: 10.1016/0896-6273(90)90035-e. [DOI] [PubMed] [Google Scholar]
- Galbiati F, Volonté D, Gil O, Zanazzi G, Salzer JL, Sargiacomo M, Scherer PE, Engelman JA, Schlegel A, Parenti M, Okamoto T, Lisanti MP. Expression of caveolin-1 and -2 in differentiating PC12 cells and dorsal root ganglion neurons: caveolin-2 is up-regulated in response to cell injury. Proceedings of the National Academy of Sciences of the USA. 1998;95:10257–10262. doi: 10.1073/pnas.95.17.10257. [DOI] [PMC free article] [PubMed] [Google Scholar]
- Golard A, Siegelbaum SA. Kinetic basis for the voltage-dependent inhibition of N-type calcium current by somatostatin and norepinephrine in chick sympathetic neurons. Journal of Neuroscience. 1993;13:3884–3894. doi: 10.1523/JNEUROSCI.13-09-03884.1993. [DOI] [PMC free article] [PubMed] [Google Scholar]
- Gorodinsky A, Harris DA. Glycolipid-anchored proteins in neuroblastoma cells form detergent-resistant complexes without caveolin. Journal of Cell Biology. 1995;129:619–627. doi: 10.1083/jcb.129.3.619. [DOI] [PMC free article] [PubMed] [Google Scholar]
- Grassi F, Lux HD. Voltage-dependent GABA-induced modulation of calcium currents in chick sensory neurons. Neuroscience Letters. 1989;105:113–119. doi: 10.1016/0304-3940(89)90021-9. [DOI] [PubMed] [Google Scholar]
- Harder T, Simons K. Caveolae, DIGs, and the dynamics of sphingolipid-cholesterol microdomains. Current Opinion in Cell Biology. 1997;9:534–542. doi: 10.1016/s0955-0674(97)80030-0. [DOI] [PubMed] [Google Scholar]
- Herlitze S, Garcia DE, Mackie K, Hille B, Scheuer T, Catterall WA. Modulation of Ca2+ channels by G-protein βγ subunits. Nature. 1996;380:258–262. doi: 10.1038/380258a0. [DOI] [PubMed] [Google Scholar]
- Hescheler J, Rosenthal W, Trautwein W, Schultz G. The GTP-binding protein, Go, regulates neuronal calcium channels. Nature. 1987;325:445–447. doi: 10.1038/325445a0. [DOI] [PubMed] [Google Scholar]
- Ikeda SR. Voltage-dependent modulation of N-type calcium channels by G-protein βγ subunits. Nature. 1996;380:255–258. doi: 10.1038/380255a0. [DOI] [PubMed] [Google Scholar]
- Kasai H. Voltage- and time-dependent inhibition of neuronal calcium channels by a GTP-binding protein in a mammalian cell line. Journal of Physiology. 1992;448:189–209. doi: 10.1113/jphysiol.1992.sp019036. [DOI] [PMC free article] [PubMed] [Google Scholar]
- Kasai H, Neher E. Dihydropyridine-sensitive and ω-conotoxin-sensitive calcium channels in a mammalian neuroblastoma-glioma cell line. Journal of Physiology. 1992;448:161–188. doi: 10.1113/jphysiol.1992.sp019035. [DOI] [PMC free article] [PubMed] [Google Scholar]
- Koh DS, Hille B. Modulation by neurotransmitters of catecholamine secretion from sympathetic ganglion neurons detected by amperometry. Proceedings of the National Academy of Sciences of the USA. 1997;94:1506–1511. doi: 10.1073/pnas.94.4.1506. [DOI] [PMC free article] [PubMed] [Google Scholar]
- Li S, Couet J, Lisanti MP. Src tyrosine kinases, Gα subunits, and H-Ras share a common membrane-anchored scaffolding protein, caveolin. Journal of Biological Chemistry. 1996;271:29182–29190. doi: 10.1074/jbc.271.46.29182. [DOI] [PMC free article] [PubMed] [Google Scholar]
- Li S, Okamoto T, Chun M, Sargiacomo M, Casanova JE, Hansen SH, Nishimoto I, Lisanti MP. Evidence for a regulated interaction between heterotrimeric G proteins and caveolin. Journal of Biological Chemistry. 1995;270:15693–15701. doi: 10.1074/jbc.270.26.15693. [DOI] [PubMed] [Google Scholar]
- Martens JR, Navarro-Polanco R, Coppock EA, Nishiyama A, Parshley L, Grobaski TD, Tamkun MM. Differential targeting of shaker-like potassium channels to lipid rafts. Journal of Biological Chemistry. 2000;275:7443–7446. doi: 10.1074/jbc.275.11.7443. [DOI] [PubMed] [Google Scholar]
- Melliti K, Meza U, Fisher R, Adams B. Regulators of G protein signaling attenuate the G protein-mediated inhibition of N-type Ca channels. Journal of General Physiology. 1999;113:97–110. doi: 10.1085/jgp.113.1.97. [DOI] [PMC free article] [PubMed] [Google Scholar]
- Neubig RR. Membrane organization in G-protein mechanisms. FASEB Journal. 1994;8:939–946. doi: 10.1096/fasebj.8.12.8088459. [DOI] [PubMed] [Google Scholar]
- Okamoto T, Schlegel A, Scherer PE, Lisanti MP. Caveolins, a family of scaffolding proteins for organizing ‘preassembled signaling complexes’ at the plasma membrane. Journal of Biological Chemistry. 1998;273:5419–5422. doi: 10.1074/jbc.273.10.5419. [DOI] [PubMed] [Google Scholar]
- Park D, Dunlap K. Dynamic regulation of calcium influx by G-proteins, action potential waveform, and neuronal firing frequency. Journal of Neuroscience. 1998;18:6757–6766. doi: 10.1523/JNEUROSCI.18-17-06757.1998. [DOI] [PMC free article] [PubMed] [Google Scholar]
- Pollo A, Lovallo M, Sher E, Carbone E. Voltage-dependent noradrenergic modulation of ω-conotoxin-sensitive Ca2+ channels in human neuroblastoma IMR32 cells. Pflügers Archiv. 1992;422:75–83. doi: 10.1007/BF00381516. [DOI] [PubMed] [Google Scholar]
- Shaul PW, Anderson RGW. Role of plasmalemmal caveolae in signal transduction. American Journal of Physiology. 1998;275:L843–851. doi: 10.1152/ajplung.1998.275.5.L843. [DOI] [PubMed] [Google Scholar]
- Simen AA, Miller RJ. Structural features determining differential receptor regulation of neuronal Ca channels. Journal of Neuroscience. 1998;18:3689–3698. doi: 10.1523/JNEUROSCI.18-10-03689.1998. [DOI] [PMC free article] [PubMed] [Google Scholar]
- Stephens GJ, Brice NL, Berrow NS, Dolphin AC. Facilitation of rabbit α1B calcium channels: involvement of endogenous Gβγ subunits. Journal of Physiology. 1998a;509:15–27. doi: 10.1111/j.1469-7793.1998.015bo.x. [DOI] [PMC free article] [PubMed] [Google Scholar]
- Stephens GJ, Canti C, Page KM, Dolphin AC. Role of domain I of neuronal Ca2+ channel α1 subunits in G protein modulation. Journal of Physiology. 1998b;509:163–169. doi: 10.1111/j.1469-7793.1998.163bo.x. [DOI] [PMC free article] [PubMed] [Google Scholar]
- Streit J, Lux HD. Voltage dependent calcium currents in PC12 growth cones and cells during NGF-induced cell growth. Pflügers Archiv. 1987;408:634–641. doi: 10.1007/BF00581167. [DOI] [PubMed] [Google Scholar]
- Tang ZL, Scherer PE, Okamoto T, Song K, Caryn C, Kohtz DS, Nishimoto I, Lodish HF, Lisanti MP. Molecular cloning of caveolin-3, a novel member of the caveolin gene family expressed predominantly in muscle. Journal of Biological Chemistry. 1996;271:2255–2261. doi: 10.1074/jbc.271.4.2255. [DOI] [PubMed] [Google Scholar]
- Toselli M, Taglietti V. Muscarine inhibits high-threshold calcium currents with two distinct modes in rat embryonic hippocampal neurons. Journal of Physiology. 1995;483:347–365. doi: 10.1113/jphysiol.1995.sp020590. [DOI] [PMC free article] [PubMed] [Google Scholar]
- Toselli M, Tosetti P, Taglietti V. A kinetic study of N-type calcium current modulation by δ-opioid receptor activation in the mammalian cell line NG108-15. Biophysical Journal. 1999;76:2560–2574. doi: 10.1016/S0006-3495(99)77409-6. [DOI] [PMC free article] [PubMed] [Google Scholar]
- Tosetti P, Taglietti V, Toselli M. Action-potential-like depolarizations relieve opioid inhibition of N-type Ca2+ channels in NG108-15 cells. Pflügers Archiv. 1999;437:441–448. doi: 10.1007/s004240050799. [DOI] [PubMed] [Google Scholar]
- Tsunoo A, Yoshii M, Narahashi T. Block of calcium channels by enkephalin and somatostatin in neuroblastoma-glioma hybrid NG108-15 cells. Proceedings of the National Academy of Sciences of the USA. 1986;83:9832–9836. doi: 10.1073/pnas.83.24.9832. [DOI] [PMC free article] [PubMed] [Google Scholar]
- Way M, Parton RG. M-caveolin, a muscle-specific caveolin-related protein. FEBS Letters. 1995;376:108–112. doi: 10.1016/0014-5793(95)01256-7. [DOI] [PubMed] [Google Scholar]
- Womack MD, McCleskey EW. Interaction of opioids and membrane potential to modulate Ca2+ channels in rat dorsal root ganglion neurons. Journal of Neurophysiology. 1995;73:1793–1798. doi: 10.1152/jn.1995.73.5.1793. [DOI] [PubMed] [Google Scholar]
- Yhe GC, Hsieh TH, Chasg SF. The negative influence of endogenous opioid receptor activity on the differentiation of the rat pheochromocytoma PC12 cells induced by nerve growth factor. Neuroscience Letters. 1998;252:25–28. doi: 10.1016/s0304-3940(98)00528-x. [DOI] [PubMed] [Google Scholar]
- Zamponi GW, Snutch TP. Decay of prepulse facilitation of N type calcium channels during G protein inhibition is consistent with binding of a single Gβ subunit. Proceedings of the National Academy of Sciences of the USA. 1998;95:4035–4039. doi: 10.1073/pnas.95.7.4035. [DOI] [PMC free article] [PubMed] [Google Scholar]
- Zhang JF, Ellinor PT, Aldrich RW, Tsien RW. Multiple structural elements in voltage-dependent Ca2+ channels support their inhibition by G proteins. Neuron. 1996;17:991–1003. doi: 10.1016/s0896-6273(00)80229-9. [DOI] [PubMed] [Google Scholar]