

Abstract
ATP-mediated Ca2+ signalling was studied in freshly isolated rat portal vein myocytes by means of a laser confocal microscope and the patch-clamp technique.
In vascular myocytes held at −60 mV, ATP induced a large inward current that was supported mainly by activation of P2X1 receptors, although other P2X receptor subtypes (P2X3, P2X4 and P2X5) were revealed by reverse transcription-polymerase chain reaction.
Confocal Ca2+ measurements revealed that ATP-mediated Ca2+ responses started at initiation sites where spontaneous or triggered Ca2+ sparks were not detected, whereas membrane depolarizations triggered Ca2+ waves by repetitive activation of Ca2+ sparks from a single initiation site.
ATP-mediated Ca2+ responses depended on Ca2+ influx through non-selective cation channels that activated, in turn, Ca2+ release from the intracellular store via ryanodine receptors (RYRs). Using specific antibodies directed against the RYR subtypes, we show that ATP-mediated Ca2+ release requires, at least, RYR2, but not RYR3.
Our results suggest that, in vascular myocytes, Ca2+ influx through P2X1 receptors may trigger Ca2+-induced Ca2+ release at intracellular sites where RYRs are not clustered.
P2 receptors for nucleotides are located on the extracellular surface of a variety of mammalian cell types, including smooth muscle cells (Kunapuli & Daniel, 1998; Ralevic & Burnstock, 1998). They can be divided into two main classes according to their signalling mechanisms. P2X receptors are ligand-gated cation channels, whereas metabotropic P2Y receptors are G protein-coupled receptors (Fredholm et al. 1997). To date, seven types of P2X receptor and at least five types of P2Y receptor have been identified at the molecular level (North & Surprenant, 2000). Frequently, multiple purinoceptor subtypes have been found to co-exist in the same cell, but their relative importance is only beginning to be understood (Boarder & Hourani, 1998). In smooth muscle cells, the expression of P2Y receptors is markedly upregulated in culture, so that their effects may become predominant (Erlinge et al. 1998). In freshly dissociated or short-term cultured smooth muscle cells, P2X receptors are the major purinoceptors expressed and their activation leads to inward current through non-selective cation channels (Benham & Tsien, 1987; Honoréet al. 1989). From cytosolic Ca2+ measurements, it has been suggested that ATP may release Ca2+ from intracellular stores in response to activation of a Ca2+-induced Ca2+ mechanism (Luo et al. 1999). However, the Ca2+ signalling pathway that is activated by P2X receptors remains to be elucidated.
In smooth muscle, intracellular Ca2+ signals can be generated by inositol 1,4,5-trisphosphate-gated channels (InsP3Rs) and ryanodine-sensitive channels (RYRs) and there are indications that these two Ca2+ release channels are located on the same intracellular store in some cell types. In rat portal vein myocytes, Ca2+ sparks have been shown to be produced by RYRs, as in other types of muscle cell (Arnaudeau et al. 1996; Mironneau et al. 1996). It has been shown that the spatiotemporal summation of Ca2+ sparks activated by L-type Ca2+ current gives rise to propagated Ca2+ waves (Cheng et al. 1996; Lipp & Niggli, 1996; Arnaudeau et al. 1997). Using an antisense strategy, it has been shown that triggered Ca2+ sparks and propagated Ca2+ waves both require RYR subtype 1 (RYR1) and 2 (RYR2), but not RYR subtype 3 (RYR3). This hierarchical Ca2+ signalling, from elementary Ca2+ sparks to propagated Ca2+ waves, is responsible for the angiotensin II-activated increase in [Ca2+]i (Arnaudeau et al. 1996). In noradrenaline-induced propagated Ca2+ waves, Ca2+ sparks are activated locally by Ca2+ release through InsP3-gated channels and contribute to an all-or-none increase in [Ca2+]i (Boittin et al. 1999).
The aims of the present study were to characterize the Ca2+ signalling pathway activated by ATP in rat portal vein myocytes and to identify the Ca2+ release channels that are involved in the ATP-induced Ca2+ responses. We report that: (1) ATP induces Ca2+ responses, essentially through activation of P2X1 receptors, which (in contrast to membrane depolarizations) do not start from the initiation sites that produce spontaneous or triggered Ca2+ sparks; and (2) ATP-mediated Ca2+ release requires, at least, activation of RYR2, but not RYR3. These results suggest that, in vascular myocytes, ATP-activated Ca2+ influx through non-selective cation channels may trigger Ca2+-induced Ca2+ release at intracellular sites where RYRs are not clustered.
METHODS
Cell preparation
Experiments conformed with the European Community and French guiding principles for the care and use of laboratory animals (authorized by the French Ministre de l'Agriculture et de la Pêche). Rats (160–180 g) were killed by cervical dislocation. The portal vein was cut into several pieces and incubated in low Ca2+ (40 μm) physiological solution for 10 min. Thereafter, 0.8 mg ml−1 collagenase (EC 3.4.24.3), 0.2 mg ml−1 pronase E (EC 3.4.24.31) and 1 mg ml−1 bovine serum albumin were added at 37 °C for 20 min. Subsequently, the solution was removed and the pieces of portal vein were incubated again in a fresh enzyme solution at 37 °C for 20 min. The tissues were placed in an enzyme-free solution and triturated using a fire-polished Pasteur pipette to dissociate cells. Cells were seeded at a density of 103 cells mm−2 on glass slides and used on the same day.
Reverse transcription-polymerase chain reaction
Total RNA was extracted from cells on one slide using an RNeasy mini kit (Qiagen, Hilden, Germany) according to the manufacturer's instructions. The reverse transcription (RT) reaction was performed using a Sensiscript RT kit (Qiagen). Total RNA was incubated with oligo-dT(15) primers (Promega, Lyon, France) at 65 °C for 5 min. RT mix was added after 15 min at room temperature and the total RT mix was incubated for 60 min at 37 °C. A control without reverse transcriptase was included in each experiment. The resulting cDNA was stored at −20 °C. Polymerase chain reaction (PCR) was performed with 2 μl of cDNA (in RT-PCR mix), 1.25 units of HotStartTaq DNA polymerase (Qiagen), 2.5 mm MgCl2, 0.5 μm of each primer and 200 μm of each deoxynucleotide trisphosphate, in a final volume of 50 μl. The PCR conditions were 95 °C for 15 min, followed by 35 cycles at 94 °C for 1 min, 62 °C for 1 min and 72 °C for 1.5 min. After the PCR, samples were kept at 72 °C for 10 min for final extension and then stored at 4 °C. The optimal hybridization temperature was determined by using a gradient of temperature between 45 and 65 °C. RT was performed with a thermal cycler (Techne, Cambridge, UK) and PCR was performed with the Mastercycler gradient (Eppendorf, Paris, France). Amplification products were separated by electrophoresis (2 % agarose gel) and visualized with ethidium bromide. Gels were photographed with EDAS 120 and analysed with KDS1D 2.0 software (Kodak Digital Science, Paris, France). Sense and antisense primer pairs specific for P2X receptors were previously described by Shibuya et al. (1999) and were verified by comparison with cloned receptor sequences available in GenBank with DNAstar software (Lasergene, DNAstar, Madison, USA). The length of the expected PCR products for the P2X receptor fragments was 452 bp for P2X1, 357 bp for P2X2, 440 bp for P2X3, 447 bp for P2X4, 418 bp for P2X5, 520 bp for P2X6 and 354 bp for P2X7. PCR fragments were sequenced by the Qiagen sequencing service.
Patch-clamp measurements
Voltage-clamp and membrane current recordings were made using a standard patch-clamp technique with a List EPC7 patch-clamp amplifier (Darmstadt-Eberstadt, Germany). Patch-clamp pipettes of 2–5 MΩ resistance were used for whole-cell recording. Membrane potential and current records were stored and analysed with pCLAMP software (Axon Instruments, Foster City, CA, USA). Ba2+ currents were corrected digitally for leakage current. Cell capacitance was determined in each cell tested by imposing 10 mV hyperpolarizing steps from the holding potential. The normal physiological solution contained 130 mm NaCl, 5.6 mm KCl, 1 mm MgCl2, 1.7 mm CaCl2, 11 mm glucose and 10 mm Hepes (pH adjusted to 7.4 with NaOH). Ca2+-free solution was prepared by omitting CaCl2 and by adding 0.5 mm EGTA. Low Na+ solution was prepared by replacing 100 mm NaCl with tetraethylammonium chloride. The standard pipette solution contained 120 mm CsCl, 10 mm NaCl and 10 mm Hepes (pH adjusted to 7.3 with NaOH). The low Cl− pipette solution was prepared by replacing 105 mm CsCl with caesium aspartate. The external solution used to record Ba2+ currents was prepared by replacing CaCl2 with 5 mm BaCl2. In experiments where antibodies were added to the pipette solution, the infusion time after breakthrough in the whole-cell recording mode was at least 7 min, which is longer than the time expected theoretically for diffusion of substances in solution (Viard et al. 1999).
Cytosolic Ca2+ measurements
In all experiments, fluo 3 (60 μm) was dialysed into cells through the patch-clamp pipette. Images were acquired using the linescan mode of a confocal BioRad MRC1000 microscope (BioRad, Paris, France) connected to a Nikon Diaphot microscope. Excitation light was delivered by a 25 mW argon ion laser (Ion Laser Technology, Salt Lake City, UT, USA) through a Nikon Plan Apo ×60, 1.4 NA objective lens. Fluo 3 was excited at 488 nm and fluorescence emission was filtered and measured at 540 ± 30 nm. At the setting used to detect fluo 3 fluorescence, the resolution of the microscope was near 0.4 μm × 0.4 μm × 1.5 μm (x-, y- and z-axis, respectively). Images were acquired in the linescan mode at a rate of 6 ms per scan. Scanned lines were plotted vertically and each line was added to the right of the preceding line to form the linescan image. In these images, time increased from the left to the right, and the position along the scanned line was given by the vertical displacement. Fluorescence signals are expressed as the pixel per pixel fluorescence ratio (F/F0), where F is the fluorescence during a response and F0 is the rest level fluorescence of the same pixel.
Image processing and analysis were performed by using COMOS, TCSM and MPL 1000 software (BioRad). Bay K8644, ATP, αβ-MeATP, UTP and caffeine were applied by pressure ejection from a glass pipette for the period indicated on the records. All experiments were carried out at 26 ± 1 °C.
In some experiments, myocytes were incubated in the presence of 10 μm DI-8-Anepps for 10 min and rinsed twice in physiological solution before performing patch-clamp and [Ca2+]i measurements.
P2X receptor labelling
Myocytes were immunostained as previously described (Macrez-Leprêtre et al. 1997), except that donkey serum was used instead of fetal calf serum. Myocytes were incubated in the presence of anti-P2X1 receptor or anti-P2X4 receptor antibody (1:200 dilution) for 20 h at 4 °C. The secondary antibody (donkey anti-rabbit IgG conjugated to fluorescein-isothiocyanate (FITC), 1:200 dilution) was added for 3 h at 20 °C. Thereafter, myocytes were mounted in Vectashield. Controls without primary antibodies or after inactivation of the antibodies with their antigen peptides were included in each experiment. Images of the stained cells were obtained with the BioRad MRC 1000 confocal microscope.
Chemicals and drugs
Collagenase was obtained from Worthington (Freehold, NJ, USA). Fluo 3 and DI-8-Anepps (pyridinium, 4-[2-[6-(dioctylamino)-2-naphtalenyl]ethyl]-1-(3-sulfopropyl) salt) were obtained from Molecular Probes (Leiden, The Netherlands). Caffeine obtained was from Merck (Nogent sur Marne, France). Bay K8644 was obtained from Bayer (Puteaux, France). Oxodipine was a gift from A. Galiano (Instituto de Investigacion y Desarrollo Quimico Biologico, Madrid, Spain). All nucleotides, noradrenaline and heparin (from porcine intestinal mucosa, MW = 6000) were from Sigma (St Louis, MO, USA). Ryanodine and cyclopiazonic acid were obtained from Calbiochem (Meudon, France). Guanosine-5′-0-(2-thiodiphosphate) was obtained from Boehringer (Mannheim, Germany). The rabbit anti-P2X1 and anti-P2X4 receptor antibodies (Alomone Labs, Jerusalem, Israel) were directed against polypeptides corresponding to residues 382–399 and 370–388 of the rat P2X1 and P2X4 receptors, respectively. The rabbit polyclonal anti-InsP3R (407143, Calbiochem) and mouse monoclonal anti-RYR (559279, Calbiochem) antibodies were directed against polypeptides corresponding to the last 11 or 13 residues of the C-terminus of the InsP3R or the RYR. The mouse monoclonal anti-RYR2 antibody (clone C3–33) was from RBI (Natick, MA, USA). The rabbit polyclonal anti-RYR3 antibody was prepared in house and directed against the deduced amino acid sequence between residues 4326 and 4336 (11 amino acids) of rabbit RYR3 (Jeyakumar et al. 1998). For immunological detection, FITC-conjugated affinity-purified donkey anti-rabbit IgG and donkey serum was from Jackson Immunoresearch Laboratories (West Grove, PA, USA) and Vectashield was from AbCys (Paris, France).
Data analysis
Results are expressed as means ±s.e.m. Statistical significance was assessed by means of Student's t test. P < 0.05 was considered statistically significant.
RESULTS
ATP-mediated membrane current in single rat portal vein myocytes
Application of 10 μm ATP to a venous myocyte with the membrane potential held at −60 mV caused an inward current (Fig. 1A). The ATP-induced inward current activated rapidly and then decayed before removal of ATP. The mean current amplitude was 595 ± 45 pA (n = 41). ATP may activate both a non-selective cation current and a Cl− current. Accordingly, the reversal potential under the ionic composition of the solutions used in the present study (18 ± 2 mV, n = 15) did not correspond to the equilibrium potential for Cl−, Na+ or Ca2+ ions. After substituting 105 mm caesium aspartate for 105 mm CsCl in the pipette solution, the Cl− equilibrium potential was around −45 mV. At a holding potential of −60 mV, the Ca2+-dependent Cl− current is expected to be strongly reduced. Application of 10 μm ATP evoked a transient inward current (525 ± 55 pA, n = 12) that had a significantly shorter time to half-maximal amplitude (115 ± 30 ms, n = 12) than that recorded with the standard pipette solution (237 ± 45 ms, n = 12). The reversal potential in the low Cl− pipette solution (14 ± 4 mV, n = 12) was not significantly different from that obtained in the standard pipette solution. Finally, when the Na+ equilibrium potential was shifted from 67 to 28 mV in 30 mm external Na+ concentration, the reversal potential of the ATP-induced current was shifted to −5.1 ± 1.5 mV (n = 8), suggesting that the conductance that underlies this current was, in part, a non-selective cation conductance. The fact that Ca2+ influx occurred through the channel opened by ATP was supported by the effects of Ca2+-free solution on the ATP-induced increase in [Ca2+]i (see below).
Figure 1. Membrane currents activated in rat portal vein myocytes by external application of ATP.
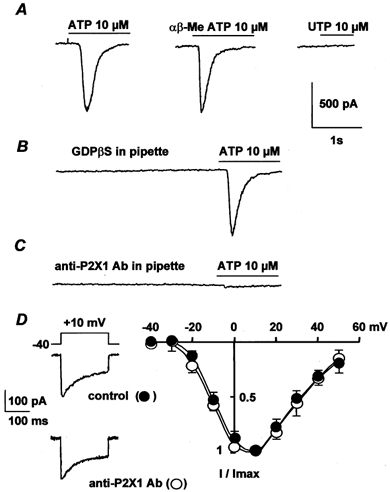
A, effects of 10 μm ATP, 10 μmαβ-MeATP and 100 μm UTP obtained from three different cells. B, pipette solution contained 2 mm GDPβS and the cell was dialysed with the pipette solution for 5 min before application of 10 μm ATP. C, intracellular application of 10 μg ml−1 anti-P2X1 antibody for 7 min before application of 10 μm ATP. In A–C, the myocytes were held at −60 mV. D, typical Ba2+ currents elicited by depolarization to 10 mV from a holding potential of −40 mV and current-voltage relationships obtained in control conditions (•) and after intracellular application of 10 μg ml−1 anti-P2X1 antibody for 7 min (○). Currents are expressed as a fraction of the maximal current (I/Imax) and are the means ±s.e.m. for 7–9 cells.
Because P2Y receptors, but not P2X receptors, are coupled to G proteins (Fredholm et al. 1997), a convenient way to identify P2X receptors is to measure the effect of inhibition of G proteins with GDPβS on the ATP-induced current. Figure 1B shows that including 2 mm GDPβS in the pipette solution had no significant effect on the ATP-induced currents (control cells: 615 ± 50 pA, n = 12; GDPβS-infused cells: 605 ± 45 pA, n = 12). In addition, application of 10 μmαβ-MeATP, which is a potent P2X receptor agonist, induced a current that was similar to that induced by ATP (Fig. 1A), with a mean current amplitude of 562 ± 51 pA (n = 11). By contrast, 100 μm UTP, a potent P2Y receptor agonist, was unable to induce any inward current (Fig. 1A). Thus, we conclude that the pharmacological characterization of P2 receptors suggests that P2X receptors exist in freshly dissociated rat portal vein myocytes.
A reliable approach to identify P2X receptor subtype expression in a defined cell type is PCR analysis. mRNA was purified from rat portal vein myocytes and reverse transcribed into cDNA. Subtype-specific primers designed by Shibuya et al. (1999) to amplify cDNA were used. As illustrated in Fig. 2A, amplified fragments of P2X1, P2X3, P2X4 and P2X5 receptors were detected in rat portal vein myocytes. A comparison with the published rat P2X receptor sequences indicated 98–100 % identity with the cloned receptors (not shown).
Figure 2. Expression of P2X receptors in rat portal vein myocytes.
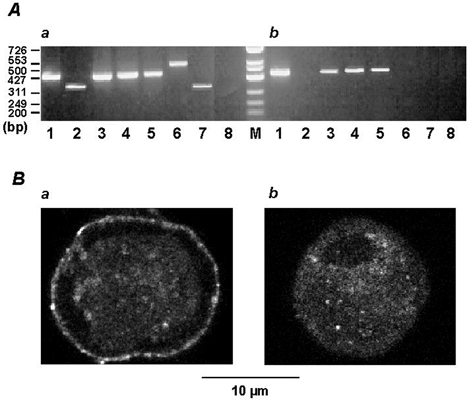
A, amplified DNA fragments of P2X receptors (lanes 1–7) from rat brain (a) and rat portal vein myocytes (b) were separated on a 2 % agarose gel and visualized by staining with ethidium bromide. Lane 8, RNA from brain and portal vein myocytes in the absence of reverse transcriptase served as a negative control. Numbers on the left indicate molecular size standards in base pairs (bp). For RNA purification and PCR conditions, see Methods. B, immunostaining of P2X receptor subtypes in portal vein myocytes. Myocytes were stained with anti-P2X1 receptor (a) or anti-P2X4 receptor antibody (b) and vizualization was realized with a donkey anti-rabbit IgG FITC-conjugated antibody. In the absence of primary antibodies or after inactivation of the antibodies by their antigen peptides, only a faint background fluorescence was observed (not shown). Typical confocal sections were performed above the nucleus and therefore appeared spherical. Both P2X1 (a) and P2X4 (b) receptor subtypes were distributed throughout the confocal sections with a marked staining of P2X1 receptor subtype at the cell periphery.
Immunodetection of P2X receptors in 0.5 μm confocal sections from rat portal vein myocytes was performed with the commercially available anti-P2X1 and anti-P2X4 receptor antibodies and the binding sites were revealed with FITC-conjugated secondary antibody. As shown in Fig. 2B, both P2X1 and P2X4 receptors were detected in whole-cell confocal sections. P2X1 receptors formed a dense staining at the cell periphery, whereas P2X4 receptors were homogeneously distributed in the cell sections. Anti-P2X receptor antibodies were applied intracellularly via the patch-clamp pipette to identify the P2X receptors that were responsible for the ATP-induced inward current. Intracellular application of the anti-P2X1 receptor antibody for 7 min inhibited the ATP-induced inward current in a concentration-dependent manner with a maximal inhibition (89 ± 7 %, n = 12) obtained at 10 μg ml−1 (Fig. 1C). The antibody-induced inhibition was specific, because inactivated antibody obtained by pretreatment with the antigen peptide had no significant effect on the ATP-induced inward current (n = 6; not shown). In addition, intracellular application of 10 μg ml−1 anti-P2X1 antibody for 7 min had no effect on either the peak Ba2+ current or the current-voltage relationship of the Ba2+ current (Fig. 1D). Intracellular application of 10 μg ml−1 anti-P2X4 receptor antibody resulted in a slight, but non-significant, inhibition of the ATP-induced inward current (8 ± 6 %, n = 10). These results suggest that in freshly isolated rat portal vein myocytes, the effects of ATP are dominated by the P2X1 receptor.
ATP-mediated Ca2+ responses
External application of ATP either induced rather uniform increases in [Ca2+]i at low ATP concentrations (Fig. 3A) or propagated Ca2+ waves at higher ATP concentrations (Fig. 3B and C). The Ca2+ responses started from the edges of a cell, but a clear initiation signal, similar to Ca2+ sparks, was never observed (n = 82). The ATP-induced Ca2+ responses were not affected by inhibition of voltage-gated Ca2+ channels through the continuous presence of 10 μm oxodipine (a light-stable dihydropyridine). Plotting the fluorescence signal amplitude as a function of ATP concentration resulted in a concentration-response curve with a concentration corresponding to half-maximal stimulation of about 0.3 μm (Fig. 3D). At 10 μm ATP, the maximal upstroke velocity and maximal propagation rate of the Ca2+ wave were estimated to be 25.1 ± 6.5 units s−1 (Δ(F/F0) s−1) and 68 ± 29 μm s−1 (n = 12), respectively (Fig. 3C). At lower ATP concentrations (0.1 μm or less), localized and transient Ca2+ responses were not detected in any of the cells tested (n = 33). When the myocytes were perfused in Ca2+-free 0.5 mm EGTA-containing solution for 20–30 s, the ATP-induced Ca2+ response was almost completely abolished (n = 7). Similarly, when the myocytes were infused with 10 μg ml−1 anti-P2X1 receptor antibody for 7 min, application of 10 μm ATP was ineffective (n = 5).
Figure 3. Increase in [Ca2+]i evoked by increasing concentrations of ATP.
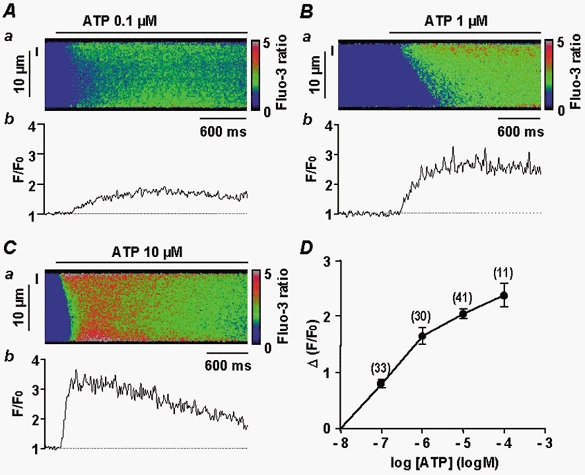
A–C, Ca2+ responses shown as a linescan image (a) and spatial averaged fluorescence (b; F/F0). Data are for a 2 μm region indicated by the vertical line to the left of the corresponding linescan image. Responses are to 0.1 μm (A), 1 μm (B) or 10 μm ATP (C). D, concentration-response curve for increasing concentrations of ATP, obtained by measuring peak [Ca2+]i (Δ(F/F0)) in a 2 μm region of the linescan images. Data are means ±s.e.m with the number of cells tested indicated in parentheses. Myocytes were loaded with fluo 3 via the patch pipette and held at −60 mV.
In order to identify more precisely the initiation sites corresponding to Ca2+ sparks and ATP-induced Ca2+ responses, we stained the plasma membrane with DI-8-Anepps in functional myocytes dialysed with the fluo 3-containing pipette solution. This staining showed the localization of the plasma membrane in the periphery of the cell section, but also the presence of several infoldings inside the cell section, which appeared as dark areas (Fig. 4A). The linescan image obtained from the scanned line shown in Fig. 4Aa revealed spontaneous Ca2+ sparks (Fig. 4Ab) that were generated close to the membrane delimiting such infoldings (Fig. 4Ac).
Figure 4. Localization of Ca2+ sparks and Ca2+ responses induced by ATP, membrane depolarization and Bay K8644.
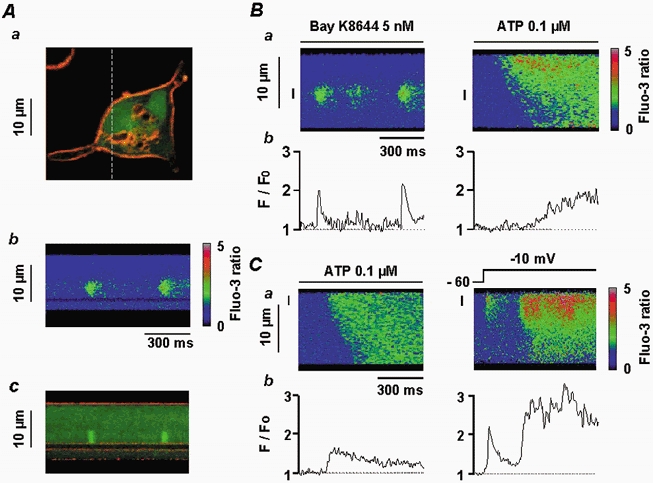
Aa, vascular myocyte stained with DI-8-Anepps (10 μm) and fluo 3 (60 μm) showing the plasma membrane (red) and cytosol (green). The dashed line corresponds to the scanned line. Ab, linescan image showing Ca2+ sparks. Ac, superimposition of Ca2+ sparks and DI-8-Anepps staining, illustrating the localization of the Ca2+ sparks close to the infolding of the plasma membrane shown in Aa. B, Ca2+ sparks triggered by application of 5 nm Bay K8644 and ATP-induced Ca2+ response in the same cell, shown as a linescan image (a) and spatial averaged fluorescence (b). Data are for the same 2 μm region indicated by the vertical line to the left of the corresponding linescan image. C, ATP-induced Ca2+ response and Ca2+ spark induced by a depolarization step from −60 to −10 mV in the same cell, shown as a linescan image (a) and spatial averaged fluorescence (b). Data are for the same 2 μm region indicated by the vertical line on the linescan image. Myocytes were loaded with fluo 3 via the patch pipette and held at −60 mV.
In a myocyte where Ca2+ sparks were triggered by external application of 5 nm Bay K8644 (an L-type Ca2+ channel activator), a further application (2 min later) of 0.1 μm ATP activated a Ca2+ response that started from an edge of the cell rather than at the initiation site of the Ca2+ sparks (Fig. 4B). In another myocyte, 0.1 μm ATP was applied first and initiated a homogeneous Ca2+ response (Fig. 4C). Two minutes later, membrane depolarization (from −60 to −10 mV) activated a Ca2+ spark that gave rise to a propagated Ca2+ wave (Fig. 4C). Similar results were obtained in 11 other cells, where Ca2+ waves triggered by membrane depolarizations started from Ca2+ spark initiation sites, whereas the ATP-induced Ca2+ responses did not.
Ca2+ release channels involved in ATP-mediated Ca2+ responses
To assess whether Ca2+ release is a component of the ATP-induced increase in [Ca2+]i, ATP was applied immediately after the Ca2+ store had been depleted by 10 mm caffeine. The ATP-induced Ca2+ responses were decreased by 85 ± 5 % (n = 12). Similarly, pre-treatment with 10 μm cyclopiazonic acid for 15 min, which depleted the Ca2+ store, inhibited the Ca2+ response induced by 10 μm ATP in the presence of external Ca2+ (n = 9). To identify the Ca2+ release channels that were responsible for the ATP-induced Ca2+ release, we used anti-RYR and anti-InsP3R antibodies, which have been shown to be useful to immunologically detect and inhibit RYRs and InsP3Rs in these cells (Boittin et al. 1999). The effect of the anti-RYR antibody was revealed by the concentration-dependent inhibition of the membrane depolarization (−60 to 10 mV)-induced Ca2+ response, with maximal inhibition obtained at 10 μg ml−1 (Fig. 5A). The anti-RYR antibody-induced inhibition was specific, because boiled (95 °C for 30 min) anti-RYR antibody had no significant effect on the membrane depolarization-induced Ca2+ response (Fig. 5A). The anti-InsP3R antibody inhibited the noradrenaline-induced Ca2+ response, which is known to depend on InsP3 generation (Leprêtre et al. 1994), in a concentration-dependent manner (Fig. 5B). The anti-InsP3R antibody-induced inhibition was specific, as shown by the absence of any effect of boiled anti-InsP3R antibody on the noradrenaline-induced Ca2+ response (Fig. 5B). Susqeuently, we tested the effects of anti-RYR and anti-InsP3R antibodies on ATP-induced Ca2+ responses. As shown in Fig. 5C, intracellular application of 10 μg ml−1 anti-InsP3R antibody for 7 min had no effect on the ATP-induced Ca2+ response, whereas intracellular application of 10 μg ml−1 anti-RYR antibody for 7 min inhibited the ATP-induced Ca2+ response. The antibody-induced inhibition was specific, because boiled (95 °C for 30 min) anti-RYR antibody had no significant effect on the Ca2+ responses evoked by 10 μm ATP (Fig. 5C). In agreement with these results, intracellular application of 1 mg ml−1 heparin for 5 min had no effect on the ATP-induced Ca2+ response, whereas external application of 10 μm ryanodine for 15 min inhibited the ATP-induced Ca2+ response (n = 12). These results indicate that the ATP-induced Ca2+ release involves specifically the RYRs in freshly isolated rat portal vein myocytes.
Figure 5. Effects of anti-RYR and anti-InsP3R antibodies on ATP-induced Ca2+ responses.
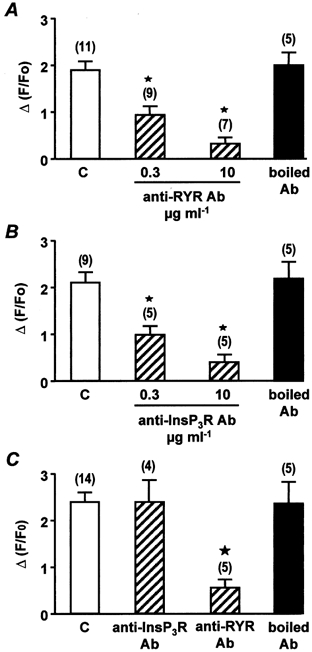
A, peak Ca2+ responses evoked by membrane depolarizations (−60 to 10 mV) in control conditions (C) and in the presence of increasing concentrations of anti-RYR antibody or 10 μg ml−1 boiled anti-RYR antibody, each applied intracellularly for 7 min. Data are means ±s.e.m. with the number of cells tested indicated in parentheses. B, peak Ca2+ responses evoked by 10 μm noradrenaline in control conditions (C) and in the presence of increasing concentrations of anti-InsP3R antibody or 10 μg ml−1 boiled anti-InsP3R antibody, each applied intracellularly for 7 min. Data are means ±s.e.m. with the number of cells tested indicated in parentheses. C, peak Ca2+ responses evoked by 10 μm ATP in control conditions (C) and in the presence of 10 μg ml−1 anti-InsP3R antibody, anti-RYR antibody or boiled anti-RYR antibody, each applied intracellularly for 7 min. Data are means ±s.e.m. with the number of cells tested indicated in parentheses. [Ca2+]i was measured in a 2 μm region of the linescan image. Cells were obtained from three different batches. ⋆, values significantly different from controls (P < 0.05). Myocytes were loaded with fluo 3 via the patch pipette and held at −60 mV.
We have recently shown that Ca2+ sparks and global Ca2+ responses generated by membrane depolarizations in 1.7 mm Ca2+-containing solution require activation of the RYR subtypes 1 and 2, whereas the RYR subtype 3 is not involved (Coussin et al. 2000). These results were obtained by using antisense oligonucleotides targeting each one of the three RYR subtypes. In the present study, we used intracellular applications of specific anti-RYR antibodies directed against RYR1+2+3 (anti-RYR antibody), RYR2 (anti-RYR2 antibody; Xu et al. 1994) or RYR3 alone (anti-RYR3 antibody; Jeyakumar et al. 1998) to assess the effect on the Ca2+ responses evoked by ATP, Bay K8644, membrane depolarization and caffeine. First, we tested the effect of the anti-RYR2 antibody on both the number of Ca2+ sparks evoked by external application of 5 nm Bay K8644 and the membrane depolarization (−60 to 10 mV)-induced Ca2+ response. As shown in Fig. 6, intracellular application of 10 μg ml−1 anti-RYR2 antibody for 7 min strongly inhibited these Ca2+ responses. The anti-RYR2 antibody-induced inhibition was similar to that induced by the anti-RYR antibody. By contrast, the Ca2+ responses evoked by 10 μm ATP or 10 mm caffeine were almost abolished by the anti-RYR antibody, but were only inhibited by 50 % by the anti-RYR2 antibody (Fig. 7). The inhibitory effects of the anti-RYR and anti-RYR2 antibodies were considered to be specific, because boiled (95 °C for 30 min) anti-RYR receptor antibodies had no significant effect on the frequency of Ca2+ sparks or the Ca2+ responses induced by membrane depolarizations, ATP and caffeine (Fig. 6 and Fig. 7).
Figure 6. Effects of anti-RYR and anti-RYR2 antibodies on Bay K8644-induced Ca2+ sparks and on Ca2+ responses induced by membrane depolarization.
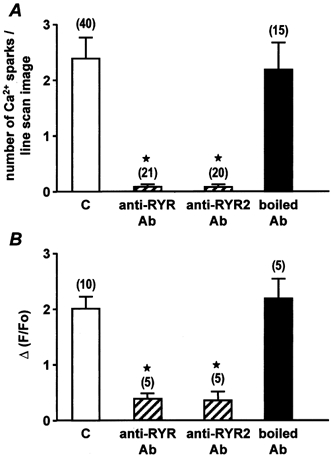
A, mean number of Ca2+ sparks per linescan image evoked by external application of 5 nm Bay K8644 in control conditions (C) and in the presence of 10 μg ml−1 anti-RYR antibody, anti-RYR2 antibody or boiled anti-RYR2 antibody, each applied intracellularly for 7 min. B, peak Ca2+ responses evoked by membrane depolarization (−60 to 10 mV) in control conditions (C) and in the presence of 10 μg ml−1 anti-RYR antibody, anti-RYR2 antibody or boiled anti-RYR2 antibody, each applied intracellularly for 7 min. Data are means ±s.e.m. with the number of cells tested indicated in parentheses. [Ca2+]i was measured in a 2 μm region of the linescan image. Cells were obtained from three different batches. ⋆, values significantly different from controls (P < 0.05). Myocytes were loaded with fluo 3 via the patch pipette and held at −60 mV.
Figure 7. Effects of anti-RYR and anti-RYR2 antibodies on Ca2+ responses induced by ATP and caffeine.
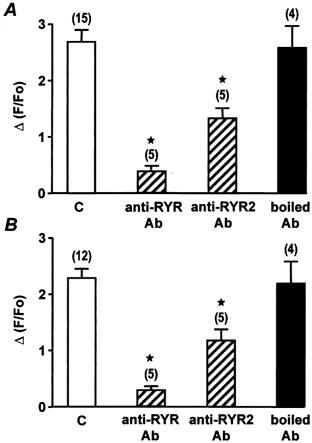
A, peak Ca2+ responses evoked by 10 μm ATP in control conditions (C) and in the presence of 10 μg ml−1 anti-RYR antibody, anti RYR2 antibody or boiled anti-RYR2 antibody, each applied intracellularly for 7 min. B, peak Ca2+ responses evoked by 10 mm caffeine in control conditions (C) and in the presence of 10 μg ml−1 anti-RYR antibody, anti-RYR2 antibody or boiled anti-RYR2 antibody, each applied intracellularly for 7 min. Data are means ±s.e.m. with the number of cells tested indicated in parentheses. [Ca2+]i was measured in a 2 μm region of the linescan image. Cells were obtained from three differents batches. ⋆, values significantly different from controls (P < 0.05). Myocytes were loaded with fluo 3 via the patch pipette and held at −60 mV.
We have shown previously that RYR3 is capable of being activated in Ca2+-overloaded myocytes (Mironneau et al. 2001). Therefore, we used Ca2+-overloaded myocytes (bathed in 10 mm[Ca2+]o for 1 h) in the present study to test the effect of the anti-RYR3 antibody. As illustrated in Fig. 8A, intracellular application of 10 μg ml−1 anti-RYR3 antibody reduced the amplitude of the caffeine-induced Ca2+ response obtained in 10 mm[Ca2+]o. Interestingly, in Ca2+-overloaded myocytes, the amplitude of the caffeine-induced Ca2+ response in the presence of the anti-RYR3 antibody was similar to that obtained in control cells superfused with 1.7 mm[Ca2+]o (Fig. 8A). The antibody-induced inhibition was specific, because boiled (95 °C for 30 min) anti-RYR3 antibody had no effect on the caffeine-induced Ca2+ response in Ca2+-overloaded myocytes. In myocytes superfused with 1.7 mm[Ca2+]o, intracellular application of 10 μg ml−1 anti-RYR3 antibody had no significant effect on ATP- and caffeine-induced Ca2+ responses (Fig. 8B), or the number of Ca2+ sparks evoked by external application of 5 nm Bay K8644 (data not shown). These results indicate that in 1.7 mm Ca2+-containing solution, the Ca2+ responses evoked by Ca2+ influx through L-type Ca2+ channels or non-selective cation channels require RYR2, but not RYR3.
Figure 8. Effects of anti-RYR3 antibody on Ca2+ responses induced by ATP and caffeine.
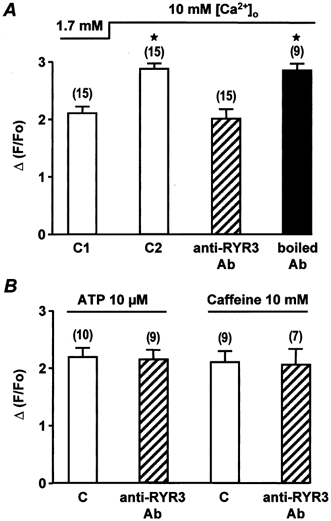
A, peak Ca2+ responses evoked by 10 mm caffeine in 1.7 mm[Ca2+]o (C1), 10 mm[Ca2+]o (C2) and in the presence of 10 μg ml−1 anti-RYR3 antibody or boiled anti-RYR3 antibody (applied intracellularly for 7 min). ⋆, values significantly different from controls in 1.7 mm[Ca2+]o (P < 0.05). B, peak Ca2+ responses evoked by 10 μm ATP and 10 mm caffeine in control conditions (C) in 1.7 mm[Ca2+]o and in the presence of 10 μg ml−1 anti-RYR3 antibody (applied intracellularly for 7 min). Data are means ±s.e.m. with the number of cells tested indicated in parentheses. Cells are obtained from two different batches. Myocytes were loaded with fluo 3 via the patch pipette and held at −60 mV.
DISCUSSION
Electrophysiological experiments and confocal Ca2+ imaging of rat portal vein myocytes in the present study revealed that the ATP-induced Ca2+ response is mediated by activation of P2X1 receptors and involves Ca2+ influx through non-selective cation channels, which is further amplified by Ca2+ release through RYRs of the sarcoplasmic reticulum. We were unable to detect typical Ca2+ sparks, suggesting that P2X1 receptors are not colocalized with clusters of RYRs, in contrast to L-type Ca2+ channels. Using anti-RYR subtype antibodies, we showed that RYR2 is required for ATP-induced Ca2+ responses, but not RYR3.
The involvement of P2X receptors in mediating a large inward current at the resting membrane potential and Ca2+ influx has been described previously (Benham & Tsien, 1987; Lewis et al. 2000). This study shows that in freshly dissociated rat portal vein myocytes, the ATP-induced Ca2+ response is mediated by P2X1 receptors. Several lines of evidence support this conclusion. First, αβ-MeATP was as effective as ATP in inducing inward current, whereas UTP had no effect. The reversal potential of the ATP-induced current was modified by a shift in the Na+ equilibrium potential, but not in the Cl− equilibrium potential, suggesting that it is a non-selective cation current. Second, infusion of 2 mm GDPβS into the myocytes did not prevent the response to ATP, supporting the idea of a receptor-gated channel. Third, RT-PCR experiments revealed the expression of several P2X receptor isoforms (P2X1, P2X3, P2X4 and P2X5). However, infusion of the anti-P2X1 receptor antibody suppressed the electrophysiological and Ca2+ responses to ATP, whereas the anti-P2X4 receptor antibody was ineffective. In addition, immunostaining showed a marked localization for P2X1 receptors at the cell periphery, although both P2X1 and P2X4 receptors were detected in whole-cell sections. These results strongly suggest that the P2X1 receptors dominate the ATP-mediated Ca2+ response in rat portal vein myocytes. This concurs with recent data obtained from the vas deferens of P2X1 receptor-deficient mice (Mulryan et al. 2000) and from other smooth muscles (Lewis & Evans, 2000; Lewis et al. 2000; Vial & Evans, 2000). Although the presence of multiple P2X receptor isoforms has been reported at the cellular level in various vessels (Burnstock, 1997; Nori et al. 1998; Lewis et al. 2000), the role of each isoform in the control of smooth muscle function remains to be elucidated.
Previous studies have indicated that activation of P2X receptor-activated cation current leads to an increase in [Ca2+]i in different cell types, including macrophages (Picello et al. 1990), thymocytes (Pizzo et al. 1991), oocytes (Nuttle & Dubyak, 1994), neuroblastoma xNG108–15 cells (Brater et al. 1999) and smooth muscle cells (Benham & Tsien, 1987). In addition, Ca2+ influx through L-type Ca2+ channels can be triggered in response to ATP-induced membrane depolarization. In our experiments, vascular myocytes were held at −60 mV, a potential at which the probability of voltage-dependent Ca2+ channels being open is very low, and oxodipine (an inhibitor of L-type Ca2+ channels) was added in most experiments. The ATP-induced increase in [Ca2+]i was inhibited: (1) after intracellular application of the anti-P2X1 receptor antibody; (2) in the absence of extracellular Ca2+; (3) in the presence of cyclopiazonic acid; or (4) after application of caffeine to empty the intracellular Ca2+ store. These results support the idea that the ATP-induced increase in [Ca2+]i is triggered by Ca2+ influx through P2X1 receptors and secondarily depends on Ca2+ release from the intracellular store. Interestingly, confocal Ca2+ imaging revealed that the initiation sites of ATP-induced Ca2+ responses are always located close to the plasma membrane, but do not correspond to the initiation sites of Ca2+ sparks detected in the same scanned lines. Localized Ca2+ events were never detected in response to ATP, particularly at low concentrations. These observations suggest that the Ca2+ influx through ATP-activated cation channels is large enough to activate isolated RYRs, which, in turn, activate neighbouring RYRs and then elicit a propagated Ca2+ response. We observed that when the ATP-induced Ca2+ response passed through a Ca2+ release unit previously revealed by a Ca2+ spark, the propagation rate was only increased locally. This is in contrast to Ca2+ waves activated by membrane depolarization or Bay K8644, which started preferentially from initiation sites at which Ca2+ sparks had been detected previously in the same scanned lines. Opening of cation channels in toad stomach smooth muscle has been reported to induce a localized Ca2+ event with a Ca2+ spark-like appearance (Zou et al. 1999), but this has been obtained with high speed digital imaging. Although co-immunostaining of L-type Ca2+ channels and P2X1 receptors was not performed in these vascular myocytes, our Ca2+ imaging experiments suggest that the two types of channel could be located in different areas of the plasma membrane. Recent data have shown that caveolae contain L-type Ca2+ channels and that depletion of caveolae by dextrin decreases the frequency, amplitude and spatial size of Ca2+ sparks, which suggests that caveolae are structural elements for the generation of Ca2+ sparks in arterial and cardiac myocytes (Lohn et al. 2000). Caveolae have also been suggested to play a vital role as organized centres of signal transduction, where signalling molecules are highly concentrated (Okamoto et al. 1998; Parton et al. 2000). By contrast, plasma membrane receptors would appear to be preferentially located on the sarcolemma and, therefore, could be more accessible to extracellular factors, such as mediators and hormones.
We have shown in a previous study that the three RYR subtypes are expressed in rat portal vein myocytes (Coussin et al. 2000). Based on an antisense strategy, it has been proposed that both RYR1 and RYR2 participate in Ca2+ sparks and waves elicited by membrane depolarization or application of Bay K8644. Using anti-RYR subtype antibodies, we have confirmed here that in 1.7 mm[Ca2+]o, the RYR3 subtype is required for neither activation of Ca2+ sparks nor ATP- and caffeine-induced Ca2+ responses. Application of an anti-RYR2 antibody inhibited both the ATP- and caffeine-induced Ca2+ responses by about 50 %, whereas application of an antibody directed against the three RYR subtypes almost completely suppressed these responses. Taken together, these data indicate that activation of RYR2 is needed to induce a full Ca2+ response to ATP and that RYR1 might participate in the ATP-induced Ca2+ response. These observations are in good agreement with our previous studies obtained using antisense oligonucleotides, which showed that both RYR1 and RYR2 are required for the caffeine-induced Ca2+ response (Coussin et al. 2000).
The propagation rate of Ca2+ waves induced by 10 μm ATP is similar to that evoked by L-type Ca2+ current (Arnaudeau et al. 1997). In agreement with Niggli's hypothesis (Niggli, 1999) and our proposal that Ca2+ wave propagation in vascular myocytes is linked to the progressive recruitment of isolated and neighbouring RYRs following the sustained activity of a sparking site, we propose that isolated RYRs exhibit a high Ca2+ sensitivity, but a low Ca2+ flux. This is in contrast to Ca2+ sparks triggered by the opening of L-type Ca2+ channels, which might be due to activation of RYRs that exhibit a low Ca2+ affinity, but a high Ca2+ flux (Niggli, 1999). However, this explanation seems unlikely, because the same RYR subtypes (namely, RYR1 and RYR2) are involved in both types of Ca2+ response in vascular myocytes. Therefore, it can be envisaged that clusters of RYRs would be located in those particular cell areas where L-type Ca2+ channels are present, whereas ATP-gated channels would present a homogeneous distribution on the plasmalemma. Another possibility is that the opening of an L-type Ca2+ channel acts as a point-source of Ca2+ in a microdomain and generates a very high Ca2+ concentration in comparison to Ca2+ influx through P2X1 receptor-gated channels. Assuming that ∼6 % of the ATP-activated cation current is carried by Ca2+ ions (Schneider et al. 1991), the Ca2+ component of the ATP-induced current is around 50 pA, which is similar to the peak L-type Ca2+ current (Arnaudeau et al. 1997) and, therefore, does not support the aforementioned hypothesis. More experiments are needed to define the precise location of L-type Ca2+ channels, membrane receptors and RYR subtypes in vascular myocytes and to elucidate their role in Ca2+ responses induced by various neuromediators and hormones.
In conclusion, the results of the present study showed that, in vascular myocytes, Ca2+ responses can be activated by Ca2+ influx through P2X1 receptors. ATP might trigger Ca2+-induced Ca2+ release at intracellular sites where RYRs are not clustered, by activating RYR2, but not RYR3.
Acknowledgments
This work was supported by grants from Centre National de la Recherche Scientifique, Centre National des Etudes Spatiales, P^le Aquitaine Santé, and Association Française contre les Myopathies, France. We thank N. Biendon for secretarial assistance.
References
- Arnaudeau S, Boittin FX, Macrez N, Lavie JL, Mironneau C, Mironneau J. L-type and Ca2+ release channel-dependent hierarchical Ca2+ signalling in rat portal vein myocytes. Cell Calcium. 1997;22:399–411. doi: 10.1016/s0143-4160(97)90024-5. [DOI] [PubMed] [Google Scholar]
- Arnaudeau S, Macrez-Lepretre N, Mironneau J. Activation of calcium sparks by angiotensin II in vascular myocytes. Biochemical and Biophysical Research Communications. 1996;222:809–815. doi: 10.1006/bbrc.1996.0808. [DOI] [PubMed] [Google Scholar]
- Benham CD, Tsien RW. A novel receptor-operated Ca2+-permeable channel activated by ATP in smooth muscle. Nature. 1987;328:275–278. doi: 10.1038/328275a0. [DOI] [PubMed] [Google Scholar]
- Boarder MR, Hourani SM. The regulation of vascular function by P2 receptors: multiple sites and multiple receptors. Trends in Pharmacological Sciences. 1998;19:99–107. doi: 10.1016/s0165-6147(98)01170-5. [DOI] [PubMed] [Google Scholar]
- Boittin FX, Macrez N, Halet G, Mironneau J. Norepinephrine-induced Ca2+ waves depend on InsP3 and ryanodine receptor activation in vascular myocytes. American Journal of Physiology. 1999;277:C139–151. doi: 10.1152/ajpcell.1999.277.1.C139. [DOI] [PubMed] [Google Scholar]
- Brater M, Li SN, Gorodezkaya IJ, Andreas K, Ravens U. Voltage-sensitive Ca2+ channels, intracellular Ca2+ stores and Ca2+-release-activated Ca2+ channels contribute to the ATP-induced [Ca2+]i increase in differentiated neuroblastoma x glioma NG 108-15 cells. Neuroscience Letters. 1999;264:97–100. doi: 10.1016/s0304-3940(99)00189-5. [DOI] [PubMed] [Google Scholar]
- Burnstock G. The past, present and future of purine nucleotides as signalling molecules. Neuropharmacology. 1997;36:1127–1139. doi: 10.1016/s0028-3908(97)00125-1. [DOI] [PubMed] [Google Scholar]
- Cheng H, Lederer MR, Lederer WJ, Cannell MB. Calcium sparks and [Ca2+]i waves in cardiac myocytes. American Journal of Physiology. 1996;270:C148–159. doi: 10.1152/ajpcell.1996.270.1.C148. [DOI] [PubMed] [Google Scholar]
- Coussin F, Macrez N, Morel JL, Mironneau J. Requirement of ryanodine receptor subtypes 1 and 2 for Ca2+-induced Ca2+ release in vascular myocytes. Journal of Biological Chemistry. 2000;275:9596–9603. doi: 10.1074/jbc.275.13.9596. [DOI] [PubMed] [Google Scholar]
- Erlinge D, Hou M, Webb TE, Barnard EA, Moller S. Phenotype changes of the vascular smooth muscle cell regulate P2 receptor expression as measured by quantitative RT-PCR. Biochemical and Biophysical Research Communications. 1998;248:864–870. doi: 10.1006/bbrc.1998.9083. [DOI] [PubMed] [Google Scholar]
- Fredholm BB, Abbracchio MP, Burnstock G, Dubyak GR, Harden TK, Jacobson KA, Schwabe U, Williams M. Towards a revised nomenclature for P1 and P2 receptors. Trends in Pharmacological Sciences. 1997;18:79–82. doi: 10.1016/s0165-6147(96)01038-3. [DOI] [PMC free article] [PubMed] [Google Scholar]
- Honoré E, Martin C, Mironneau C, Mironneau J. An ATP-sensitive conductance in cultured smooth muscle cells from pregnant rat myometrium. American Journal of Physiology. 1989;257:C297–305. doi: 10.1152/ajpcell.1989.257.2.C297. [DOI] [PubMed] [Google Scholar]
- Jeyakumar LH, Copello JA, O'Malley AM, Wu GM, Grassucci R, Wagenknecht T, Fleischer S. Purification and characterization of ryanodine receptor 3 from mammalian tissue. Journal of Biological Chemistry. 1998;273:16011–16020. doi: 10.1074/jbc.273.26.16011. [DOI] [PubMed] [Google Scholar]
- Kunapuli SP, Daniel JL. P2 receptor subtypes in the cardiovascular system. Biochemical Journal. 1998;336:513–523. doi: 10.1042/bj3360513. [DOI] [PMC free article] [PubMed] [Google Scholar]
- Leprêtre N, Mironneau J, Arnaudeau S, Tanfin Z, Harbon S, Guillon G, Ibarrondo J. Activation of alpha-1 adrenoceptors mobilizes calcium from the intracellular stores in myocytes from rat portal vein. Journal of Pharmacology and Experimental Therapeutics. 1994;268:167–174. [PubMed] [Google Scholar]
- Lewis CJ, Ennion SJ, Evans RJ. P2 purinoceptor-mediated control of rat cerebral (pial) microvasculature; contribution of P2X and P2Y receptors. Journal of Physiology. 2000;527:315–324. doi: 10.1111/j.1469-7793.2000.00315.x. [DOI] [PMC free article] [PubMed] [Google Scholar]
- Lewis CJ, Evans RJ. Comparison of P2X receptors in rat mesenteric, basilar and septal (coronary) arteries. Journal of the Autonomic Nervous System. 2000;81:69–74. doi: 10.1016/s0165-1838(00)00117-x. [DOI] [PubMed] [Google Scholar]
- Lipp P, Niggli E. A hierarchical concept of cellular and subcellular Ca2+-signalling. Progress in Biophysical and Molecular Biology. 1996;65:265–296. doi: 10.1016/s0079-6107(96)00014-4. [DOI] [PubMed] [Google Scholar]
- Lohn M, Furstenau M, Sagach V, Elger M, Schulze W, Luft FC, Haller H, Gollasch M. Ignition of calcium sparks in arterial and cardiac muscle through caveolae. Circulation Research. 2000;87:1034–1039. doi: 10.1161/01.res.87.11.1034. [DOI] [PubMed] [Google Scholar]
- Luo X, Zheng W, Yan M, Lee MG, Muallem S. Multiple functional P2X and P2Y receptors in the luminal and basolateral membranes of pancreatic duct cells. American Journal of Physiology. 1999;277:C205–215. doi: 10.1152/ajpcell.1999.277.2.C205. [DOI] [PubMed] [Google Scholar]
- Macrez-Leprêtre N, Kalkbrenner F, Schultz G, Mironneau J. Distinct functions of Gq and G11 proteins in coupling alpha1-adrenoreceptors to Ca2+ release and Ca2+ entry in rat portal vein myocytes. Journal of Biological Chemistry. 1997;272:5261–5268. doi: 10.1074/jbc.272.8.5261. [DOI] [PubMed] [Google Scholar]
- Mironneau J, Arnaudeau S, Macrez-Lepretre N, Boittin FX. Ca2+ sparks and Ca2+ waves activate different Ca2+-dependent ion channels in single myocytes from rat portal vein. Cell Calcium. 1996;20:153–160. doi: 10.1016/s0143-4160(96)90104-9. [DOI] [PubMed] [Google Scholar]
- Mironneau J, Coussin F, Jeyakumar LH, Fleischer S, Mironneau C, Macrez N. Contribution of ryanodine receptor subtype 3 to Ca2+ responses in Ca2+-overloaded cultured rat portal vein myocytes. Journal of Biological Chemistry. 2001;276:11257–11264. doi: 10.1074/jbc.M005994200. [DOI] [PubMed] [Google Scholar]
- Mulryan K, Gitterman DP, Lewis CJ, Vial C, Leckie BJ, Cobb AL, Brown JE, Conley EC, Buell G, Pritchard CA, Evans RJ. Reduced vas deferens contraction and male infertility in mice lacking P2X1 receptors. Nature. 2000;403:86–89. doi: 10.1038/47495. [DOI] [PubMed] [Google Scholar]
- Niggli E. Localised intracellular calcium signaling in muscle: calcium sparks and calcium quarks. Annual Review of Physiology. 1999;61:311–335. doi: 10.1146/annurev.physiol.61.1.311. [DOI] [PubMed] [Google Scholar]
- Nori S, Fumagalli L, Bo X, Bogdanov Y, Burnstock G. Coexpression of mRNAs for P2X1, P2X2 and P2X4 receptors in rat vascular smooth muscle: an in situ hybridisation and RT-PCR study. Journal of Vascular Research. 1998;35:179–185. doi: 10.1159/000025582. [DOI] [PubMed] [Google Scholar]
- North RA, Surprenant A. Pharmacology of cloned P2X receptors. Annual Review of Pharmacology and Toxicology. 2000;40:563–580. doi: 10.1146/annurev.pharmtox.40.1.563. [DOI] [PubMed] [Google Scholar]
- Nuttle LC, Dubyak GR. Differential activation of cation channels and non-selective pores by macrophage P2z purinergic receptors expressed in Xenopus oocytes. Journal of Biological Chemistry. 1994;269:13988–13996. [PubMed] [Google Scholar]
- Okamoto T, Schlegel A, Scherer PE, Lisanti MP. Caveolins, a family of scaffolding proteins for organizing ‘preassembled signaling complexes’ at the plasma membrane. Journal of Biological Chemistry. 1998;273:5419–5422. doi: 10.1074/jbc.273.10.5419. [DOI] [PubMed] [Google Scholar]
- Parton RG, Carozzi A, Gustavsson J. Caves and labyrinths: caveolae and transverse tubules in skeletal muscle. Protoplasma. 2000;212:15–23. [Google Scholar]
- Picello E, Pizzo P, Di Virgilio F. Chelation of cytoplasmic Ca2+ increases plasma membrane permeability in murine macrophages. Journal of Biological Chemistry. 1990;265:5635–5639. [PubMed] [Google Scholar]
- Pizzo P, Zanovello P, Bronte V, Di Virgilio F. Extracellular ATP causes lysis of mouse thymocytes and activates a plasma membrane ion channel. Biochemical Journal. 1991;274:139–144. doi: 10.1042/bj2740139. [DOI] [PMC free article] [PubMed] [Google Scholar]
- Ralevic V, Burnstock G. Receptors for purines and pyrimidines. Pharmacological Reviews. 1998;50:413–492. [PubMed] [Google Scholar]
- Schneider P, Hopp HH, Isenberg G. Ca2+ influx through ATP-gated channels increments [Ca2+]i and inactivates ICa in myocytes from guinea-pig urinary bladder. Journal of Physiology. 1991;440:479–496. doi: 10.1113/jphysiol.1991.sp018720. [DOI] [PMC free article] [PubMed] [Google Scholar]
- Shibuya I, Tanaka K, Hattori Y, Uezono Y, Harayama N, Noguchi J, Ueta Y, Izumi F, Yamashita H. Evidence that multiple P2X purinoceptors are functionally expressed in rat supraoptic neurones. Journal of Physiology. 1999;514:351–367. doi: 10.1111/j.1469-7793.1999.351ae.x. [DOI] [PMC free article] [PubMed] [Google Scholar]
- Vial C, Evans RJ. P2X receptor expression in mouse urinary bladder and the requirement of P2X1 receptors for functional P2X receptor responses in the mouse urinary bladder smooth muscle. British Journal of Pharmacology. 2000;131:1489–1495. doi: 10.1038/sj.bjp.0703720. [DOI] [PMC free article] [PubMed] [Google Scholar]
- Viard P, Exner T, Maier U, Mironneau J, Nurnberg B, Macrez N. Gβγ dimers stimulate vascular L-type Ca2+ channels via phosphoinositide 3-kinase. FASEB Journal. 1999;13:685–694. doi: 10.1096/fasebj.13.6.685. [DOI] [PubMed] [Google Scholar]
- Xu L, Lai FA, Cohn A, Etter E, Guerrero A, Fay FS, Meissner G. Evidence for a Ca2+-gated ryanodine-sensitive Ca2+ release channel in visceral smooth muscle. Proceedings of the National Academy of Sciences of the USA. 1994;91:3294–3298. doi: 10.1073/pnas.91.8.3294. [DOI] [PMC free article] [PubMed] [Google Scholar]
- Zou H, Lifshitz LM, Tuft RA, Fogarty KE, Singer JJ. Imaging Ca2+ entering the cytoplasm through a single opening of a plasma membrane cation channel. Journal of General Physiology. 1999;114:575–588. doi: 10.1085/jgp.114.4.575. [DOI] [PMC free article] [PubMed] [Google Scholar]