Abstract
At the crustacean neuromuscular junction, action potential-evoked neurosecretion increases in proportion to stimulation frequency, a process termed frequency facilitation. In the present study we examined how frequency facilitation is affected by osmotic pressure.
Hypertonic solution (HS) was applied by local superfusion of the synaptic area. Quantal release was monitored by focal extracellular recordings of postsynaptic potentials. Several stimulation frequencies (f) in the range from 1 to 10 Hz were employed, and quantal content (m) together with the number of releasable units (n) and release probability (p) was evaluated for each frequency.
Osmotic pressure enhanced quantal release at the lowest f tested (1 Hz) but suppressed neurosecretion at higher f (7–10 Hz). Thus, hyperosmolarity enhanced action potential-evoked release but suppressed frequency facilitation.
Chelation of intracellular calcium by BAPTA showed that the effect of HS was calcium independent.
Binomial analysis of quantal content revealed that HS suppressed the increase in the number of releasable units, which was very pronounced during facilitation under control conditions. Since HS also stimulated asynchronous quantal release, the observed effect of HS on facilitation can be explained by the depletion of the releasable pool of quanta caused by the asynchronous neurosecretion.
To test this hypothesis we increased the available pool of vesicles using serotonin and demonstrated that the suppressing effect of HS on facilitation was reversed.
The observed effects of HS on facilitated neurosecretion could be described quantitatively using our model for mobilization of vesicles into the releasable pool enhanced by action potentials.
Presynaptic facilitation is a dynamic and highly regulated process. Different mechanisms may account for the ability of a presynaptic terminal to enhance neurotransmitter release in response to repetitive stimulation of the nerve in proportion to stimulation frequency (frequency facilitation). An established mechanism for facilitation is an increase in free or bound calcium at the release sites (reviewed in Zucker, 1999). Another mechanism for synaptic enhancement may be the increase in the number of readily releasable vesicles (Hubbard, 1963; Maeno, 1969). It has been convincingly demonstrated at central synapses that the releasable pool of vesicles is an important determinant for synaptic plasticity (Stevens & Wang, 1995; Dobrunz & Stevens, 1997). Our own studies (Worden et al. 1997; Bykhovskaia et al. 1999, 2000) suggest that mobilization or priming of synaptic vesicles by action potentials (Stevens & Wesseling, 1998) should result in the increase in the releasable pool which can account quantitatively for facilitation.
One way to test if the releasable pool of quanta is a significant determinant of facilitation is to investigate how the depletion of the releasable pool would affect facilitation. Local superfusion of synapses by hypertonic solutions (HS) proved to be an efficient tool for the depletion and measurements of the releasable pool of quanta (Stevens & Tsujimoto, 1995; Rosemund & Stevens, 1996; Stevens & Wesseling, 1998).
Hypertonic solution increases the rate of miniature excitatory postsynaptic responses in the presence and absence of the nerve stimulation (Dudel & Kuffler, 1961; Hubbard et al. 1968; Van der Kloot & Kita, 1974; Kita & Van der Kloot, 1977; Kita et al. 1982; Stevens & Tsujamoto, 1995; Cheng & Miyamoto, 1999). Less consistent effects of HS have been reported for action potential- evoked release. At mammalian synapses, HS elicited an initial rise in the quantal content followed by a decrease to below control level (Hubbard et al. 1968; Rosemund & Stevens, 1996). In contrast, at the crayfish (Van der Kloot & Kita, 1974; Niles & Smith, 1982) and frog (Kita & Van der Kloot, 1977) neuromuscular junctions, HS decreased quantal content but did not affect paired-pulse facilitation (Kita & Van der Kloot, 1977). In the present study we examined how HS affects frequency facilitation at the lobster neuromuscular junction.
METHODS
Electrophysiology
In the isolated walking leg of the lobster (Homarus americanus) the innervation of the dactyl opener muscle from the propodite segment was exposed by removal of the overlying exoskeleton, muscle and connective tissue. A single excitatory axon was isolated from the propodite segment to the meropodite segment, where it runs a separate course from the inhibitory axon (Dudel & Kuffler, 1961). The preparation was bathed in physiological saline (mm): 462 NaCl, 16 KCl, 26 CaCl2, 8 MgCl2, 11 glucose and 5 Hepes buffer adjusted to pH 7.4; see Kravitz & Potter, 1965). The muscle was stretched to avoid contractions.
Presynaptic action potentials were elicited by suprathreshold electrical simulation of the single excitatory axon using a suction electrode. Stimulation frequencies (f) were varied in the range from 1 to 10 Hz to evoke pronounced facilitation but to avoid potentiation (Magelby & Zengel, 1982). Excitatory postsynaptic potentials (EPSPs) and miniature excitatory postsynaptic potentials (mEPSPs) were recorded extracellularly using saline-filled patch electrodes of 3–20 μm diameter. The recording electrode was positioned over the fine nerve branches and EPSPs were recorded focally in response to nerve stimulation (Dudel & Kuffler, 1961). We recorded EPSPs only from the sites located in the central region of the dactyl opener muscle, since these sites usually demonstrate lower quantal content and pronounced facilitation (Bittner, 1968; Thompson & Atwood, 1984; Cooper et al. 1996).
Recordings were acquired with 50 μs resolution using an Axoclamp-2A amplifier and pCLAMP6.0 (Axon Instruments) A/D converter and software. We used digital Gaussian filtering to reduce high-frequency noise (Colquhoun & Sigworth, 1983).
HS applications
Hypertonic solutions, HS, were obtained by adding sucrose (250, 500 or 1000 mm) to the physiological saline. To minimize the effect of osmotic pressure on the nerve action potential, HS was applied locally to the synaptic area (Fig. 1A and B). In different experiments we applied either local superfusion of the recording site (Fig. 1A) or internal perfusion of the recording pipette (Fig. 1B), since each technique had its own advantages and limitations.
Figure 1. Local applications of HS to the synaptic area.
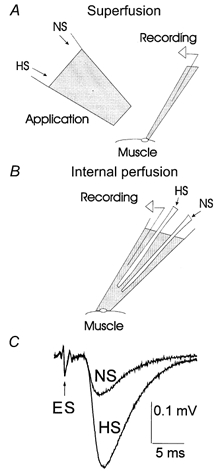
A, local superfusion of the synaptic area by HS or normal saline (NS) outside the recording pipette. The superfusion pipette was positioned within approximately 150–200 μm from the recording electrode. To avoid covering the synapse we used recording electrodes with a tip diameter of 3–5 μm. The tip diameter of the application pipette was 80 μm. B, solutions were changed inside the recording pipette of 10–20 μm tip diameter. C, the nerve extracellular spike (ES) was not affected by local applications of HS, while synaptic transmission was enhanced. Each trace represents the average of 600 EPSPs recorded at 1 Hz stimulation frequency.
The advantage of local superfusion (Fig. 1A) is that solutions may be exchanged quickly, and therefore the time course of HS action can be monitored. However, this technique is suitable only for rather brief applications (no more than 2 min), since longer applications cause occasional action potential failures. With this technique, we recorded synaptic activity while superfusing the same recording site either by normal physiological saline (NS) or by HS. Recordings were done with electrodes of small tip diameter (3–5 μm), which presumably recorded signals from the sites exposed to HS.
In contrast, with the internal perfusion of the recording pipette (Fig. 1B) recordings were made with electrodes of larger tip diameter (10–20 μm) in order to maximize the likelihood that HS reached the synaptic area. This technique enabled prolonged HS applications under steady-state conditions without affecting the shape of the action potential (Fig. 1C). We collected mEPSPs for 5 min, and then stimulated the axon at different frequencies. At each stimulation frequency we collected a dataset of 600 EPSPs after steady-state conditions were obtained (Worden et al. 1997). After physiological saline in the pipette was exchanged for HS, we monitored spontaneous synaptic activity until it reached a steady level and then repeated the above stimulation protocol. To make sure that the effect of HS on frequency facilitation was not caused by a change of synaptic activity with time, we alternated the order of stimulation frequencies.
BAPTA loading
To test if the HS effect is dependent on the concentration of intracellular Ca2+, we applied a Ca2+ chelator, BAPTA AM (Molecular Probes), the cell permeate form of BAPTA. BAPTA AM was kept frozen in DMSO at a stock concentration of 5 mm and added in 1 part to 99 parts to physiological saline to yield a concentration of 50 μm (Winslow et al. 1994; Tang et al. 2000).
In the preliminary experiments (data not shown) we found that in the first 5 min after adding 1 % DMSO to our preparation, the release increased by about 20 %. However, the quantal content returned approximately to the control level in the next 20 min. During BAPTA loading, the preparation was bathed in 1 % DMSO for 30–40 min before the control recording was started.
For the control, we collected 100 EPSPs at 1 and 10 Hz stimulation frequencies, and then repeated the same stimulation protocol with HS applied by local superfusion (Fig. 1A); all the solutions contained 1 % DMSO. Then bath solution was substituted by physiological saline containing 50 μm BAPTA AM and 1 % DMSO, and nerve terminals were loaded with BAPTA for 2 h. After the loading, the above experimental protocol was repeated.
Quantal analysis
We analysed a temporal interval of 75 ms following the extracellular spike (ES). Quantal latencies were measured from the negative peak of the ES (Katz & Miledi, 1965) to quantal peaks (Bykhovskaia et al. 1999). All the sweeps recorded under similar conditions (with the same solutions and stimulation frequency) were superimposed and averaged. In this average sweep the ES peak could be clearly detected (Fig. 1C). According to their latencies, quanta were classified as ‘phasic’ or ‘delayed’ (Fig. 2A). The phasic-release component decayed within 8 ms, while the delayed-release component did not decay during the temporal interval analysed (Fig. 2B). Phasic release was evaluated by quantal content of EPSPs (m), and delayed release was evaluated by frequency of mEPSPs.
Figure 2. Phasic and delayed release components.
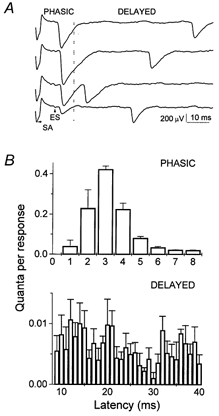
A, recordings showing phasic and delayed events. SA is a stimulus artifact; ES is an extracellular spike. B, quantal latency histogram from 600 EPSPs showing a phasic component which decays within 8 ms and a delayed component which does not decay. Data were collected with HS (500 mm sucrose) applied.
Two methods were employed for the evaluation of the quantal content m: direct counts (Del Castillo & Katz, 1954) and deconvolution (Vorobieva et al. 1999). At low-output synapses or at low stimulation frequencies, single quantal events could be discerned in EPSPs as peaks or inflections of the signal (Fig. 3A). However, at higher stimulation frequencies, quantal events at most synapses were not discernable. Indeed, phasic quanta usually had latencies from 2 to 6 ms, and therefore they were released within an interval of 4 ms. Since the temporal resolution of quantal detection is about 1 ms (Zucker 1973; Bykhovskaia et al. 1996), the method of direct counting underestimates m when four to five or more quanta are released in a trial (which is often the case at 10 Hz stimulation). Our approach to the problem was: (1) to count quantal events directly as inflections and peaks of EPSP traces using in-house software (Bykhovskaia et al. 1996); (2) to verify accuracy of the detection by comparing average sizes (integrated traces) of single, double and triple quantal responses (Fig. 3B); and (3) for those datasets with inaccurate direct counts, to calculate the distribution of m by deconvolution method (Vorobieva et al. 1999). Deconvolution of EPSPs requires the distribution of quantal sizes measured experimentally. In each experiment, the distribution of quantal sizes was constructed from single quantal responses recorded at a stimulation frequency of 1 Hz. This evaluation of quantal size is justified because at 1 Hz stimulation direct counts of quanta were found to be accurate in every experiment. To ascertain that quantal size did not change as we change stimulation frequencies, we collected a dataset of 600 EPSPs at f = 1 Hz both at the beginning of the recording and after all the stimulation frequencies had been delivered. Only those experiments were selected in which quantal size remained unchanged during the recording (Fig. 3C). Since quantal size can be affected by HS, we measured quantal sizes with and without HS separately.
Figure 3. Quantal analysis.
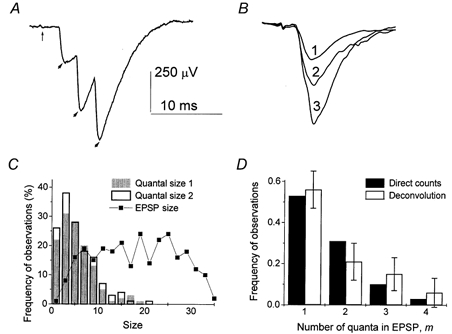
A, at a low-output synapse quantal events can be detected as peaks of EPSP. The vertical thin arrow points to the extracellular spike, and the thick arrows point to quantal peaks. B, averaged EPSPs with 1, 2 and 3 quantal events detected. The size (integrated trace) of the average double quantal EPSP is about 2 (1.8) times larger than the quantal size; the size of the average triple quantal EPSP is about 3 (2.7) times larger than the quantal size. These ratios confirm the correct quantal detection. Analysis of 600 EPSPs collected at 7 Hz stimulation frequency. C, distributions of EPSP sizes and quantal sizes used for calculation of m by deconvolution. The histograms of quantal sizes at the beginning (filled columns) and at the end (open columns) of the experiment are similar. D, at a low-output synapse distributions of quantal content m obtained by direct counts (filled columns) and by deconvolution (open columns) are in a good agreement. Analysis of 600 EPSPs collected at 10 Hz stimulation frequency. Error bars indicate confidence intervals for the calculated distribution.
At low-output synapses the results of direct counts and deconvolution were in good agreement (Fig. 3D)
Estimations for the number of releasable quanta n and the release probability p were obtained using binomial statistics. Binomial parameters were optimized by fitting theoretical and experimental distributions of m using χ2 minimisation (Smith et al. 1991; Bykhovskaia et al. 2000). We compared the fits obtained by uniform and non-uniform binomial statistics as described in Bykhovskaia et al. (2000). The non-uniform binomial model was preferred in those cases where it provided a better fit to the experimental data. Non-uniform binomial statistics gives the estimates for n and a release probability at each of n release sites. In this study, we examined only the average release probability: p = m/n.
RESULTS
HS elicited a large and reversible increase in the frequency of spontaneous quantal events at the lobster neuromuscular junction (Fig. 4). The frequency of minis was found to be maximal within the first 15 s after HS application. After this initial activity rise, the frequency of spontaneous events dropped to about 1 s−1 (about 5 times higher than the control level) and stayed at this steady level (Fig. 4C). In all the experiments described below we applied HS containing 500 mm sucrose, since this solution elicited a significant increase in spontaneous activity (Fig. 4B) and did not introduce any noticeable damage to the preparation.
Figure 4. HS enhances spontaneous neurosecretion.
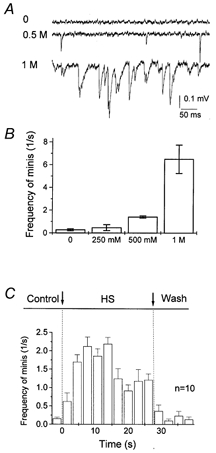
HS was applied using local superfusion technique (Fig. 1A). A, examples of recordings in normal saline (control) and with HS containing 0.5 and 1 m sucrose. B, frequency of spontaneous events under control conditions and with HS containing 250 mm, 500 mm and 1 m sucrose. mEPSPs were recorded for 2 min under control and for 30 s with HS. Data were collected from 7 recording sites. C, time course of mEPSP frequency after HS (500 mm sucrose) applications. The average of 10 applications from 5 recording sites.
HS reduces frequency facilitation in a calcium- independent manner
We examined how HS affects phasic and delayed components of action potential-evoked release and how this effect depends on stimulation frequency. Since facilitation decays in less than 1 s (Zucker, 1974), at a stimulation frequency of f = 1 Hz, quantal release can be considered as ‘unfacilitated’. The effect of HS on unfacilitated-evoked release was similar to its effect on spontaneous activity: when the axon was stimulated at 1 Hz, HS reversibly increased the average EPSP (Fig. 5A, Experiment 1). However, at 10 Hz stimulation the average EPSP was significantly decreased by HS (Fig. 5A, Experiment 1). Thus, the dependence of quantal content on stimulation frequency was less steep after HS was applied: osmotic pressure reversibly increased quantal content at 1 Hz stimulation frequency and reversibly decreased quantal content at higher stimulation frequencies (Fig. 5B, Experiment 1). Figure 5D shows the average data obtained from 15 recording sites, confirming that osmotic pressure reduced frequency facilitation. At the same time, HS substantially increased the delayed release component (Fig. 5C shows the data from Experiment 1, and Fig. 5E shows the average data from 15 experiments).
Figure 5. HS elicits delayed quantal release and suppresses frequency facilitation of rapid release.
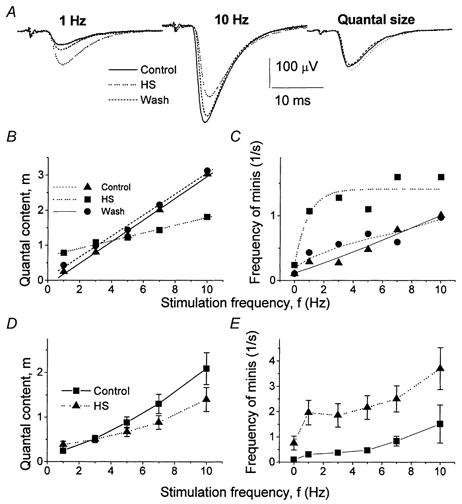
A, EPSPs recorded at 1 and 10 Hz stimulation frequencies with and without HS. Each trace is an average of 600 EPSPs. Quantal size represents the average of all single quantal responses recorded at 1 Hz. HS increased the response at f = 1 Hz and decreased the response at f = 10 Hz without changing the quantal size. B and D, effect of HS on quantal content of phasic responses. C and E, effect of HS on frequency of delayed events. A, B and C show the data from a representative experiment (Experiment 1). D and E show the data averaged from 15 experiments (in 7 experiments, frequencies were changed in the order 1, 3, 5, 7 and 10 Hz, and in the other 8 experiments frequencies were changed in the reversed order: 10, 7, 5, 3 and 1 Hz). HS (500 mm sucrose) was applied by perfusion of the recording pipette (Fig. 1B).
Since it was proposed that HS increases the intracellular calcium concentration (Shimoni et al. 1977; Delaney et al. 1991; Brosius et al. 1992), we investigated whether the effect of HS on facilitation depends on the concentration of intracellular calcium. Figure 6 clearly demonstrates that the effect of HS on frequency facilitation remained unchanged when intracellular Ca2+ was chelated with BAPTA. Chelation of Ca2+ significantly reduced quantal release (Fig. 6A) but did not change the HS/control ratio for the quantal content (Fig. 6B). The effect of Ca2+ chelation on the delayed release component was similar. The delayed release was reduced by about two times after BAPTA loading, but the HS/control ratio remained unchanged (7.0 ± 1.3 before BAPTA loading and 7.7 ± 2.7 after BAPTA loading).
Figure 6. The effect of HS on facilitation is independent of the concentration of intracellular Ca2+.
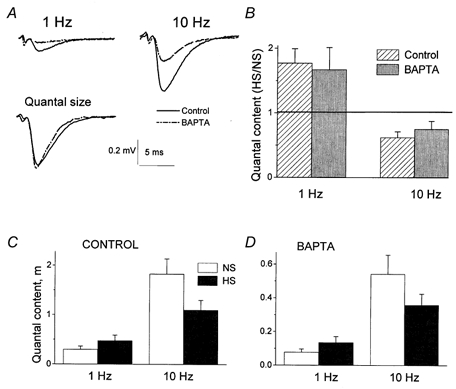
A, chelation of intracellular Ca2+ by BAPTA reduced transmitter release without affecting the quantal size. B, effect of HS on facilitation remained unchanged when intracellular Ca2+ was chelated by BAPTA. Columns represent the ratios between m with and without HS at the same recording site. The horizontal line indicates the level at which there would be no effect of HS (HS/NS = 1). C, effect of HS on facilitation with a physiological concentration of Ca2+. D, effect of HS on facilitation after intracellular Ca2+ was chelated by BAPTA. B, C and D show results from 8 experiments.
The effect of HS on quantal release at different stimulation frequencies was similar before (Fig. 6C) and after (Fig. 6D) BAPTA loading. In other words, BAPTA loading affected neither frequency facilitation, nor the HS/control ratio for the quantal content, even though it noticeably reduced both phasic- and delayed-quantal release. This would not have been the case if HS enhances delayed and unfacilitated phasic release by raising the intracellular Ca2+ concentration.
Thus, it is likely that HS acts through some Ca2+- independent mechanism, for example, by enhanced vesicle fusion with presynaptic membrane (Chanturiya et al. 1997) and depletion of the releasable pool of vesicles (Rosenmund & Stevens, 1996). Since facilitation is believed to arise from an increase in the releasable pool of quanta (Hubbard, 1963; Worden et al. 1997; Bykhovskaia et al. 1999, 2000), we expected that a reduction of the releasable pool would diminish facilitation. Our hypothesis was that at higher stimulation frequencies, priming and release of vesicles are close to equilibrium, and therefore most of the primed vesicles are released. In this case, HS would deplete the releasable pool and diminish phasic release by causing an extra release of some quanta in asynchronous mode. We tested this hypothesis in the following ways. First, we employed binomial analysis to estimate the increase in the number of releasable quanta, n, during facilitation and examined how the increase in n was affected by HS. Second, we examined the time course of transmitter release after HS application, since decay in quantal release can be a sign of the depletion of the releasable pool of vesicles (Rosenmund & Stevens, 1996). Third, we reasoned that if the depressant effect of HS is due to depletion of the releasable pool, then the HS effect should be reversed by serotonin (5-HT), since 5-HT increases the available pool of vesicles (Wang & Zucker, 1998). Therefore, we tested the reversibility of the depressant effect of HS on facilitated phasic release by 5-HT. Fourth, we tested the validity of the hypothesis that depletion of the releasable pool of vesicles can account for the effect of HS on facilitation quantitatively.
The increase in n during facilitation is suppressed by HS
Under control conditions, the distribution of m became broader, and the number of quanta observed in a trial became larger as f increased (Fig. 7A, Experiment 1). This broadening indicates that the number of releasable quanta increases (Fig. 7C, filled squares, Experiment 1). When HS was applied, the distribution of m remained narrow even though the average m was raised by frequency facilitation (Fig. 7B, Experiment 1). Accordingly, the increase in n with frequency facilitation was weaker (Fig. 7C, open triangles, Experiment 1). The data averaged from 15 experiments confirmed that during facilitation HS significantly suppressed the increase in n (Fig. 7E).
Figure 7. Effect of HS on changes in binomial parameters n and p during facilitation.
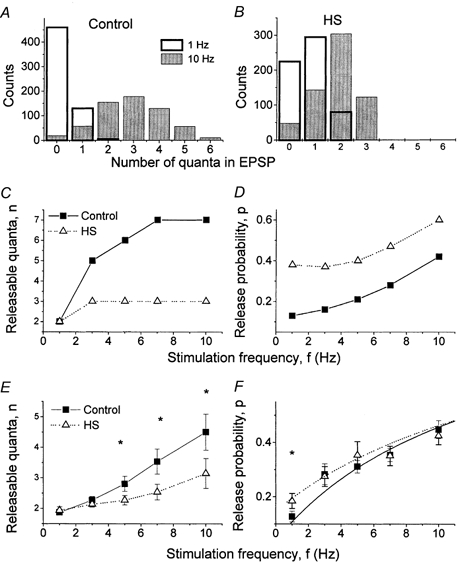
A, distribution of m broadened as stimulation frequency increased. B, this broadening was suppressed by HS. C and E, the number of releasable quanta, n, increased during frequency facilitation. This increase was suppressed by HS. D and F, HS increased release probability, p. at the lowest stimulation frequency, f = 1 Hz. C and D show the data from Experiment 1; E and F show the average from 15 experiments. * Significance at 5 %.
The increase in unfacilitated release produced by HS originated from the increase in the release probability p (Fig. 7D and F). This result is not surprising, since HS is known to enhance vesicle fusion.
After HS application, transmitter release decays during stimulation at 10 Hz, but remains at the steady level above control during stimulation at 1 Hz
It was suggested that the decay of EPSP size after HS application is a sign of the depletion of the releasable pool of vesicles (Rosenmund & Stevens, 1996). We monitored the time course of transmitter release after HS application at 1 and at 10 Hz stimulation frequency using local superfusion of the recording sites (Fig. 1A). We selected only low-output synapses in which direct quantal counts (Bykhovskaia et al. 1996) were reliable.
We observed the decay in quantal content when the axon was stimulated at 10 Hz, but not when it was stimulated at 1 Hz (Fig. 8). At 1 Hz stimulation frequency, action potential-evoked release remained at a steady level (Fig. 8B) for minutes after HS application. In contrast, in the absence of stimulation the initial rise in neurosecretion decayed within 10–20 s after HS application (Fig. 4C). This observation is consistent with the idea that action potentials replenish the supply of releasable vesicles (Hubbard, 1963; Worden et al. 1997; Stevens & Wesseling, 1998), which prevents the depletion of the releasable pool by HS during the repetitive stimulation of a nerve at f = 1 Hz (Fig. 5B). When the nerve was stimulated at 10 Hz, quantal content decreased after 15 s of HS application (Fig. 8), similar to the time course of spontaneous neurosecretion (Fig. 4C). This result is consistent with the hypothesis that the releasable pool of vesicles is depleted at 10 Hz stimulation but not at 1 Hz stimulation.
Figure 8. Time course of quantal content after HS application.
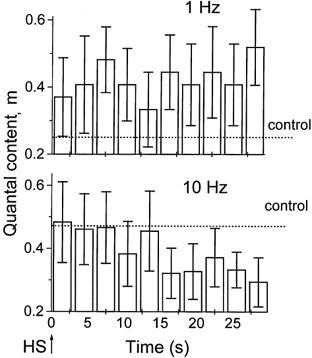
Each column represents m averaged over 3 s (3 EPSPs at 1 Hz and 30 EPSPs at 10 Hz). At 1 Hz stimulation m remained at a steady level above control. At 10 Hz stimulation m decayed and dropped below control. Data were collected from 9 recording sites at 1 Hz and from 6 recording sites at 10 Hz.
5-HT application reverses the depressing effect of HS at 10 Hz stimulation frequency
If the depressant effect of HS at 10 Hz stimulation frequency is caused by the depletion of the releasable pool of vesicles, then we would expect that 5-HT application would reverse this effect, since 5-HT has been shown to increase the available pool of vesicles (Wang & Zucker, 1998). Indeed the application of 5-HT (10 μm) to the bath solution reversed the depressant effect of osmotic pressure (Fig. 9).
Figure 9. Effect of 5-HT after HS application.
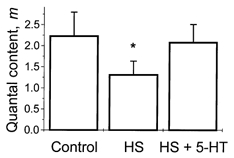
At 10 Hz stimulation frequency, HS application reduced quantal content, while application of 5-HT overcame this depressant effect. * Significant difference at 5 % level.
Model of vesicle activation describes quantitatively the effect of HS on frequency facilitation
To describe quantitatively the effect of HS on frequency facilitation, we employed our vesicle-activation model, which is based on the assumption that action potentials enhance not only fusion but also priming of synaptic vesicles. The model (Worden et al. 1997; Bykhovskaia et al. 2000) describes the dependence of m on stimulation frequency. According to this model, the number of releasable quanta n during repetitive stimulation at frequency f can be described by the equation (Worden et al. 1997, eqn (11)):
where ns is an average number of primed vesicles per action potential, km and kd are rate constants for vesicle priming and inactivation, respectively, in the absence of stimulation, S is the store of vesicles available for priming, and p0 is the rate of spontaneous (delayed) release per vesicle. This equation describes the balance of a pool of vesicles, which is supplied by priming and depleted by release and inactivation. Steady-state conditions (dn/dt = 0) provide us with the following solutions for n:
Since quantal content m equals np, the dependence of m on stimulation frequency will be given by:
The frequency of delayed releases (d) equals the number of releasable quanta remaining after the phasic release n (1 - p) times the probability of spontaneous release p0. Therefore, the rate of delayed release will be given by:
We assume that HS enhances vesicle fusion, in other words, that HS raises p and p0. Then from eqns (3) and (4) we can predict how HS affects frequency facilitation. Figure 10 demonstrates that the predicted trend coincides with the one observed experimentally: the dependence of m on f (frequency facilitation) was less steep with HS compared with control. The predicted effect of HS is to increase m when f = 1 Hz and to decrease m when f = 10 Hz, as we have observed experimentally (Fig. 10). It should be noted that at 10 Hz stimulation frequency, the observed effect of HS was slightly higher than predicted (Fig. 10). It is possible that HS somehow slows the rate of the vesicle docking and/or priming.
Figure 10. Theoretical prediction of frequency facilitation with and without HS.
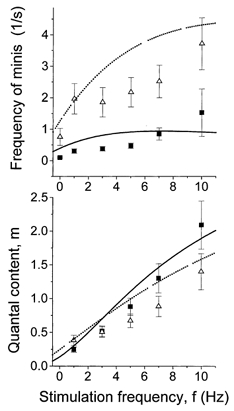
Dependencies of phasic and delayed release on f were calculated from eqns (3) and (4), respectively. Parameters ns = 3.7 and kmS = kd = 6.1 s−1, p0 = 0.5 s−1 under control and p0 = 3 s−1 with HS were obtained by fitting of the predicted (lines) and experimental (symbols) dependencies. Facilitation under control is denoted by continuous lines (predicted) and by ▪ (observed). Facilitation after HS application is denoted by dotted lines (predicted) and by ▴ (observed).
Thus, our model predicts that when f = 10 Hz the rates of priming and release of vesicles become close to each other, and hence extra release of vesicles in the delayed mode elicited by HS would deplete the releasable pool and decrease m below control level. This would not happen when f = 1 Hz, when p is low and the rate of priming significantly exceeds the rate of release, so most of the primed vesicles are not released but are inactivated. Under these conditions release of some of the quanta in the delayed mode would not significantly affect the releasable pool. If this is the case, the effect of HS on delayed release and on facilitation of rapid release should correlate in different experiments. Indeed, some correlation (r = 0.5) was observed between the effect of HS on phasic and delayed release (Fig. 11) in different experiments. In some experiments, however, the rate of delayed release was higher than would be expected from the correlation plot (Fig. 11). This could be explained by the hypothesis that vesicles available for release by an action potential constitute only a subpopulation of vesicles available for non-selective release by osmotic pressure (Rosenmund & Stevens, 1996).
Figure 11. Correlation between the reduction of rapid release and enhancement of delayed release by HS at 7 and 10 Hz stimulation.
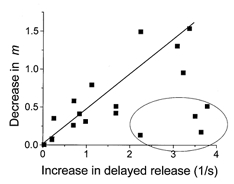
The effect was measured by the difference between the release with and without HS. The ellipse marks those experiments that showed a stronger effect on the delayed release than could be predicted from the correlation plot. The continuous line represents the linear regression. The marked points were not included in the regression analysis.
DISCUSSION
Hyperosmolarity enhances transmitter release but reduces facilitation
The major finding of our study is that at the crustacean neuromuscular synapse, osmotic pressure increases the number of synaptic vesicles released by an action potential in the absence of facilitation, but decreases the quantal content when facilitation is pronounced. This effect is coupled with noticeable enhancement of spontaneous and asynchronous transmitter release.
Osmotic pressure has been shown to increase m in different experimental preparations (Hubbard et al. 1968; Kita & Van der Kloot, 1977; Rosemund & Stevens, 1996). However, at the crustacean dactyl opener synapse, quantal content was reported to decrease in response to HS applications (Van der Kloot & Kita, 1974; Niles & Smith, 1982). One reason for the discrepancy between these studies and our results could be that in the previous studies (Van der Kloot & Kita, 1974) HS could have affected the action potential conduction of the axon, since it was added to the bath solution. In contrast, we applied HS locally by superfusing the synaptic area only, which minimized the deteriorating effect of HS on the action potential. Also, it is important to note that in previous studies (Niles & Smith, 1982), evoked release was monitored while stimulating the nerve at 2 Hz. Since stimulation at 2 Hz produces some facilitation, HS does not enhance evoked release at f = 2 Hz (Fig. 7). Thus, when applied locally to the synaptic area, osmotic pressure increases m in the absence of frequency facilitation (at f = 1 Hz).
It is still a matter of debate by which mechanism HS increases release probability. It was suggested that HS raises intracellular calcium concentration (Delaney et al. 1991; Brosius et al. 1992), or that it enhances the last step of exocytosis and releases primed vesicles independently of calcium (Quastel et al. 1971; Rosenmund & Stevens, 1996). Other possible mechanisms of HS effect have also been discussed (Kita & Van der Kloot, 1977).
The effect of hyperosmolarity is independent of the concentration of intracellular Ca2+
One explanation for the observed effect could be that HS enhances release probability by an increase of intracellular calcium concentration (Shimoni et al. 1977; Delaney et al. 1991; Brosius et al. 1992) either by affecting ion channels or by cell shrinkage. However, the question remains why HS does not increase quantal content at higher stimulation frequencies (3–10 Hz). One could argue that during repetitive stimulation at 10 Hz intracellular [Ca2+] greatly increases, and the Ca2+ molecular target becomes saturated, and therefore quantal release cannot be further raised. If this is the case, we would expect that when intracellular Ca2+ is chelated by BAPTA, HS would increase quantal release both at 1 and at 10 Hz stimulation frequency. However, even after BAPTA loading, HS increases release at 1 Hz stimulation but decreases release at 10 Hz stimulation (Fig. 6). This indicates that HS acts through a mechanism different from raising the intracellular Ca2+ concentration.
It is an interesting finding that frequency facilitation is not affected when intracellular Ca2+ is reduced (Fig. 7C and D). These results contrast with the observation that the growth of facilitation during trains of pulses is significantly reduced when intracellular Ca2+ is chelated (Tang et al. 2000 and authors’ unpublished data). Further experimentation is needed to understand the role of intracellular Ca2+ in different components of facilitation.
Hyperosmolarity enhances vesicle fusion and suppresses the increase in the releasable pool of vesicles during facilitation
Quantal analysis revealed that in the absence of facilitation, HS increases m by raising the release probability p. This finding is in agreement with the results obtained in the models, which clearly demonstrated that the membrane tension caused by osmotic pressure favours vesicle fusion in a simple mechanical way (Hagmann et al. 1992; Dai & Sheetz, 1995; Chanturiya et al. 1997; Chizmadshev et al. 2000). The question remains why HS suppresses transmitter release after a pronounced facilitation is elicited, namely, at 3–10 Hz stimulation frequency. It could be suggested that during repetitive stimulation HS activates some additional mechanism, which suppresses transmitter release. For example, HS could affect Ca2+ channels in their open state and thus reduce Ca2+ influx during stimulation at high frequencies (Brosius et al. 1992). However, it is worth considering a more parsimonious interpretation, namely that the increase and decrease of different release components caused by HS under different stimulation conditions are related to the same mechanism.
It was convincingly demonstrated that at hippocampal synapses HS can deplete the pool of vesicles available for action potential-evoked release (Stevens & Tsujimoto, 1995; Rosenmund & Stevens, 1996). One component of frequency facilitation is the increase in the number of quanta available for release, which can be estimated by a binomial parameter n (Wernig et al. 1972; Wojtowicz et al. 1994; Worden et al. 1997). Enhancing quantal fusion could diminish the number of releasable quanta, and hence, could suppress the increase in n observed during facilitation. That is exactly what we observe in our experiments at 3–10 Hz stimulation frequency when quantal fusion is enhanced by HS (Fig. 7C and E). It could then be predicted that an agent which increases the releasable pool of vesicles would reverse the suppressing effect of HS. Indeed, the effect of HS at 10 Hz stimulation is reversed by 5-HT, which was shown to increase the number of vesicles available for transmitter release (Wang & Zucker, 1998). Thus, we considered the model in which HS enhances quantal fusion and depletes the releasable pool of vesicles during facilitation.
Vesicle activation model explains the effect of osmotic pressure on facilitation
The model of the exchange between available and immediately releasable pools of vesicles was originally proposed by Elmqvist & Quastel (1968). This model incorporated vesicular mobilization, demobilization and release and was successful in explaining synaptic depression. In Quastel's model only release probability was enhanced by repetitive stimulation. It is clear, however, that such a model can only explain synaptic depression, while to explain presynaptic facilitation we need to postulate that the supply of releasable vesicles is enhanced by repetitive stimulation (Hubbard, 1963). Later experimental and modelling studies refined these original ideas, suggesting that vesicle priming and/or unpriming may correspond to binding and/or unbinding of some synaptic protein. Bennett & Robinson (1990) suggested that vesicle inactivation may correspond to caging by synapsin I. Another possibility is that vesicle priming corresponds to loss of Rab5 or to acquisition of Rab3A (Sudhof, 2000). Strong evidence exists that vesicle priming is enhanced by calcium entry into the nerve terminals (Stevens & Wesseling, 1998; Gomis et al. 1999). These latest findings provide a mechanism for the supply of vesicles in the releasable pool induced by repetitive action potentials. Based on these ideas, we developed a computational model for vesicle activation, inactivation and release. The model predicts quantitatively how the distribution of quantal content changes during facilitation (Worden et al. 1997; Bykhovskaia et al. 2000).
The essence of the model is that each action potential elicits vesicle priming or activation; therefore as we increase f and decrease the time interval between successive stimuli, fewer vesicles are inactivated between the stimuli, and thus the releasable pool increases. At the same time fusion probability also increases during facilitation, and at 10 Hz stimulation vesicle priming and release are close to equilibrium. Thus, at 10 Hz stimulation, HS depletes the releasable pool of vesicles by releasing its fraction in the asynchronous mode. The following results favour this explanation: (1) the effect of HS on facilitation is independent of Ca2+ concentration (Fig. 6); (2) the increase in m at 1 Hz stimulation is manifested as the increase in the release probability p, while the decrease in m at higher stimulation frequencies is manifested as the decrease in the number of releasable quanta n (Fig. 7); (3) the time course of evoked transmitter release after HS application indicates vesicle depletion at 10 Hz stimulation but not at 1 Hz stimulation (Fig. 8); (4) an agent which increases the releasable pool of vesicles (5-HT) also reverses the depressant effect of HS during facilitation (Fig. 9); and (5) the depletion model provides a reasonably good quantitative description for frequency facilitation of rapid and delayed release components with and without HS (Fig. 10).
Acknowledgments
This work was supported by NIH grant R01 MH61059 and by Jeffress Memorial Trust (to M.B.).
References
- Bennett MR, Robinson J. Probabilistic secretion of quanta from nerve terminals at synaptic sites on muscle cells: non-uniformity, autoinhibition and the binomial hypothesis. Proceedings of the Royal Society B. 1990;239:329–358. doi: 10.1098/rspb.1990.0020. [DOI] [PubMed] [Google Scholar]
- Bittner GD. Differentiation of nerve terminals in the crayfish opener muscle and its functional significance. Journal of General Physiology. 1968;51:731–758. doi: 10.1085/jgp.51.6.731. [DOI] [PMC free article] [PubMed] [Google Scholar]
- Brosius DC, Hackett JT, Tuttle JB. Ca2+-independent and Ca2+-dependent stimulation of quantal neurosecretion in avian ciliary ganglion neurons. Journal of Neurophysiology. 1992;68:1229–1233. doi: 10.1152/jn.1992.68.4.1229. [DOI] [PubMed] [Google Scholar]
- Bykhovskaia M, Worden MK, Hackett JT. An algorithm for high resolution detection of postsynaptic quantal events in extracellular records. Journal of Neuroscience Methods. 1996;65:173–182. doi: 10.1016/0165-0270(95)00158-1. [DOI] [PubMed] [Google Scholar]
- Bykhovskaia M, Worden MK, Hackett JT. Presynaptic facilitation: quantal analysis and simulations. Neurocomputing. 1999:26–27. 9–15. [Google Scholar]
- Bykhovskaia M, Worden MK, Hackett JT. Stochastic modeling of facilitated neurosecretion. Journal of Computational Neuroscience. 2000;8:113–126. doi: 10.1023/a:1008917130947. [DOI] [PubMed] [Google Scholar]
- Chanturiya A, Chernomordik LV, Zimmerberg J. Flickering fusion pores comparable to initial exocytotic pores occur in protein-free phospholipid bilayers. Proceedings of the National Academy of Sciences of the USA. 1997;94:14423–14428. doi: 10.1073/pnas.94.26.14423. [DOI] [PMC free article] [PubMed] [Google Scholar]
- Cheng H, Miyamoto MD. Effect of hypertonicity on augmentation and potentiation and on corresponding quantal parameters of transmitter release. Journal of Physiology. 1999;81:1428–1431. doi: 10.1152/jn.1999.81.3.1428. [DOI] [PubMed] [Google Scholar]
- Chizmadzhev YA, Kuzmin PI, Kumenko DA, Zimmerberg J, Cohen FS. Dynamics of fusion pores connecting membranes of different tensions. Biophysical Journal. 2000;78:2241–2256. doi: 10.1016/S0006-3495(00)76771-3. [DOI] [PMC free article] [PubMed] [Google Scholar]
- Colquhoun D, Sigworth FJ. Fitting and statistical analysis of single channel records. In: Sakmann V, Neher V, editors. Single Channel Recordings. New York: Plenum Press; 1983. pp. 191–197. [Google Scholar]
- Cooper RL, Harrington CC, Martin L, Atwood HL. Quantal release at visualized terminals of a crayfish motor axon: intraterminal and regional differences. Journal of Comparative Neurology. 1996;375:583–600. doi: 10.1002/(SICI)1096-9861(19961125)375:4<583::AID-CNE3>3.0.CO;2-Y. [DOI] [PubMed] [Google Scholar]
- Dai J, Sheetz MP. Regulation of endocytosis, exocytosis and shape by membrane tension. Cold Spring Harbor Symposia on Quantitative Biology. 1995;60:567–671. doi: 10.1101/sqb.1995.060.01.060. [DOI] [PubMed] [Google Scholar]
- Del Castillo J, Katz B. Quantal components of the end-plate potential. Journal of Physiology. 1954;124:560–573. doi: 10.1113/jphysiol.1954.sp005129. [DOI] [PMC free article] [PubMed] [Google Scholar]
- Delaney K, Tank DW, Zucker RS. Presynaptic calcium and serotonin-mediated enhancement of transmitter release at crayfish neuromuscular junction. Journal of Neuroscience. 1991;11:2631–2643. doi: 10.1523/JNEUROSCI.11-09-02631.1991. [DOI] [PMC free article] [PubMed] [Google Scholar]
- Dobrunz LE, Stevens CF. Heterogeneity of release probability, facilitation, and depletion at central synapses. Neuron. 1997;18:995–1008. doi: 10.1016/s0896-6273(00)80338-4. [DOI] [PubMed] [Google Scholar]
- Dudel J, Kuffler SW. Mechanism of facilitation at the crayfish neuromuscular junction. Journal of Physiology. 1961;155:530–542. doi: 10.1113/jphysiol.1961.sp006645. [DOI] [PMC free article] [PubMed] [Google Scholar]
- Elmqvist D, Quastel DMJ. A quantitative study of end-plate potentials in isolated human muscle. Journal of Physiology. 1965;178:505–529. doi: 10.1113/jphysiol.1965.sp007639. [DOI] [PMC free article] [PubMed] [Google Scholar]
- Gomis A, Burrone J, Lagnado L. Two actions of calcium regulate the supply of releasable vesicles at the ribbon synapse of retinal bipolar cells. Journal of Neuroscience. 1999;19:6309–6317. doi: 10.1523/JNEUROSCI.19-15-06309.1999. [DOI] [PMC free article] [PubMed] [Google Scholar]
- Hubbard JI. Repetitive stimulation at the mammalian neuromuscular junction, and the mobilization of transmitter. Journal of Physiology. 1963;169:641–662. doi: 10.1113/jphysiol.1963.sp007286. [DOI] [PMC free article] [PubMed] [Google Scholar]
- Hubbard JI, Jones SF, Landau EM. An examination of the effects of osmotic pressure changes upon transmitter release from mammalian motor nerve terminals. Journal of Physiology. 1968;97:639–657. doi: 10.1113/jphysiol.1968.sp008579. [DOI] [PMC free article] [PubMed] [Google Scholar]
- Hagmann J, Dagan D, Burger MM. Release of endosomal content induced by plasma membrane tension: Video image intensification time lapse analysis. Experimental Cell Research. 1992;198:298–304. doi: 10.1016/0014-4827(92)90383-j. [DOI] [PubMed] [Google Scholar]
- Katz B, Miledi R. The measurement of synaptic delay, and the time-course of acetylcholine release at the neuromuscular junction. Proceeding of the Royal Society B. 1965;161:483–495. doi: 10.1098/rspb.1965.0016. [DOI] [PubMed] [Google Scholar]
- Kita H, Narita K, Van der Kloot W. The relation between tonicity and impulse-evoked transmitter release in the frog. Journal of Physiology. 1982;325:213–222. doi: 10.1113/jphysiol.1982.sp014146. [DOI] [PMC free article] [PubMed] [Google Scholar]
- Kita H, Van der Kloot W. Time course and magnitude of effects of changes in tonicity on acetylcholine release at frog neuromuscular junction. Journal of Neurophysiology. 1977;40:212–224. doi: 10.1152/jn.1977.40.2.212. [DOI] [PubMed] [Google Scholar]
- Kravitz EA, Potter DD. A further study of the distribution of γ-aminobutiric acid between excitatory and inhibitory axons of the lobster. Journal of Neurochemistry. 1965;12:323–328. doi: 10.1111/j.1471-4159.1965.tb06768.x. [DOI] [PubMed] [Google Scholar]
- Maeno T. Analysis of mobilization and demobilization processes in neuromuscular transmission in the frog. Journal of Neurophysiology. 1969;32:793–800. doi: 10.1152/jn.1969.32.5.793. [DOI] [PubMed] [Google Scholar]
- Magleby KL, Zengel JE. A quantitative description of stimulation-induced changes in transmitter release at the frog neuromuscular junction. Journal of General Physiology. 1982;80:613–638. doi: 10.1085/jgp.80.4.613. [DOI] [PMC free article] [PubMed] [Google Scholar]
- Niles W, Smith DO. Effects of hypertonic solutions on quantal transmitter release at the crayfish neuromuscular junction. Journal of Physiology. 1982;329:185–202. doi: 10.1113/jphysiol.1982.sp014297. [DOI] [PMC free article] [PubMed] [Google Scholar]
- Quastel DMJ, Hackett JT, Cooke JD. Calcium: Is it required for transmitter secretion? Science. 1971;172:1034–1036. doi: 10.1126/science.172.3987.1034. [DOI] [PubMed] [Google Scholar]
- Rosenmund C, Stevens CF. Definition of the readily releasable pool of vesicles at hippocampal synapses. Neuron. 1996;16:1197–1207. doi: 10.1016/s0896-6273(00)80146-4. [DOI] [PubMed] [Google Scholar]
- Shimoni Y, Alnaes E, Rahamimoff R. Is hypertonic neurosecretion from motor-nerve endings a calcium-dependent process? Nature. 1977;267:170–172. doi: 10.1038/267170a0. [DOI] [PubMed] [Google Scholar]
- Smith BR, Wojtowicz JM, Atwood HL. Maximum likelihood estimation of non-uniform transmitter release probabilities at the crayfish neuromuscular junction. Journal of Theoretical Biology. 1991;150:457–472. doi: 10.1016/s0022-5193(05)80440-0. [DOI] [PubMed] [Google Scholar]
- Stevens CF, Tsujimoto T. Estimates for the pool size of releasable quanta at a single central synapse and for the time required to refill the pool. Proceedings of the National Academy of Sciences of the USA. 1995;92:846–849. doi: 10.1073/pnas.92.3.846. [DOI] [PMC free article] [PubMed] [Google Scholar]
- Stevens CF, Wang Y. Facilitation and depression at single central synapse. Neuron. 1995;14:795–802. doi: 10.1016/0896-6273(95)90223-6. [DOI] [PubMed] [Google Scholar]
- Stevens CF, Wesseling JF. Activity-dependent modulation of the rate at which synaptic vesicles become available to undergo exocytosis. Neuron. 1998;21:415–424. doi: 10.1016/s0896-6273(00)80550-4. [DOI] [PubMed] [Google Scholar]
- Sudhof TC. The synaptic vesicle cycle revisited. Neuron. 2000;28:317–320. doi: 10.1016/s0896-6273(00)00109-4. [DOI] [PubMed] [Google Scholar]
- Tang Y, Schlumpberger TS, Kim T, Lueker M, Zucker RS. Effects of mobile buffers on facilitation: experimental and computational studies. Biophysical Journal. 2000;78:2735–2751. doi: 10.1016/s0006-3495(00)76819-6. [DOI] [PMC free article] [PubMed] [Google Scholar]
- Thompson CS, Atwood HL. Synaptic strength and horseradish uptake in crayfish nerve terminals. Journal of Neurocytology. 1984;13:267–280. doi: 10.1007/BF01148119. [DOI] [PubMed] [Google Scholar]
- Van der Kloot W, Kita H. The quantal release of transmitters at two neuromuscular junctions in the crayfish. Journal of Comparative Physiology. 1974;91:111–125. [Google Scholar]
- Vorobieva ON, Hackett JT, Worden MK, Bykhovskaia M. Evaluation of quantal neurosecretion from evoked and miniature postsynaptic responses by deconvolution method. Journal of Neuroscience Methods. 1999;92:91–99. doi: 10.1016/s0165-0270(99)00101-6. [DOI] [PubMed] [Google Scholar]
- Wang C, Zucker RS. Regulation of synaptic vesicle recycling by calcium and serotonin. Neuron. 1998;21:155–167. doi: 10.1016/s0896-6273(00)80523-1. [DOI] [PubMed] [Google Scholar]
- Wernig A. Changes in statistical parameters during facilitation at the crayfish neuromuscular junction. Journal of Physiology. 1972;226:751–759. doi: 10.1113/jphysiol.1972.sp010007. [DOI] [PMC free article] [PubMed] [Google Scholar]
- Winslow JL, Duffy SN, Charlton MP. Homosynaptic facilitation of transmitter release in crayfish is not affected by mobile chelators: implications for the residual ionized calcium hypothesis from electrophysiological and computational analysis. Journal of Neurophysiology. 1994;72:1769–1793. doi: 10.1152/jn.1994.72.4.1769. [DOI] [PubMed] [Google Scholar]
- Wojtowicz JM, Marin L, Atwood HL. Activity-induced changes in synaptic release sites at the crayfish neuromuscular junction. Journal of Neuroscience. 1994;14:3688–3703. doi: 10.1523/JNEUROSCI.14-06-03688.1994. [DOI] [PMC free article] [PubMed] [Google Scholar]
- Worden MK, Bykhovskaia M, Hackett JT. Facilitation at the lobster neuromuscular junction: A stimulus dependent mobilization model. Journal of Neurophysiology. 1997;78:417–428. doi: 10.1152/jn.1997.78.1.417. [DOI] [PubMed] [Google Scholar]
- Zucker RS. Changes in the statistics of transmitter release during facilitation. Journal of Physiology. 1973;229:787–810. doi: 10.1113/jphysiol.1973.sp010167. [DOI] [PMC free article] [PubMed] [Google Scholar]
- Zucker RS. Characteristics of crayfish neuromuscular facilitation and their calcium dependence. Journal of Physiology. 1974;241:91–110. doi: 10.1113/jphysiol.1974.sp010642. [DOI] [PMC free article] [PubMed] [Google Scholar]
- Zucker RS. Calcium- and activity-dependent synaptic plasticity. Current Opinion in Neurobiology. 1999;9:305–313. doi: 10.1016/s0959-4388(99)80045-2. [DOI] [PubMed] [Google Scholar]


