

Abstract
A prior bout of high-intensity square-wave exercise can increase the temporal adaptation of pulmonary oxygen uptake (
 ) to a subsequent bout of high-intensity exercise. The mechanisms controlling this adaptation, however, are poorly understood.
We therefore determined the dynamics of intramuscular [phosphocreatine] ([PCr]) simultaneously with those of
in seven males who performed two consecutive bouts of high-intensity square-wave, knee-extensor exercise in the prone position for 6 min with a 6 min rest interval. A magnetic resonance spectroscopy (MRS) transmit-receive surface coil under the quadriceps muscle allowed estimation of [PCr]; was measured breath-by-breath using a custom-designed turbine and a mass spectrometer system.The
kinetics of the second exercise bout were altered compared with the first such that (a) not only was the instantaneous rate of change (at a given level of ) greater but the phase II τ was also reduced – averaging 46.6 ± 6.0 s (bout 1) and 40.7 ± 8.4 s (bout 2) (mean ± s.d.) and (b) the magnitude of the later slow component was reduced.This was associated with a reduction of, on average, 16.1 % in the total exercise-induced [PCr] decrement over the 6 min of the exercise, of which 4.0 % was due to a reduction in the slow component of [PCr]. There was no discernable alteration in the initial rate of [PCr] change. The prior exercise, therefore, changed the multi-compartment behaviour towards that of functionally first-order dynamics.
These observations demonstrate that the
responses relative to the work rate input for high-intensity exercise are non-linear, as are, it appears, the putative phosphate-linked controllers for which [PCr] serves as a surrogate.
The dynamics of the pulmonary oxygen uptake () response to muscular exercise are a crucial determinant of exercise tolerance. The mean response time (τ‘) of the increase during the transient and the asymptotic increment  are both determinants of the oxygen deficit and, hence, of the potential requirement for anaerobiosis to supplement the ongoing aerobic component of the energy transfer for muscle contraction. During ‘moderate-intensity’ square-wave cycle ergometer exercise (i.e. for work rates below the lactate threshold, θL) the response approaches the new steady state with an exponential time course, after a short delay-like period (phase I, e.g. Hughson & Morrissey, 1982; Whipp et al. 1982). The subsequent time constant of this fundamental or phase II component (τ) has been proposed to reflect that of O2 consumption in the exercising muscle (
 ) (Barstow et al. 1990; Grassi et al. 1996; Rossiter et al. 1999). The phase II kinetics in this work rate range are commonly considered to be determined by intramuscular enzyme kinetics (e.g. Chance et al. 1985; Meyer, 1988). However, an alternative proposition argues for the mediation of through the rate of oxygen delivery to the exercising muscle (Hughson et al. 1993; MacDonald et al. 1997).
At higher work rates, that result in a sustained increase of arterial blood [lactate], kinetics become more complex, displaying time- and amplitude-based non-linearities (Whipp & Wasserman, 1972; Linarsson, 1974). This reflects the emergence of an additional delayed ‘slow component’ of . In the ‘heavy-intensity’ domain, characterised by increased levels of arterial lactate that eventually stabilise or even decrease slightly, the steady-state ‘gain’ (i.e.  ) exceeds that for the sub-θL domain (Whipp & Mahler, 1980; Paterson & Whipp, 1991; Barstow & Molé, 1991). For higher (i.e. ‘very heavy’ or ‘severe’ intensity) work rates, [lactate] continues to rise throughout the exercise and is set on a trajectory to the maximum (μ), with fatigue ensuing rapidly after its attainment (Whipp & Wasserman, 1972; Linarsson, 1974; Poole et al. 1994).
These non-linearities in the supra-θL kinetics have been shown not to be immutable. That is, they can be reduced by a similar ‘conditioning’ bout of supra-θL exercise (Gausche et al. 1989; Gerbino et al. 1996; MacDonald et al. 1997). This is accompanied by a reduced increment of metabolic acidaemia, together with an attenuated and slowed pulmonary CO2 output  response (Gausche et al. 1989; Gerbino et al. 1996). Speeding of these kinetics has also been demonstrated when the supra-θL conditioning bout involves other muscle groups (i.e. ‘conditioning’ cycling with a prior bout of arm cranking: Bohnert et al. 1998), or when performed with an increased inspired oxygen fraction (MacDonald et al. 1997). It has been suggested, therefore, that the dynamics of oxygen flow to the exercising tissues may be of critical importance at higher intensities (MacDonald et al. 1997; Bohnert et al. 1998). This, coupled with the inability to similarly modulate sub-θL kinetics (e.g. Gerbino et al. 1996; MacDonald et al. 1997; Grassi et al. 1998), reflects a shift from linear to non-linear control dynamics in the higher-intensity domains.
The mechanisms of this dynamic speeding of the response to high-intensity exercise are poorly understood, however. By establishing the concurrent dynamics of both the and intramuscular phosphocreatine ([PCr]) responses by 31P-magnetic resonance spectroscopy (31P-MRS), we wished to establish: (a) the extent to which the phase II and slow components of the kinetics contributed to the measured speeding and (b) whether corresponding changes were manifest in the dynamics of the intramuscular high-energy phosphate pool, consistent with suggestions of a linear [PCr]-related control of muscle respiration during exercise (Meyer, 1988).
METHODS
Seven healthy male volunteers with an average age of 27 years (range 20–59 years) provided informed consent (as approved by the Local Research Ethics Committee for Human Experimentation, in accordance with the Declaration of Helsinki) to participate in the study, and were cleared to exercise inside the bore of the MR scanner. Each subject initially performed a preliminary series of habituation tests in the Laboratory of Human Physiology in the same prone position and using the same ergometer (see below) as that used for the magnetic resonance studies. This allowed both (a) subject familiarisation and (b) selection of the high-intensity work rate for the subsequent 31P-MRS experiments, i.e. one associated with a slow phase of kinetics (e.g. Barstow & Molé, 1991; Paterson & Whipp, 1991) and that caused the subject to fatigue after ∼10 min.
For the subsequent 31P-MRS tests, the subjects lay prone inside the bore of the scanner with their feet suspended in rubber stirrups that formed an integral part of a custom-designed, plastic insert into the magnet bore (Whipp et al. 1999). Rhythmic alternate-leg knee extensions of constant excursion (i.e. the ∼30 cm vertical magnet bore diameter) and frequency (32 pulses min−1 for each leg, in response to an audible cue) were performed against stirrups of appropriate elastance to yield the required work rate (Whipp et al. 1999). Work rate approximations  were determined as the product of the amplitude of the leg excursion, measured at the level of the dorsum of the extended foot, the frequency of deflection and the elastic coefficient of the rubber stirrups; these ranged between 50 and 120 W across subjects. The cue was synchronised so that the contraction phase of the knee extensors of the non-dominant leg occurred in unison with the 31P-MRS interrogation of the quadriceps of the relaxed dominant leg. In order to minimise any extraneous movement, the subject was ‘strapped down’ to the scanner table by means of a non-distensible strap placed over the hips.
Subjects performed between two and five repeats (each on a different day) of a continuous high-intensity double square-wave exercise protocol consisting of: rest (4 min), bout 1 of high-intensity exercise at the pre-determined level (6 min), rest (6 min), bout 2 of high-intensity exercise (6 min) and rest (6 min). The number of repeats required for each subject was governed by the extent to which increasing test repeats improved the overall signal-to-noise characteristics of the averaged and [PCr] responses, allowing appropriate convergence and confidence limits (Rossiter et al. 2000) for the subsequent parameter estimation procedures.
Estimation of intramuscular high-energy phosphate concentrations
A one-pulse 31P-MRS acquisition from a 1.5 T super-conducting magnet (Signa Advantage, GE, Milwake, WI, USA) was employed. A surface coil (8 inch transmit and 5 inch receive), tuned to a frequency of 25.85 MHz for phosphorus, was placed under the quadriceps muscle of the dominant leg (in all cases the right leg) midway between the knee and hip joint (Rossiter et al. 1999). The coil was securely fastened to the table and displacement of the leg over the coil was prevented by a broad non-elastic strap over the hips, thus ensuring that during the knee-extensor exercise the region of interest (ROI) was always stationary when the leg was relaxed.
Prior to the data acquisition, a series of axial gradient recall echo images of the thigh were acquired in order to optimise the radio frequency (RF) coil position. Shimming was performed, using an automated shimming package provided by the manufacturers, to the proton signal of muscle water, allowing the homogeneity of the magnetic field to be optimised for the muscle ROI in its stationary position. The 31P-RF excitation pulse was set at a level to give maximum [PCr] signals at a 5 s repetition rate from an 80 mm thick axial slice of muscle. Free induction decays for 31P spectra were collected every 1875 ms throughout the entire repeated square-wave exercise test protocol with a spectral width of 2500 Hz and 512 data points. 31P-MRS data were averaged over eight acquisitions (a 31P spectrum every 15 s) to provide the dynamic signals for the three ATP peaks (α, β and γ), PCr and Pi every 15 s throughout. This maximised the signal-to-noise ratio of the spectra and the time resolution of the acquired data. Signal intensities of each resonance were calculated (as a batch job) by means of the time-domain variable-projection fitting program, VARPRO (van der Veen et al. 1988), using the appropriate prior knowledge of the ATP multiplets (Stubbs et al. 1996). The T1 saturation factor was assumed to remain constant for each resonance throughout the experiment.
Measurement of pulmonary gas exchange
Simultaneously with the phosphate metabolite determination, was determined breath-by-breath (Clinical and Scientific Equipment (CaSE), Gillingham, Kent, UK) using the algorithms of Beaver et al. (1973), as previously described by Whipp et al. (1999). Expired volume was measured by a volume measuring module with a non-magnetic turbine with stainless steel mountings and extended interface cable (Interface Associates, Laguna Niguel, CA, USA), and calibrated with a 3 l syringe (Hans Rudolph, Kansas City, MO, USA) over a range of flows which extended beyond the values achieved during exercise. The concentrations of respired gas (O2, CO2 and N2) were measured every 20 ms using a quadrupole mass spectrometer (QP9000, CaSE) calibrated against precision-analysed gas mixtures. Gas was drawn continuously from the mouthpiece along the extended 45 ft sampling capillary line, which had a 5–95 % rise time of < 80 ms and a transit delay of 1900 ms (Whipp et al. 1999).
Estimation of [PCr] kinetics
The areas of the three ATP, the Pi and PCr peaks were established from the spectrum series (Fig. 1) using the VARPRO fitting program. The [PCr] data were converted to relative changes from the initial resting baseline (%Δ), the average of the initial resting control phase being taken as 100 %. The [PCr] data for each test were time-aligned, with the onset of bout 1 being taken as time zero and that of bout 2 corresponding to t = 720 s. Occasional data points that lay beyond four standard deviations of the local mean were assumed to represent non-Gaussian ‘noise’ (Rossiter et al. 2000) and deleted, after having first being rechecked by re-running the VARPRO fitting program with the spectrum in question as a single task. The [PCr] responses for each test were then interpolated on a second-by-second basis to allow the subsequent superimposition and averaging of the responses from repeat tests, thus providing a 15 s average response for each of the subjects.
Figure 1. An example of a ‘stack plot’ of the time-sequence spectra during a high-intensity rest- exercise-rest-exercise-rest protocol (subject 1).
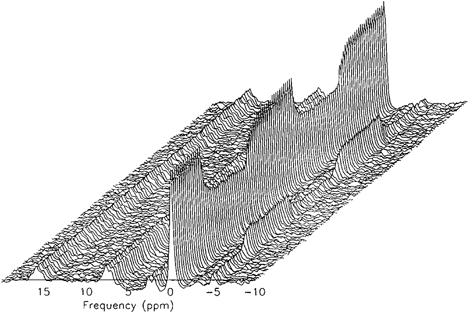
[PCr], 0 p.p.m.; [Pi], −5 p.p.m.; γ, α and β[ATP], approximately 2.5, 7.5 and 16 p.p.m.
The [PCr] response to the on-transient of each square-wave exercise bout was modelled as a mono-exponential decline from prior resting baseline:
where PCr0 is the value of [PCr] at t = 0, and ΔPCrss is the asymptotic decremental value below PCr0 to which [PCr] projects, τ is the time constant of the response and δ is a delay. The [PCr] response profiles were fitted with a non-linear least-squares regression using commercially available software (Origin, Microcal Software Inc., USA). The confidence limits for the parameter estimation (Rossiter et al. 2000) and the χ2 value were also obtained; confidence was set at 95 % and tolerance at 5 % (i.e. P≤ 0.05).
Two fitting strategies were used. For the first (model A), the entire exercise on-transient [PCr] response for bout 1 or bout 2 was included in the fitted region (i.e. from time zero to the end of the 6 min exercise phase). As the estimated δ value was not significantly different from zero in all cases (i.e. δ varied by less than ± 5 s) and as the decline in [PCr] was expected to start at exercise onset (Kemp et al. 1994), δ was subsequently constrained to 0 s (bout 1) or 720 s (bout 2).
The second fitting strategy (model B) was designed to identify, a posteriori, the onset of a putative delayed ‘slow component’ in the [PCr] response (cf. ). The entire 6 min [PCr] response was, therefore, not automatically included in the data field for the fit. Rather, the fitting window extended from exercise onset (i.e. t = 0 s for bout 1; t = 720 s for bout 2) initially only 60 s into the exercise. The window was lengthened iteratively, until the model fit demonstrated a discernible departure from the measured [PCr] response profile. However, as the goodness-of-fit cannot be extracted using the approach of Lamarra et al. (1987), two alternative indices were used: (a) the flat profile of the residual plot (i.e. signifying a good fit to measured data) being no longer sustained (e.g. Fig. 2), as judged by visual inspection and (b) the demonstration of a local ‘threshold’ in the χ2 value.
Figure 2. The relative concentrations of [PCr] during repeated high-intensity exercise in subject 1.
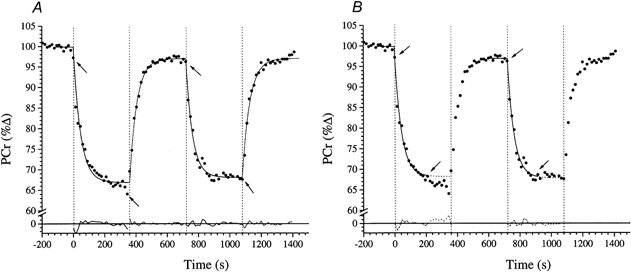
A is fitted with model A (i.e. the whole 360 s response is fitted with a single exponential). B shows the fit to the same data using the model B a posteriori approach (see text) to identify the exponential region. The arrows indicate the ‘fitting window’. The residuals to the fitted responses are shown below.
Estimation of kinetics
The corresponding responses were initially treated similarly to those of [PCr]. Each data set was edited, as described by Rossiter et al. (2000), with Gaussian distribution characteristics being assumed (Lamarra et al. 1987; Rossiter et al. 2000). Thus, the response for each test was interpolated on a second-by-second basis, to allow subsequent superimposition and averaging (10 s) of responses from repeat tests for each of the subjects.
The phase II response to each square-wave on-transient was initially modelled as a mono-exponential increase (model A), beginning after the ‘cardiodynamic’ or phase I region (Whipp et al. 1982) (i.e. approximately 20 s after exercise onset):
where  is the value of at t = 0, is the asymptotic value to which is assumed to project, τ is the time constant of the response and δ is a delay term similar to (but not equal to) the phase I-phase II transition time (Whipp et al. 1982; Whipp & Ozyener, 1998).
The second (model B) fitting procedure is described above for [PCr] and the same methodology was followed for . That is, the fitting field was varied in time where phase I - phase II ≤t = t2 and t2 is a value of t 10 s before the residual of the fit systematically differs from zero. The confidence limits for parameter estimation of are obtained in the same fashion as those for [PCr] (see above).
The magnitude of the slow component for both and [PCr] was measured from the phase II steady-state amplitude (i.e. and Δ[PCr]ss from model B) and the amplitude of the final value (from the pre-exercise baseline), averaged from the last 30 s of the response (termed  and Δ[PCr]end). Thus, the percentage contribution of the slow component to the total response of variable y is equal to: ((Δyend - Δyss)/Δyend) × 100. The initial rates of change of both and [PCr] were obtained from the model B exponential fit (see Rossiter et al. 2000) at a value β which was equal to the value to which the first exercise bout recovered. That is, any difference in pre-exercise baseline between bouts 1 and 2 was accounted for and d/dt and d[PCr]/dt were estimated at the same absolute value of y in both bouts.
The differences between parameter values (by bout and by variable) were examined by Student's paired-comparison t test. The significance of all the fits to the responses was also estimated using the χ2 goodness-of-fit test (Huntsberger, 1961). Values are given as means and standard deviation, or 95 % confidence intervals (C95) where indicated, and a P value of less than 0.05 was used to determine the rejection of the null hypothesis.
RESULTS
[PCr] kinetics
An example of a 31P-MRS ‘stack plot’ from subject 1 showing the sequential series of spectra (one spectrum every 15 s) for the entire double high-intensity square-wave protocol is given in Fig. 1. The areas under the peaks represent the relative concentrations of the three phosphate groups of ATP (γ, α and β), PCr and Pi. While the integrated relative concentration of the ATP peaks did not change significantly during the experiment, note that the exercise-induced fall in [PCr] was evident on the first exercise spectrum. Similarly the [PCr] increased on the first recovery spectrum. An example of the derived [PCr] response profile to the double high-intensity square-wave protocol is shown in Fig. 2 (subject 1). The reduction in [PCr] at the time of the first exercise spectrum was again evident (see above). This was consistently observed for both bout 1 and bout 2; i.e. the delay term (δ) in eqn (1) was therefore at or close to zero in all cases. However, the subsequent [PCr] kinetic response to the exercise was discernibly slower for bout 1 than for bout 2, with a steady state not appearing to have been attained in the former.
Model A (i.e. fitting eqn (1) to the entire 6 min exercise [PCr] data set) provided a generally poor fit to the [PCr] response for bout 1 of the high-intensity protocol (e.g. Fig. 2A). While the characterisation of the response as a single exponential was statistically significant by χ2 analysis (P < 0.05), it is clear from the residual profile that mono-exponentiality is not sufficiently descriptive: the emergence of a delayed ‘slow component’-like element in the [PCr] response was clearly evident. That is, early in the exercise bout, the measured [PCr] response systematically lay above the best-fit estimation but systematically lay below it in the later stages of the exercise (e.g. Fig. 2A). This was also reinforced by the corresponding systematic fluctuation of the associated residuals (e.g. Fig. 2A).
In contrast, the [PCr] response to bout 2 was well described by the model A fit (Fig. 2A). That is, the associated residuals fluctuated closely and randomly about zero and the χ2 values were, again, significant. These features were typical of the group as a whole. Therefore, the ‘slow component’-like region that was apparent in the [PCr] profile during bout 1 was significantly reduced in bout 2; indeed, in six cases (all but subject 7), it was no longer discernible. There was evidence, too, of an overall speeding of the [PCr] kinetics of bout 2, relative to bout 1. That is, the time constant for the [PCr] response (τ[PCr]) for bout 2 averaged 34.3 ± 9.1 s, compared with 42.4 ± 5.3 s for bout 1 - an average reduction of 8.1 s.
The greater discriminatory power of model B (i.e. fitting eqn (1) to that initial region of the [PCr] response which conformed well to mono-exponentiality a posteriori) allowed the alteration of the [PCr] kinetics to be analysed by separating the response into the fundamental component and a putative ‘slow component’. In the example (Fig. 2B), it is evident that the [PCr] responses for both bout 1 and bout 2 were well described by the mono-exponential function over a substantial period following exercise onset (i.e. 195 s for bouts 1 and 2, as indicated by the arrows). There was a reduction of only 2.8 s, on average, in the τ for the [PCr] fundamental component between bout 1 and bout 2: i.e. 34.9 ± 4.6 s and 32.1 ± 11.0 s for bouts 1 and 2, respectively (Table 1). This component of the response lasted for an average duration of 193 ± 44 s. Interestingly, the asymptotic value of the [PCr] decline for the fundamental component, Δ[PCr]ss (model B), was significantly reduced for bout 2 (17.5 ± 6.3 %Δ) relative to bout 1 (21.1 ± 5.8 %Δ) (P < 0.05; Table 1). Also, [PCr] did not recover fully to its initial pre-exercise baseline between the first and second bouts, with [PCr]0 achieving only 98.5 ± 1.8 %Δ compared to the 100 % pre-exercise baseline (a difference that was significant). The small 1.5 %Δ difference in [PCr]0 was accompanied by a 3.6 %Δ difference in the amplitude of the fundamental [PCr] response. This [PCr] amplitude modulation was equivalent to a 9.4 %[PCr]‘saving’ from the first to the second bout, prior to accounting for a further 6.7 % saving by ‘trimming out’ the ‘slow component’-like region, i.e. the difference in Δ[PCr]ss as discerned by the Δ[PCr]end and Δ[PCr]ss from the model B fit (Table 2).
Table 1.
Parameters for the fundamental [PCr] component (model B)
| Bout 1 | Bout 2 | |||||||||||
|---|---|---|---|---|---|---|---|---|---|---|---|---|
| Subject no | No. of transitions | ∼Work rate (W) | [PCr]0 (Δ) | Δ[PCr]ss (Δ) | τ (s) | τC95 (s) | ξ2 | [PCr]0 (Δ) | Δ[PCr]ss (Δ) | τ (s) | τC95 (s) | ξ2 |
| 1 | 4 | 120 | 99.83 | 31.08 | 38.1 | 5.3 | 3.57 | 96.92 | 29.08 | 43.4 | 4.2 | 1.60 |
| 2 | 5 | 50 | 100.15 | 20.86 | 33.9 | 5.6 | 1.85 | 101.34 | 20.7 | 28.1 | 5.8 | 2.40 |
| 3 | 4 | 100 | 99.87 | 25.40 | 38.5 | 3.1 | 0.77 | 96.73 | 20.36 | 31.9 | 5.2 | 3.73 |
| 4 | 2 | 50 | 100.25 | 15.68 | 32.8 | 8.2 | 2.42 | 98.26 | 13.93 | 32.9 | 8.9 | 2.09 |
| 5 | 3 | 100 | 99.96 | 22.02 | 37.3 | 4.2 | 1.03 | 97.23 | 14.59 | 24.3 | 4.5 | 2.90 |
| 6 | 4 | 120 | 100.06 | 14.30 | 37.8 | 8.3 | 3.89 | 100.21 | 11.87 | 48.2 | 7.7 | 0.65 |
| 7 | 2 | 50 | 100.19 | 18.27 | 25.6 | 7.4 | 3.24 | 98.51 | 12.14 | 16.1 | 10.4 | 2.02 |
| Mean | 3 | 84 | 100.04 | 21.09 | 34.86 | 6.0 | 2.40 | 98.46 * | 17.52 * | 32.13 | 6.7 | 2.20 |
| s.d. | 1.1 | 33 | 0.16 | 5.81 | 4.64 | 2.0 | 1.23 | 1.75 | 6.25 | 10.96 | 2.4 | 0.97 |
[PCr] response value for bout 2 is significantly different from bout 1. See eqn (1) for definitions.
Table 2.
Magnitude of the [PCr] slow component of two repeated bouts of heavy-intensity exercise expressed as a percentage of the total amplitude
| Δ[PCr]end–Δ[PCr]ss (%) | |||
|---|---|---|---|
| Subject no. | Bout 1 | Bout 2 | Bout 2 – 1 difference (%Δ) |
| 1 | 5.7 | −0.9 | −6.5 |
| 2 | 14.6 | −1.3 | −16.0 |
| 3 | 4.8 | −3.1 | −7.9 |
| 4 | 13.9 | 3.7 | −10.2 |
| 5 | 8.4 | 0.2 | −8.2 |
| 6 | −6.4 | 2.1 | 8.5 |
| 7 | 12.6 | 5.7 | −6.9 |
| Mean | 7.7 | 0.9 * | −6.7 |
| s.d. | 7.3 | 3.1 | 7.5 |
Values for bout 2 are significantly different from bout 1. Δ[PCr]end, average [PCr] from last 30 s of exercise.
There was no discernible difference in the initial rate of [PCr] decline (d[PCr]/dt) between bouts 1 and 2 (i.e. 33.7 ± 7.8 vs. 34.9 ± 11.0 %Δ min−1, respectively) (Table 3). However, despite a significant reduction in Δ[PCr]ss for the fundamental region and no demonstrable change in the initial rate of [PCr] decline (d[PCr]/dt), we were unable to discriminate a significant reduction in the [PCr] time constant.
Table 3.
Rate of change of [PCr] (d[PCr]/dt) at the onset of the fundamental phase and the same absolute [PCr] (β[PCr])
| d[PCr]/dt (%Δ min−1) | |||
|---|---|---|---|
| Subject no. | Bout 1 | Bout 1 at β[PCr] | Bout 2 at β[PCr] |
| 1 | 48.94 | 44.36 | 40.20 |
| 2 | 36.92 | 39.03 | 44.20 |
| 3 | 39.58 | 34.69 | 38.29 |
| 4 | 28.68 | 25.04 | 25.40 |
| 5 | 35.42 | 31.02 | 36.02 |
| 6 | 22.70 | 22.94 | 14.78 |
| 7 | 42.82 | 38.88 | 45.24 |
| Mean | 36.44 * | 33.71 | 34.88 |
| s.d. | 8.73 | 7.83 | 11.03 |
[PCr] response for bout 1 is significantly different from β[PCr] for bouts 1 and 2. See Methods for definitions.
kinetics
An example of the response profile to the double high-intensity square-wave protocol is shown in Fig. 3 (subject 1). As has been described previously (Barstow & Molé, 1991; Paterson & Whipp, 1991), this was characterised by three temporal phases: an initial, small phase I response, a subsequent prominent phase II component and a ‘slow component’ that delayed the acquisition of a new steady state.
Figure 3. The response of to repeated high-intensity exercise in subject 1.
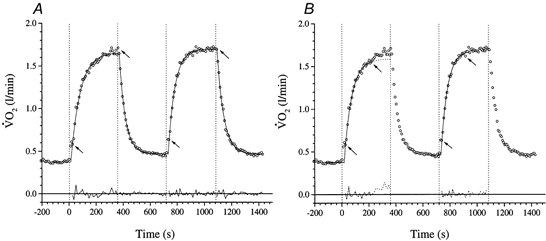
A is fitted with model A (i.e. the whole 360 s response is fitted with a single exponential). B shows the fit to the same data using the model B a posteriori approach (see text) to identify the exponential region. The arrows indicate the ‘fitting window’. The residuals to the fitted responses are shown below.
As was the case for [PCr], the overall response to the exercise was discernibly slower for bout 1 than for bout 2 (Gerbino et al. 1996; Bohnert et al. 1998). This was evident in the poor outcome of the model A fits (i.e. fitting eqn (2) to the entire post-phase I exercise response) to bout 1, which is consistent with the presence of a slow component (Fig. 3A). However, there was evidence of a closer approximation to mono-exponential behaviour for the bout 2 responses: in four subjects (i.e. 1, 3, 6 and 7) model A provided an adequate description. For those subjects in whom a slow component was still discernible in bout 2 (i.e. 2, 4 and 5), its contribution was consistently reduced. This behaviour bears similarity to the modulation of the corresponding [PCr] dynamics, i.e. a trimming-out of the slow component on the second exercise bout. The speeding of the overall response kinetics was evident in the 11.7 s shorter model A τ for bout 2 (45.8 ± 9.3 s), relative to that of bout 1 (57.5 ± 13.6 s) (P < 0.05), which was similar to the 8.1 s reduction manifest for the overall τ[PCr] described above.
Partitioning the response using the model B fitting procedure (i.e. fitting eqn (2) to that initial post-phase I region of the response which conformed well to mono-exponentiality a posteriori) revealed several interesting features. Firstly, the asymptotic amplitudes of the fundamental phase II response were not consistently altered between the first and second exercise bouts (Fig. 3); averaged 0.84 ± 0.33 and 0.81 ± 0.34 l min−1, respectively, for bouts 1 and 2 (P > 0.05; Table 4). Secondly, the speeding of the overall kinetics, already demonstrated by the model A analysis, was accomplished by significant reductions not only in the amplitude of the slow component (Table 5), but also in the phase II τ (i.e. the model B τ of response, τ, was reduced from 48.6 ± 6.0 s for bout 1 to 40.7 ± 8.4 s for bout 2; P < 0.05) (Table 1). This exponential region was found to occur for 195 ± 21 s on average, indistinguishable from the duration of the same phase in [PCr]. A further significant finding was that, in five of the seven subjects, did not recover fully back to the resting baseline level following the first exercise bout. This amounted to a baseline increase () of ∼50 ml min−1 in these subjects.
Table 4.
Parameters for fundamental component (model B)
| Bout 1 | Bout 2 | |||||||||||||
|---|---|---|---|---|---|---|---|---|---|---|---|---|---|---|
| Subject no. | No. of transitions | ∼Work rate (W) | |
|
δ (s) | τ (s) | τC95 (s) | ξ2 | |
|
δ (s) | τ (s) | τC95 (s) | ξ2 |
| 1 | 4 | 120 | 0.374 | 1.214 | 17 | 56.4 | 2.0 | 0.0009 | 0.464 | 1.223 | 13 | 48.3 | 1.6 | 0.0007 |
| 2 | 5 | 50 | 0.377 | 0.573 | 23 | 39.2 | 2.5 | 0.0005 | 0.380 | 0.594 | 16 | 47.9 | 2.5 | 0.0003 |
| 3 | 4 | 100 | 0.400 | 1.069 | 8 | 45.1 | 3.8 | 0.0032 | 0.393 | 0.959 | 11 | 34.4 | 3.2 | 0.0023 |
| 4 | 2 | 50 | 0.407 | 0.425 | 10 | 50.5 | 9.4 | 0.0019 | 0.425 | 0.394 | 10 | 31.0 | 3.8 | 0.0007 |
| 5 | 3 | 100 | 0.422 | 0.948 | 14 | 47.7 | 3.4 | 0.0020 | 0.489 | 1.036 | 33 | 51.0 | 2.6 | 0.0011 |
| 6 | 4 | 120 | 0.366 | 1.141 | 9 | 55.1 | 2.0 | 0.0008 | 0.412 | 1.053 | 13 | 40.3 | 2.3 | 0.0013 |
| 7 | 2 | 50 | 0.471 | 0.497 | 6 | 46.4 | 4.1 | 0.0086 | 0.487 | 0.387 | 16 | 32.0 | 4.3 | 0.0008 |
| Mean | 3 | 84 | 0.402 | 0.838 | 12 | 48.6 § | 3.9 | 0.003 | 0.436 * | 0.807 | 16 | 40.7 * | 2.9 | 0.001 |
| s.d. | 1.1 | 33 | 0.036 | 0.331 | 6 | 6.0 | 2.6 | 0.003 | 0.044 | 0.342 | 8 | 8.4 | 0.9 | 0.001 |
response value for bout 2 is significantly different from bout 1
response value is significantly different from corresponding [PCr] response value for the same bout. See eqn (2) for definitions.
Table 5.
Magnitude of the slow component of two repeated bouts of heavy-intensity exercise expressed as a percentage of the total amplitude
 |
Bout 2 – 1 difference (%Δ) | ||
|---|---|---|---|
| Subject no. | Bout 1 | Bout 2 | |
| 1 | 4.8 | 0.9 | −3.9 |
| 2 | 10.5 | 3.6 | −6.9 |
| 3 | 9.1 | 2.6 | −6.5 |
| 4 | 9.1 | 6.9 | −2.3 |
| 5 | 12.8 | 4.2 | −8.6 |
| 6 | 0.0 | 0.0 | 0.0 |
| 7 | 1.0 | 1.1 | 0.2 |
| Mean | 6.8 | 2.7* | −4.0 |
| S.D. | 4.9 | 2.4 | 3.5 |
Values for bout 2 are significantly different from bout 1.
Comparison of [PCr] and dynamics
The example of the simultaneously measured [PCr] and responses presented in Fig. 4 demonstrates the speeding of their overall response kinetics on bout 2, relative to bout 1. To facilitate kinetic comparisons, the two exercise bouts have been phase-aligned for each variable and bouts 1 and 2 were superimposed. The time constants of the fundamental and [PCr] responses in bout 1 were significantly different (τ[PCr] was shorter than τ by an average of 13.7 s) (Tables 1 and 4), although subjects 2 and 3 had C95 limits that overlapped when their dynamic responses were considered. This was not the case for bout 2, where no statistical difference could be established between the dynamic responses of [PCr] and (Tables 1 and 4).
Figure 4. Example of time-aligned averaged responses of (A) and [PCr] (B) to two repeats of high-intensity knee-extensor exercise in subject 1 lying prone in the bore of the whole-body NMR spectrometer.
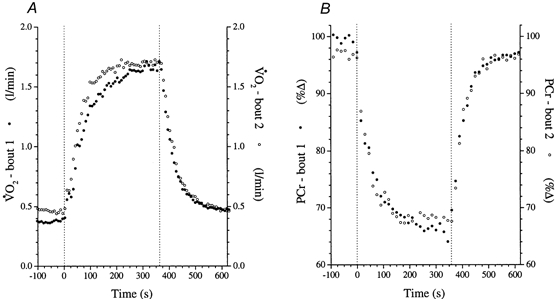
The dotted vertical lines indicate the onset and cessation of exercise.
Importantly, as seen in Fig. 4, there was no discernible difference between the off-transient dynamic responses (using model A). The confidence of parameter estimation of the off-transient kinetics was such that the application of a further, more complex, model could not, at this stage, be justified. The off-transient τ averaged 56.0 ± 15.1 s and 52.4 ± 12.1 s for bouts 1 and 2, respectively, and τ[PCr] averaged 37.7 ± 14.5 s and 39.5 ± 6.7 s for bouts 1 and 2. These values were not statistically different from the respective on-transient dynamics using the same modelling approach. As with the on-transient, the and [PCr] off-transient τ values were significantly different ( being longer) during the first bout only (P < 0.05); the second bout was not significantly different.
Although the reduction in the fundamental τ[PCr] was not statistically significant (P > 0.05) the small reduction in τ was accompanied by an unaltered [PCr] utilisation rate, as judged by the initial rate of [PCr] change (d[PCr]/dt) at exercise onset (cf. Rossiter et al. 2000). To take account of differences in the resting baseline values prior to bouts 1 and 2, d[PCr]/dt was measured at a fixed value (β) set to the [PCr] level at the onset of bout 2. Despite the significantly reduced amplitude of the [PCr] response in bout 2 (by an average of 16.1 %, Fig. 6), d[PCr]/dt at β[PCr] was not significantly different, averaging 33.7 ± 7.8 %Δ min−1 for bout 1 and 34.9 ± 11.0 %Δ min−1 for bout 2 (Table 3). The significant reduction in Δ[PCr]ss with an unaltered d[PCr]/dt is suggestive of a reduced τ: the fact that this did not reach statistical significance despite being substantially reduced in four subjects is presumably due to the sample size. The reduction in the fundamental phase II τ for bout 2, relative to bout 1, was mainly the result of a greater initial rate of change (d/dt) for bout 2 (1.12 ± 0.39 l min−2) than for bout 1 (0.99 ± 0.34 l min−2) (Fig. 5A and B). That is, there was no consistent change in the asymptotic phase II gain () (Table 4).
Figure 6. The steady-state amplitude of [PCr] from two repeated high-intensity bouts.
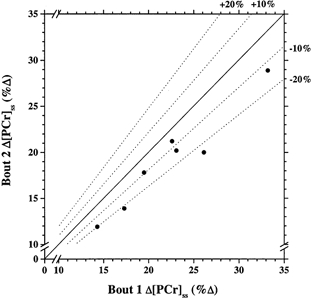
Δ[PCr]ss is reduced from bout 1 to bout 2 in repeated high-intensity exercise in seven subjects.
Figure 5. The initial rate of change and phase II time constants of for two repeated high-intensity bouts.
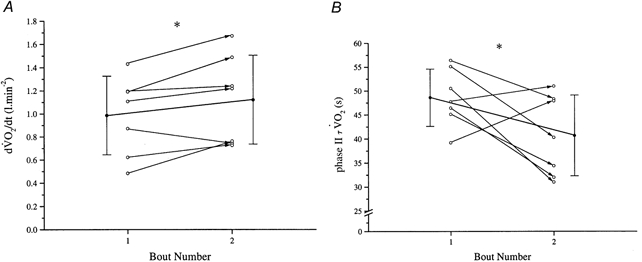
A, the rate of change of (at a given , β) is significantly increased from the first to the second bout of repeated high-intensity exercise in seven subjects. B, as a result of the unchanged steady-state amplitude of in the two repeats, the time constant (τ) is also significantly reduced.
DISCUSSION
In 1996, Gerbino et al. (1996) demonstrated that the pulmonary response kinetics during the on-transient of a bout of high-intensity cycle ergometer exercise were markedly altered by an identical prior bout imposed 6 min earlier, such that the rate of change of (d/dt) was faster at a given level of . Consistent with this more rapid response profile for the second exercise bout was the demonstration of attenuated increases in arterial blood [lactate], [H+] and . However, while Gerbino et al. (1996) and, subsequently, MacDonald et al. (1997) and Bohnert et al. (1998) all demonstrated this speeding effect on the transients, these investigators did not attempt to apportion this alteration to different kinetic components of the response; indeed, Gerbino et al. (1996) pointed out that the results of a single exercise transition would be unlikely to provide the appropriate resolving power for such discrimination. However, as the asymptotic, or steady-state, of the still-exponential fundamental component of the response has been shown to be unaltered at work rates resulting in a sustained metabolic acidosis (Paterson & Whipp, 1991; Barstow & Molé, 1991) it was inferred that the speeding was a result of a smaller τ, i.e.
Burnley et al. (2000) and Koppo & Bouckaert (2000), however, recently addressed this issue further with improved confidence in the parameter estimation and demonstrated that the phase II τ for was actually unaltered by the prior exercise. They further suggest that, by accounting for the altered (raised) baseline at the onset of bout 2, this phase of the subsequent kinetics is identical between bouts, although, in agreement with Gerbino et al. (1996) and MacDonald et al. (1997), the magnitude of the slow phase was reduced.
Our results, in contrast (with average C95 values of ∼3.5 s for ), demonstrated a significant speeding of the fundamental kinetics between the two exercise bouts: the small baseline difference at the start of the second bout (only 34 ml min−1 on average) was unable to account for the reduction in τ as evidenced by the faster d/dt with unaltered . The simultaneous [PCr] changes were characterised by an unaltered d[PCr]/dt but in this case with a reduced Δ[PCr]ss, consistent with both the reduced O2 deficit and a reduction in τ[PCr], although the latter did not achieve statistical significance.
We are unable to explain the differences between the present findings and those of Burnley et al. (2000). However, the muscle mass utilised, different exercise intensities (the exercise in this study caused the fundamental to rise to approximately 70 % of the individuals’ maximum for knee-extensor exercise, whereas for Burnley et al. (2000) this was closer to 80 %; cf. Ozyener et al. 2001) and exercise modality (i.e. knee extension vs. cycle ergometry) may be contributory.
The speeding of the responses in the present study reflected reductions not only in the amplitude of the slow component but also in the time constant of the ‘fundamental’ response. The consequent reduction in the O2 deficit was evident at the level of the exercising muscles, as a reduction in its PCr-derived component: (a) a 9.4 % average reduction deriving from the attenuation of the asymptotic amplitude of the simultaneously determined [PCr] fundamental response (Δ[PCr]ss) in the quadriceps and (b) a 6.7 % average reduction that reflected a reduced ‘slow component’-like region in the [PCr] response. The total O2 deficit saving during the second exercise bout thus averaged 16.1 %. Previous investigations of the slow component of suggested that an intramuscular mechanism is responsible for the increased energy requirement during heavy exercise (e.g. Poole et al. 1991). While our results are consistent with this suggestion, they provide the added feature that the slow component appears to be consequent to an increased phosphate cost of force production rather than a high O2 cost of ATP production; this in turn suggests that the increased energy requirements from muscle groups not contributing to the ergometer work (i.e. increased energy requirements of cardiac and/or respiratory muscles) may be of minor overall importance during this exercise.
Assuming a whole-muscle [PCr] of 25 mm (Conley et al. 2000) and an exercising muscle mass of 5 kg (consistent with the value reported by Andersen & Saltin (1985) for knee-extension exercise) the ∼15 % saving in the [PCr] component of the O2 deficit represents an approximately 1 mm reduction of the entire [PCr] component of the O2 deficit in the conditioned bout. This saving of the O2 deficit not only leaves a larger residual intramuscular PCr pool at the end of the second work bout, but also will not have to be accounted for during recovery at the cessation of exercise. The demonstration that [PCr] was still falling at the end of bout 1 (reflecting the influence of the ‘slow component’-like region) while attaining a new steady state and being well described by mono-exponential kinetics in bout 2 suggests that the initial high-intensity exercise bout exerts its ‘speeding’ effect by functionally ‘linearising’ the [PCr], and consequently the , response to the subsequent high-intensity bout. That is, [PCr] and , we were not able to make corresponding estimations of the kinetics of the subsequent slow component. This precluded us from discriminating between, for example, linear or exponential characterisations (e.g. Paterson & Whipp, 1991; Barstow & Molé, 1991). This was a reflection, predominantly, of the small amplitude of the slow phase and the short duration within which it was constrained to develop in these experiments. Although we designed these experiments to stress each individual to the same exercise intensity, we cannot rule out inter-subject differences in quadriceps muscle fibre type distribution and recruitment which may, in turn, influence the prominence of the slow component, as Barstow et al. (1996) have argued. Further experiments designed to provide greater confidence in the resolution of the and [PCr] kinetics in this region are needed.
The mechanisms previously suggested for the modulation of the kinetics by a prior bout of high-intensity exercise include: (a) an improved blood flow to the exercising muscles in the second bout compared to the first (Gerbino et al. 1996; MacDonald et al. 1997) within an intensity domain for which vascular oxygen delivery may be expected to be limiting and/or (b) an increased Bohr shift of the oxygen dissociation curve at the onset of the second work bout which could enhance O2 diffusion to the tissues, consequent to a residual metabolic acidaemia from bout 1 (Gerbino et al. 1996). However, the possibility that the intramuscular enzyme activity status may be modulated cannot be ruled out in the light of the present results. For instance, recent findings by Gibala & Saltin (1999) suggest that a prior bout of exercise will ‘prime’ the pyruvate dehydrogenase complex, which, it has been suggested, would consequently reduce the oxygen deficit (Timmons et al. 1998); although were this to be the case we would expect it to be apparent in the studies of Burnley et al. (2000) and Koppo & Bouckaert (2000). In our study the ‘priming’ bout high-intensity exercise does not apparently alter the initial rate of [PCr] breakdown but does significantly reduce the amount of [PCr] hydrolysis that occurs during the transient (Δ[PCr]ss), i.e. consistent with a faster time constant of the [PCr] dynamics - although the mean decrease proved not to be statistically significant for the small number of subjects.
It has been suggested that [PCr] is important to the control of oxygen consumption () in muscle (Meyer, 1988) although it may equally well serve as a proxy variable for [Pi] (Chance et al. 1985) or as a contributor to more complex theories such as the phosphorylation potential (e.g. Wilson, 1994). Indeed, Meyer (1988) suggested that the time course of [PCr] fall during a range of metabolic rates (in electrically stimulated rat muscle) was invariant and could be explained by a linear model of muscle respiration, a view consistent with that of Mahler (1985). The experiments of Meyer (1988), however, did not consider higher-order modelling of the [PCr] profile, nor, for obvious technical reasons, include measurements of or .
As evident from eqn (3), any change in τ should be manifest as a change in d/dt at a given  , unless has changed: in this case of the fundamental component was found to be unchanged with d/dt being greater during bout 2. Furthermore, any change in τ should also be evident in the putative intramuscular controllers. Indeed, we have shown here that a modulation of the fundamental region of the [PCr] response is evidently associated with a faster phase II pulmonary response, supporting the concept of intramuscular modulation of τ (and hence ) that cannot be accommodated by the simple creatine shuttle hypothesis (Bessman & Geiger, 1981) as presented by Mahler (1985), but may be modulated by other factors not measured here. We were not able, using these techniques, to establish the contribution of additional factors such as lactate production, pH or [ADP] to the control of oxidative phosphorylation.
Figure 7 depicts a model of the dynamic relationship between muscle O2 consumption and [PCr] in the phase II region where simple mono-exponential response kinetics are argued to predominate (Tschakovsky & Hughson, 1999), with the corresponding component of the response being speeded as a result of a prior ‘priming’ bout of high-intensity exercise. The speeding of arises because of an altered initial rate of adaptation with a constant overall amplitude of response (), whereas the modulation of [PCr] reflects modulations of Δ[PCr]ss with a constant initial rate of change. Both mechanisms give rise to a reduction in τ: this is supported by the findings of this study. However, this model implies that the parameter, variable and constant of the control equation (eqn (3)) associate differently for [PCr] and . But, as the initial rate of change of [PCr] is the same in both cases it is as if the system has ‘prior knowledge’ of Δ[PCr]ss or is influenced by the [PCr] time constant itself.
Figure 7. The interaction of the kinetics of muscle O2 consumption and [PCr] during repeated high-intensity exercise bouts.
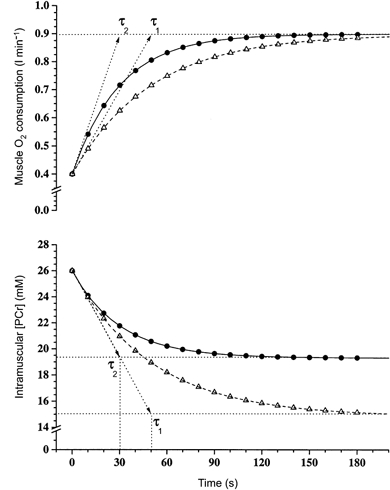
A model illustrating the interaction of amplitude, rate of change and the time constant of response of muscle O2 consumption (upper panel) and intramuscular [PCr] (lower panel) in two repetitions of high-intensity knee-extensor exercise in humans.
Our results, however, call into question a major assumption of the study: that the kinetics of muscle O2 consumption can be estimated with reasonable confidence (i.e. ≤ 10 %) from pulmonary measurements during high-intensity exercise. That is, the prior high-intensity exercise induced a phase II response that was speeded by an average of 7.9 s, whereas the phase II region of intramuscular [PCr] was only speeded by 2.3 s on average. Although the modulation of muscle kinetics associated with the limb-to-lung transit effect (Barstow et al. 1990) has been shown to be negligible at moderate work rates (Grassi et al. 1996), this has not been demonstrated during high-intensity exercise. It is possible during high-intensity exercise that muscle τ is dissociated from the phase II component of the pulmonary by more than 10 % as a consequence of the influence of the oxygen stores - Barstow et al. (1990) only investigated this influence during moderate-intensity exercise. However, the subjects who have performed both knee-extension exercise and cycle ergometry in our laboratory have demonstrated no significant difference between the resulting fundamental τ of , despite the differing muscle groups under investigation. Nevertheless a limitation due to exercise in a prone position should not be discounted, although we are aware of no evidence in the literature which has addressed this issue. The possibility of a dissociation between and intramuscular [PCr], despite τ and phase II τ being equal, should not be ruled out because of variation in the control link or as a result of a potential limitation of O2 availability (MacDonald et al. 1997) resulting in increased glycolytic flux (and hence increased lactate-yielding energy processes occurring in the transient). Resolution of this issue clearly awaits further investigation.
Equally intriguing, however, is that the ‘history’ of the prior exercise had no apparent effect on the off-transient responses for both variables. This invariance of off-transient dynamics in this supra-threshold domain has been consistently demonstrated (Gerbino et al. 1996; Bohnert et al. 1998; Fukuba et al. 1998) and is also evident in the results of Burnley et al. (2000). Consequently, in the light of the constancy of the off-transient kinetics, important clues to the control of appear to reside in the on-transient and its work rate-dependent modulations. There is the important corollary that inferences for the on-transient behaviour drawn from the off-transient should be made only with caution: the system is dynamically non-linear in this intensity domain.
In summary, these experiments have shown for the first time that: (1) the slow component of is also manifest in the exercising muscle as a temporally associated reduction in [PCr] and (2) the modulation of the kinetics for heavy exercise by prior high-intensity exercise is accompanied by a reduction in the [PCr]-derived O2 deficit. Furthermore, these findings can been seen to support the proposal of [PCr]-related control models of muscle respiration (e.g. Mahler, 1980; Meyer, 1988): the dynamic features of altered adaptation of to the second bout of square-wave exercise are also present in the intramuscular [PCr] profile during both the fundamental and slow component regions of the response. However, these modulations are manifest in dynamics that are inconsistent with the simple linear control of muscle respiration by [PCr], at least during the first exercise bout; i.e. the dynamics of [PCr] express complex, multi-compartment behaviour during high-intensity exercise and may be modulated by the pre-exercise conditions. This, coupled with the finding that the kinetics are significantly slower than those of [PCr] (assuming, of course, that the phase II and kinetics are similar), at least during the first exercise bout, implicates more complex control models that require additional parameters (e.g. Chance et al. 1986).
Acknowledgments
This work was supported by The Wellcome Trust, grant number 058420.
References
- Andersen P, Saltin B. Maximal perfusion of skeletal muscle in man. Journal of Physiology. 1985;366:233–249. doi: 10.1113/jphysiol.1985.sp015794. [DOI] [PMC free article] [PubMed] [Google Scholar]
- Barstow TJ, Buchthal S, Zanconato S, Cooper DM. Muscle energetics and pulmonary oxygen uptake kinetics during moderate exercise. Journal of Applied Physiology. 1994;77:1742–1749. doi: 10.1152/jappl.1994.77.4.1742. [DOI] [PubMed] [Google Scholar]
- Barstow TJ, Jones AM, Nguyen PH, Casaburi R. Influence of muscle fibre type and pedal frequency on oxygen uptake kinetics of heavy exercise. Journal of Applied Physiology. 1996;81:1642–1650. doi: 10.1152/jappl.1996.81.4.1642. [DOI] [PubMed] [Google Scholar]
- Barstow TJ, Lamarra N, Whipp BJ. Modulation of muscle and pulmonary O2 uptakes by circulatory dynamics during exercise. Journal of Applied Physiology. 1990;68:979–989. doi: 10.1152/jappl.1990.68.3.979. [DOI] [PubMed] [Google Scholar]
- Barstow TJ, Molé PA. Linear and non-linear characteristics of oxygen uptake kinetics during heavy exercise. Journal of Applied Physiology. 1991;71:2099–2106. doi: 10.1152/jappl.1991.71.6.2099. [DOI] [PubMed] [Google Scholar]
- Beaver WL, Wasserman K, Whipp BJ. On-line computer analysis and breath-by-breath graphical display of exercise function tests. Journal of Applied Physiology. 1973;34:128–132. doi: 10.1152/jappl.1973.34.1.128. [DOI] [PubMed] [Google Scholar]
- Bessman SP, Geiger PJ. Transport of energy in muscle: the phosphorylcreatine shuttle. Science. 1981;211:448–452. doi: 10.1126/science.6450446. [DOI] [PubMed] [Google Scholar]
- Bohnert B, Ward SA, Whipp BJ. Effects of prior arm exercise on pulmonary gas exchange kinetics during high-intensity leg exercise in humans. Experimental Physiology. 1998;83:557–570. doi: 10.1113/expphysiol.1998.sp004138. [DOI] [PubMed] [Google Scholar]
- Burnley M, Jones AM, Carter H, Doust JH. Effects of prior heavy exercise on phase II pulmonary oxygen uptake kinetics during heavy exercise. Journal of Applied Physiology. 2000;89:1387–1396. doi: 10.1152/jappl.2000.89.4.1387. [DOI] [PubMed] [Google Scholar]
- Chance B, Leigh JS, Jr, Clark BJ, Marvis J, Kent J, Nioka S, Smith D. Control of oxidative metabolism and oxygen delivery in human skeletal muscle: A steady-state analysis of the work/energy cost transfer function. Proceedings of the National Academy of Sciences of the USA. 1985;82:8384–8388. doi: 10.1073/pnas.82.24.8384. [DOI] [PMC free article] [PubMed] [Google Scholar]
- Chance B, Leigh JS, Jr, Kent J, McCully K, Nioka S, Clarke BJ, Maris JM, Graham T. Multiple controls of oxidative metabolism in living tissues as studied by phosphorus magnetic resonance. Proceedings of the National Academy of Sciences of the USA. 1986;83:9458–9462. doi: 10.1073/pnas.83.24.9458. [DOI] [PMC free article] [PubMed] [Google Scholar]
- Conley KE, Jubrais SA, Esselman PC. Oxidative capacity and ageing in human muscle. Journal of Physiology. 2000;526:203–210. doi: 10.1111/j.1469-7793.2000.t01-1-00203.x. [DOI] [PMC free article] [PubMed] [Google Scholar]
- di Prampero PE, Margeria R. Relationship between O2 consumption, high energy phosphates and the kinetics of the O2 debt in exercise. Pflügers Archiv. 1968;304:11–19. doi: 10.1007/BF00586714. [DOI] [PubMed] [Google Scholar]
- Fukuba Y, Hayashi N, Sato H, Yoshida T. Effects of diathermic warming of working muscles on O2-kinetics during heavy exercise. Medicine and Science in Sports and Exercise. 1998;30(suppl. 5):S-189. [Google Scholar]
- Gausche MA, Harmon T, Lamarra N, Whipp BJ. Pulmonary O2 uptake kinetics in humans are speeded by a bout of prior exercise above, but not below, the lactate threshold. Journal of Physiology. 1989;417:138P. [Google Scholar]
- Gerbino A, Ward SA, Whipp BJ. Effects of prior exercise on pulmonary gas-exchange kinetics during high-intensity exercise in humans. Journal of Applied Physiology. 1996;80:99–107. doi: 10.1152/jappl.1996.80.1.99. [DOI] [PubMed] [Google Scholar]
- Gibala MJ, Saltin B. PDH activation by dichloroacetate reduces TCA cycle intermediates at rest but not during exercise in humans. American Journal of Physiology. 1999;277:E33–38. doi: 10.1152/ajpendo.1999.277.1.E33. [DOI] [PubMed] [Google Scholar]
-
Grassi B, Gladden LB, Samaja M, Stary CM, Hogan MC. Faster adjustment of O2 delivery does not affect on-kinetics in isolated in situ canine muscle. Journal of Applied Physiology. 1998;85:1394–1403. doi: 10.1152/jappl.1998.85.4.1394. [DOI] [PubMed] [Google Scholar]
- Grassi B, Poole DC, Richardson RS, Knight DR, Erickson BK, Wagner PD. Muscle O2 uptake kinetics in humans: implications for metabolic control. Journal of Applied Physiology. 1996;80:988–998. doi: 10.1152/jappl.1996.80.3.988. [DOI] [PubMed] [Google Scholar]
- Hughson RL, Cochrane JE, Butler GC. Faster O2 uptake kinetics at onset of supine exercise with and without lower body negative pressure. Journal of Applied Physiology. 1993;75:1962–1967. doi: 10.1152/jappl.1993.75.5.1962. [DOI] [PubMed] [Google Scholar]
- Hughson RL, Morrissey M. Delayed kinetics of respiratory gas exchange in the transition from prior exercise. Journal of Applied Physiology. 1982;52:921–929. doi: 10.1152/jappl.1982.52.4.921. [DOI] [PubMed] [Google Scholar]
- Huntsberger DV. Elements of Statistical Inference. Boston, MA, USA: Allyn and Bacon Inc; 1961. p. 177. [Google Scholar]
- Kemp GJ, Thompson CH, Barnes PR, Radda GK. Comparisons of ATP turnover in human muscle during ischemic and aerobic exercise using 31P magnetic resonance spectroscopy. Magnetic Resonance in Medicine. 1994;31:248–258. doi: 10.1002/mrm.1910310303. [DOI] [PubMed] [Google Scholar]
- Koppo K, Bouckaert J. In humans the oxygen uptake slow component is reduced by prior exercise of high as well as low intensity. European Journal of Applied Physiology. 2000;83:559–565. doi: 10.1007/s004210000295. [DOI] [PubMed] [Google Scholar]
- Lamarra N, Whipp BJ, Ward SA, Wasserman K. Effect of interbreath fluctuations on characterizing exercise gas exchange kinetics. Journal of Applied Physiology. 1987;62:2003–2012. doi: 10.1152/jappl.1987.62.5.2003. [DOI] [PubMed] [Google Scholar]
- Linnarsson D. Dynamics of pulmonary gas exchange and heart rate changes at the start and end of exercise. Acta Physiologica Scandinavica. 1974;(suppl. 415):1–68. [PubMed] [Google Scholar]
- McCreary CR, Chilibeck PD, Marsh GD, Paterson DH, Cunningham DA, Tompson RT. Kinetics of pulmonary oxygen uptake and muscle phosphates during moderate-intensity calf-exercise. Journal of Applied Physiology. 1996;81:1331–1338. doi: 10.1152/jappl.1996.81.3.1331. [DOI] [PubMed] [Google Scholar]
- MacDonald M, Pedersen PK, Hughson RL. Acceleration of O2 kinetics in submaximal heavy exercise by hyperoxia and prior high-intensity exercise. Journal of Applied Physiology. 1997;83:1318–1325. doi: 10.1152/jappl.1997.83.4.1318. [DOI] [PubMed] [Google Scholar]
- Mahler M. Kinetics and control of oxygen consumption in skeletal muscle. In: Cerretelli P, Whipp BJ, editors. Exercise Bioenergetics and Gas Exchange. Oxford: Elsevier/North Holland Biomedical Press; 1980. pp. 53–66. [Google Scholar]
- Mahler M. First order kinetics of muscle oxygen consumption and equivalent proportionality between QO2 and phosphorylcreatine level. Implications for the control of respiration. Journal of Applied Physiology. 1985;86:135–165. doi: 10.1085/jgp.86.1.135. [DOI] [PMC free article] [PubMed] [Google Scholar]
- Meyer RA. A linear model of muscle respiration explains mono-exponential phosphocreatine changes. American Journal of Physiology. 1988;254:C548–553. doi: 10.1152/ajpcell.1988.254.4.C548. [DOI] [PubMed] [Google Scholar]
- Özyener F, Rossiter HB, Ward SA, Whipp BJ. Influence of exercise intensity on the on- and off-transient kinetics of pulmonary oxygen uptake in humans. Journal of Physiology. 2001;533:891–902. doi: 10.1111/j.1469-7793.2001.t01-1-00891.x. [DOI] [PMC free article] [PubMed] [Google Scholar]
- Paterson DH, Whipp BJ. Asymmetries of oxygen uptake transients at the on- and offset of heavy exercise in humans. Journal of Physiology. 1991;443:575–586. doi: 10.1113/jphysiol.1991.sp018852. [DOI] [PMC free article] [PubMed] [Google Scholar]
-
Poole DC, Barstow TJ, Gaesser GA, Willis WT, Whipp BJ. slow component: physiological and functional significance. Medicine and Science in Sports and Exercise. 1994;26:1354–1358. [PubMed] [Google Scholar]
- Poole DC, Schaffartzik W, Knight DR, Derion T, Kennedy B, Guy HJ, Prediletto R, Wagner PD. Contribution of exercising legs to the slow component of oxygen uptake kinetics in humans. Journal of Applied Physiology. 1991;71:1245–1253. doi: 10.1152/jappl.1991.71.4.1245. [DOI] [PubMed] [Google Scholar]
- Rossiter HB, Howe FA, Ward SA, Kowalchuk JM, Griffiths JR, Whipp BJ. Inter-sample [PCr] fluctuations by 31P-MRS and parameter estimation of metabolic responses to exercise in humans. Journal of Physiology. 2000;528:359–369. doi: 10.1111/j.1469-7793.2000.t01-1-00359.x. [DOI] [PMC free article] [PubMed] [Google Scholar]
- Rossiter HB, Ward SA, Doyle VL, Howe FA, Griffiths JR, Whipp BJ. Inferences from pulmonary O2 uptake with respect to intramuscular [PCr] kinetics during moderate exercise in humans. Journal of Physiology. 1999;518:921–932. doi: 10.1111/j.1469-7793.1999.0921p.x. [DOI] [PMC free article] [PubMed] [Google Scholar]
- Stubbs M, Van den Boogaart A, Bashford CL, Miranda PMC, Rodrigues LM, Howe F, Griffiths JR. 31P-Magnetic resonance spectroscopy studies of nucleated and non-nucleated erythrocytes; time domain data analysis (VARPRO) incorporating prior knowledge can give information on the binding of ADP. Biochimica et Biophysica Acta. 1996;1291:143–148. doi: 10.1016/0304-4165(96)00058-x. [DOI] [PubMed] [Google Scholar]
- Timmons JA, Gustafsson T, Sundberg CJ, Jansson E, Greenhaff PL. Muscle acetyl group availability is a major determinant of oxygen deficit in humans during submaximal exercise. American Journal of Physiology. 1998;274:E377–380. doi: 10.1152/ajpendo.1998.274.2.E377. [DOI] [PubMed] [Google Scholar]
- Tschakovsky ME, Hughson RL. Interaction of factors determining oxygen uptake at the onset of exercise. Journal of Applied Physiology. 1999;86:1101–1113. doi: 10.1152/jappl.1999.86.4.1101. [DOI] [PubMed] [Google Scholar]
- van der Veen JWC, de Beer R, Luyten PR, Ormnidt D. Accurate quantification of in vivo31P MRS signals using the variable projection method and prior knowledge. Magnetic Resonance in Medicine. 1988;6:92–98. doi: 10.1002/mrm.1910060111. [DOI] [PubMed] [Google Scholar]
- Whipp BJ, Mahler M. Dynamics of pulmonary gas exchange during exercise. In: West JB, editor. Pulmonary Gas Exchange, Vol. II: Organism and Environment. New York: Academic Press; 1980. pp. 33–96. [Google Scholar]
- Whipp BJ, Ozyener F. The kinetics of exertional oxygen uptake: assumptions and inferences. Medicina Dello Sport. 1998;51:139–149. [Google Scholar]
- Whipp BJ, Rossiter HB, Ward SA, Avery D, Doyle VL, Howe FA, Griffiths JR. Simultaneous determination of muscle 31phosphate and O2 uptake kinetics during whole-body NMR spectroscopy. Journal of Applied Physiology. 1999;86:742–747. doi: 10.1152/jappl.1999.86.2.742. [DOI] [PubMed] [Google Scholar]
- Whipp BJ, Ward SA, Lamarra N, Davis JA, Wasserman K. Parameters of ventilatory and gas exchange dynamics during exercise. Journal of Applied Physiology. 1982;52:1506–1513. doi: 10.1152/jappl.1982.52.6.1506. [DOI] [PubMed] [Google Scholar]
- Whipp BJ, Wasserman K. Oxygen uptake kinetics for various intensities of constant load work. Journal of Applied Physiology. 1972;33:351–356. doi: 10.1152/jappl.1972.33.3.351. [DOI] [PubMed] [Google Scholar]
- Wilson DF. Factors affecting the rate and energetics of mitochondrial oxidative phosphorylation. Medicine and Science in Sports and Exercise. 1994;26:37–43. [PubMed] [Google Scholar]
- Yoshida T, Watari H. 31P-nuclear magnetic resonance spectroscopy study of the time course of energy metabolism during exercise and recovery. European Journal of Applied Physiology. 1993;66:494–499. doi: 10.1007/BF00634298. [DOI] [PubMed] [Google Scholar]