

Abstract
The aim of this work was to test the redox hypotheses of O2 chemoreception in the carotid body (CB). They postulate that hypoxia alters the levels of reactive oxygen species (ROS) and the ratio of reduced to oxidized glutathione (GSH/GSSG), causing modifications to the sulfhydryl groups/disulfide bonds of K+ channel proteins, which leads to the activation of chemoreceptor cells.
We found that the GSH/GSSG ratio in normoxic calf CB (30.14 ± 4.67; n = 12) and hypoxic organs (33.03 ± 6.88; n = 10), and the absolute levels of total glutathione (0.71 ± 0.07 nmol (mg tissue)−1, normoxia vs. 0.76 ± 0.07 nmol (mg tissue)−1, hypoxia) were not statistically different.
N-Acetylcysteine (2 mm; NAC), a precursor of glutathione and ROS scavenger, increased normoxic glutathione levels to 1.03 ± 0.06 nmol (mg tissue)−1 (P < 0.02) and GSH/GSSG ratios to 59.05 ± 5.05 (P < 0.001).
NAC (20 μm–10 mm) did not activate or inhibit chemoreceptor cells as it did not alter the normoxic or the hypoxic release of 3H-catecholamines (3H-CAs) from rabbit and calf CBs whose CA deposits had been labelled by prior incubation with the natural CA precursor 3H-tyrosine.
NAC (2 mm) was equally ineffective in altering the release of 3H-CAs induced by stimuli (high external K+ and ionomycin) that bypass the initial steps of the hypoxic cascade of activation of chemoreceptor cells, thereby excluding the possibility that the lack of effect of NAC on normoxic and hypoxic release of 3H-CAs results from a concomitant alteration of Ca2+ channels or of the exocytotic machinery.
The present findings do not support the contention that O2 chemoreception in the CB is linked to variations in the GSH/GSSG quotient as the redox models propose.
The carotid bodies (CBs) are arterial chemoreceptors activated by hypoxia and acidosis that initiate systemic responses (mostly respiratory) aimed at restoring blood PO2 and PCO2/pH. Chemoreceptor cells of the CB, which are synaptically connected with the sensory fibres of the carotid sinus nerve, detect blood gases and respond to hypoxia and acidosis with an increase in the rate of release of neurotransmitters (e.g. catecholamines, CAs). An increase in the activity of the carotid sinus nerve and systemic responses follow (Gonzalez et al. 1994).
A fundamental aspect of chemoreceptor cell physiology, shared by pulmonary artery smooth muscle cells and erythropoietin-producing cells, is their capacity to become activated at an arterial PO2 of 70–75 mmHg, when blood O2 content is > 90 % (Reeves et al. 1979; Gonzalez, 1998). The activity of these cells increases with increasing hypoxia, and to maintain their activity they exhibit high hypoxic metabolic rates and ATP levels (Verna et al. 1990; Obeso et al. 1993). The threshold to hypoxia and the resulting systemic responses make these cells the origin of feedback loops which maintain tissue O2 levels in the normal range when the available PO2 is low (e.g. at high altitude; Richalet, 1997; Gonzalez, 1998).
Reactive oxygen species (ROS) have been implicated in O2 sensing in the three cell types mentioned (Acker & Xue, 1995; Wolin et al. 1999; Zhu & Bunn, 1999), under the generic name of redox models of O2 sensing and transduction. According to one redox model (Acker & Xue, 1995), hypoxia would decrease the activity of a phagocyte-like NAD(P)H oxidase with subsequent decrease in ROS production. The falling levels of ROS, or the concomitant increase in the reduced to oxidized glutathione ratio (GSH/GSSG), would cause a reduction of the disulfide bonds in the proteins forming the K+ channels, thereby leading to a decrease in their opening probability, followed by cell depolarization, activation of voltage-dependent Ca2+ channels and release of neurotransmitters from the chemoreceptor cells (López-Barneo et al. 1988; Post et al. 1992; see Gonzalez et al. 1994). Although the involvement of NAD(P)H in O2 sensing in the three cell types (but not in neuroepithelial bodies; Fu et al. 2000; O'Kelly et al. 2000) has been questioned (Gleadle et al. 1995; Archer et al. 1999; Obeso et al. 1999; Dvorakova et al. 2000; Roy et al. 2000), the decrease in ROS production and the increase in GSH/GSSG continues to be considered a critical step in low PO2 sensing: the most recent hypothesis is that hypoxia decreases the production of ROS in mitochondria (Archer et al. 1999; Lahiri & Acker, 1999). Opposing these notions, Chandel and co-workers (1998) have observed that the mitochondrial rate of production and levels of ROS in the cells increase during hypoxia. They have proposed that increased ROS levels could mediate the hypoxic activation of CB chemoreceptor cells (Chandel & Schumacker, 2000).
The aim of this work was to determine the GSH/GSSG ratio in the CB and to monitor the response of chemoreceptor cells in normoxia, hypoxia and during the experimental modification of the GSH/GSSG ratios produced by incubation of the CBs with N-acetylcysteine (NAC). NAC is a precursor of GSH, increasing the GSH/GSSG ratio, and a scavenger of several ROS molecules (Dent et al. 1997; Halliwell & Gutteridge, 1999). Thus, according to the redox model in which hypoxia decreases ROS levels, NAC should mimic the natural hypoxic stimulus and activate chemoreceptor cells. On the other hand, according to the redox model in which hypoxia increases ROS levels, NAC should inhibit chemoreceptor cells and oppose hypoxic stimulation. To monitor the activation of chemoreceptor cells we have measured their release of 3H-CA in CBs whose CA deposits have been labelled by prior incubation with the natural precursor 3H-tyrosine. We found that hypoxia did not significantly alter the levels or the ratio GSH/GSSG. On the contrary, NAC increased the level and the GSH/GSSG ratio, but did not alter the release of 3H-CA induced by hypoxia. We conclude that the GSH/GSSG ratio or ROS levels do not mediate O2 sensing.
METHODS
Surgery and CB isolation and identification
Adult New Zealand White rabbits (2–2.5 kg) were anaesthetized with 40 mg kg−1 sodium pentobarbital (Sigma, Madrid, Spain) dissolved in saline and administered through the lateral vein of the ear. The rabbits were tracheostomized and blocks of tissue containing the carotid bifurcations were removed and placed in a lucite chamber containing ice-cold Tyrode solution (mm: NaCl, 140; KCl, 5; CaCl2, 2; MgCl2, 1.1; glucose, 5.5; Hepes, 10) adjusted to pH 7.40 with 1 n NaOH. The CBs (6–12 per experiment) were cleaned of surrounding connective tissue and collected in fresh Tyrode solution. Animals were killed with an intracardiac overdose of pentobarbital (100–200 mg). All measures were taken to ensure the animals did not suffer distress at any time. The protocols were approved by the Institutional Animal Care and Use Committee of the University of Valladolid.
Calf CBs were obtained from the slaughterhouse. Three to five minutes after the death of the animals the carotid bifurcations were removed and stored in ice-cold Tyrode solution. The bifurcations were placed in a lucite chamber and the CBs, formed by one or more lobules, were cleaned. The CBs were identified by their proximity to some of the arterial branches of the carotid sinus, by their pink-reddish appearance and by their penetration by thin nerve filaments. The identity of the calf CB was confirmed by histological examination of cryostat sections obtained from CB lobules fixed in 0.4 % paraformaldehyde, by immunocytochemical staining of tyrosine hydroxylase in the same type of sections (Fig. 1) and by HPLC analyses of the CAs (Vicario et al. 2000) in homogenates of ‘small pieces’ of the CB. Levels of endogenous dopamine (597.9 ± 120.8 pmol (mg tissue)−1) and of noradrenaline (708.0 ± 123.3 pmol (mg tissue)−1), as well as dopamine/noradrenaline ratios (0.86 ± 0.09) found in 12 samples of calf carotid bodies, are comparable to those previously reported for the cat CB (see Gonzalez et al. 1994).
Figure 1. Histological identification of the calf carotid body.
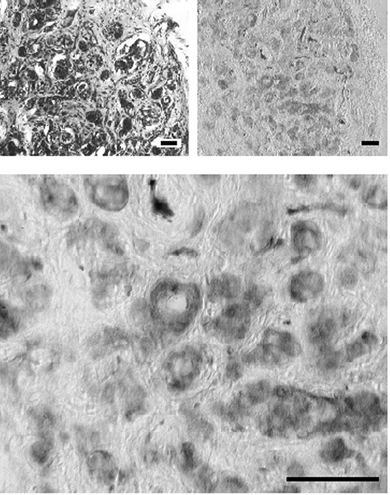
Top left shows a low magnification cryostat section stained with cresyl violet evidencing the typical clusters of glomic tissue in the vicinity of capillaries. Top right shows a cryostat section immunostained for tyrosine hydroxylase and developed with diaminobenzidine after incubation with a secondary antibody conjugated with peroxidase. Note the cluster-like distribution of the carotid body tissue positive to tyrosine hydroxylase. Bottom shows a detail of the previous section at higher magnification. Calibration bars are 50 μm.
For release experiments (see following section), the calf CBs (10–20 mg) were cut into ‘small pieces’ of 0.5–2 mg and each piece was treated as an individual rabbit CB. To measure GSH and GSSG, five CBs were pooled to obtain samples of 50 mg or more.
Labelling of the catecholamine (CA) deposits and release of labelled CA
The six to 12 rabbit CBs or calf CB pieces used per experiment were incubated (2 h; 37 °C) in Tyrode solution containing 100 μm 6-methyl-tetrahydropterine (a tyrosine hydroxylase cofactor; Sigma, Madrid), 1 mm ascorbic acid (a cofactor of dopamine-β-hydroxylase) and 40 μm of the catecholamine natural precursor 3H-tyrosine (20 Ci mmol−1; Amersham Ibérica, Madrid). Each rabbit CB (∼0.4 mg) synthesized ∼12 pmol of 3H-dopamine (3H-DA; ∼3 × 10⁵ d.p.m.) and ∼1 pmol of 3H-noradrenaline (3H-NA; ∼2.5 × 10⁴ d.p.m.) (Obeso et al. 1992). Twelve pieces of calf CB (from four different animals) analysed by HPLC (Vicario et al. 2000) contained 28.6 ± 4.0 pmol (mg tissue)−1 of 3H-DA and 0.56 ± 0.06 pmol (mg tissue)−1 of 3H-NA.
At the end of the labelling period, CBs were transferred to new vials (one rabbit CB or a piece of calf CB per vial) containing 4 ml of precursor-free Tyrode bicarbonate solution (24 mm NaCl was replaced with 24 mm NaHCO3). Incubating solutions were continuously bubbled with 21 % O2-5 % CO2 (balanced with nitrogen) saturated with water vapour. During a period of 2 h the solution was renewed every 30 min and discarded; in this washing period most of the precursor and the labile pool of 3H-CA are lost; afterwards the basal release of 3H-CA decays monotonically (Obeso et al. 1999). After this washing period the release experiment was started and the incubating solutions were renewed every 10 min and collected for analysis of their 3H-CA content. To study the effects of NAC on the basal release of 3H-CA, the CBs were incubated with normoxic solutions (equilibrated with 21 % O2-5 % CO2) for 90 min, and during 50 min (from minutes 20 to 70) the solutions contained NAC at concentrations from 20 μm to 10 mm. To study the effects of NAC on the stimulus-evoked release of 3H-CA the CBs were stimulated twice (from minutes 20 to 30 and from minutes 100 to 110) by incubating them with hypoxic (7 % O2) or high K+ (35 mm)-containing solutions; NAC was applied prior to and during the second stimulus application (minutes 60 to 110; see Fig. 5). The stimulus-evoked release of 3H-CA was calculated as the d.p.m. above basal normoxic release and expressed as a percentage of the tissue content prior to the application of the stimulus. The 3H-CA tissue content at a given moment was calculated by adding together the 3H-CA present in the tissue at the end of the experiment and the 3H-CA present in the solutions collected between the moment of interest and the end of the experiment. The effect of NAC on the stimulus-evoked release of 3H-CA was assessed by comparing the ratios of the evoked release in the second presentation of the stimulus to that of the first (S2/S1) in NAC-treated CBs, with those ratios obtained in drug-free CBs. In an additional group of experiments, the effects of NAC on the release of 3H-CA elicited by the Ca2+ ionophore ionomycin were studied. In these experiments, the ionophore was applied only once (from minutes 60 to 70) due to the difficulty of washing it out, and the amounts of 3H-CA released in control and NAC-treated (from minutes 20 to 70) CBs were compared. At the end of the experiment, the CBs were immersed in 0.4 n perchloric acid, glass-to-glass homogenized at 0 °C, centrifuged for 10 min in a Beckman microfuge in a cold room. The supernatant and the incubation media were processed for analysis of 3H-CA. The analysis included the following: acidification of the collected incubating solutions to pH 3.2 with a mixture of glacial acetic and ascorbic acid to avoid degradation of CA; bulk adsorption into alumina of all released catechols at a pH of 8.6 - achieved by addition of 2.5 m Tris buffer at pH 8.6; and intense washing of alumina columns with distilled water and bulk elution of all catechols with 1 ml 1 n HCl. The alumina eluates were counted in a liquid scintillation spectrometer and the released 3H-CA expressed as d.p.m. per 10 min (Fidone et al. 1982; Obeso et al. 1992).
Figure 5. General protocol to study the effects of N-acetylcysteine (NAC) on the release of 3H-CA induced by hypoxia in the calf and rabbit CB.
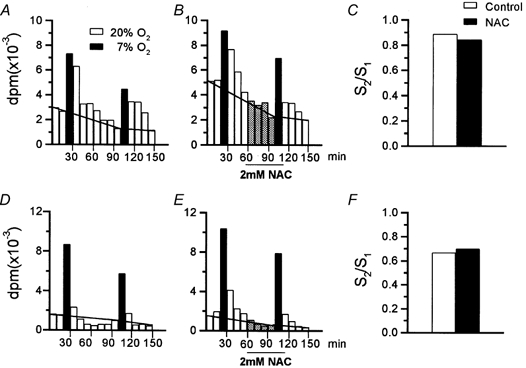
A–C refer to the calf CB and depict a typical experiment with a pair of CBs showing the protocol used to test the effect of NAC (2 mm) on the release of 3H-CA elicited by hypoxic stimulation (10 min incubation in a solution equilibrated with 7 % O2-5 % CO2 balanced with N2, filled bars). The horizontal lines crossing the histograms in A and B of the figure separate the basal release (below) from the stimulus-evoked release (above the lines). C, the ratio of the low PO2-evoked release (d.p.m.) in the second presentation of the stimulus (S2) to that in the first presentation (S1). D–F show an identical experiment carried out with a pair of rabbit CBs.
Measurement of GSH and GSSG
Three to five calf CBs/samples were cut into small pieces and incubated for 40 min at 37 °C in 20 % O2-5 % CO2-equilibrated Tyrode bicarbonate solution to allow the recovery of tissue after the surgical manipulations (Obeso et al. 1985). In control CBs, the incubating solution was renewed at minutes 40, and the incubation was maintained for a further 10 min. In hypoxic CBs this last incubation of 10 min was made in a solution equilibrated with 5 % O2- 5 % CO2. NAC-treated samples were incubated as controls, but solutions contained 2 mm NAC. After incubation, tissues were placed in Eppendorf tubes containing 100 μl of 5 % 5-sulfosalicylic acid (SSA; Sigma) and 0.25 mm ethylenediaminetetraacetic acid (EDTA) to prevent oxidation of GSH and to inhibit GSH-utilizing enzymes. After 10 min in SSA, the tissues were weighed and the volume of SSA solution was brought to 5 × tissue weight. Tissues were glass-to-glass homogenized at 0 °C, centrifuged (10 min; 4 °C) in a microfuge and the supernatant used to measure GSH and GSSG.
Measurements were made using Griffith's (1980) method (see Punchard & Kelly, 1996). GSH reacts non-enzymatically with 5,5′-dithiobis-(2-nitrobenzoic acid) (DTNB) to generate GSSG and the highly coloured 5-thio-2-nitrobenzoic acid (TNB; peak absorbance at 420 nm); the GSSG formed is back-reduced to GSH by glutathione reductase coupled to NADPH oxidation. In this cycling assay, concentrations of the reactants are chosen so that the rate of colour formation is linear with time, with the slope of the line (Δabsorbance/Δtime (min); ΔA/Δt (min)) being directly proportional to the concentration of total glutathione (GSH + GSSG; GSt). This allows the computer-assisted on-line construction of standard curves relating GSt concentrations to the slopes of their assays. Since this relationship is linear, it is possible to measure the concentration of GSt in identically treated test samples by interpolation. GSSG was similarly determined except that (1) GSH is masked by derivatization with 2-vinylpyridine, and (2) the size of the sample is higher owing to the much lower concentration of GSSG than of GSH. Standards and tissue homogenates were assayed in triplicate. Assay mixtures contained: 700 μl of daily-prepared 0.3 mm NADPH solution, 100 μl of 6 mm DTNB solution stored at −20 °C, 200 μl of water minus the sample volume (1–5 μl of supernatant for GSt and up to 20 μl for GSSG; 1 μl is equivalent to 0.2 mg tissue; blanks contained a volume identical to the sample volume of 4.31 % SSA) and glutathione reductase (Sigma, cat. no. G3664; 1 and 5 units for GSt and GSSG assays, respectively). All reactants were dissolved in a phosphate buffer (0.125 mm; pH 7.5) containing EDTA at 6.3 mm. Measurements of glutathione were not possible in the rabbit CB. Its small size (∼400 μg per CB) would require at least six animals per single unduplicated value.
Statistics
Significance of the differences observed between groups was assessed by the use of Student's two-tail t test for unpaired data. Means ± s.e.m. are given.
RESULTS
Validation of the glutathione assay: glutathione levels in the calf CB
The lack of data on the levels of glutathione in the CB and the need for using high concentrations of NAC, which might react with DTNB, the colour generating reactant of the assay (Punchard & Kelly, 1996), suggested that the assay should be validated by intraexperimentally measuring glutathione in the CB and in tissues with known glutathione levels. It was also necessary to construct standard curves with concentrations of NAC similar to those used in our experiments. Rat liver GSt and GSSG contents were 5.91 ± 0.78 and 0.11 ± 0.03 nmol (mg fresh tissue)−1, respectively, (n = 7) which are within the range of most published works (Fig. 2A; Halliwell & Gutteridge, 1999). In the calf CBs, the levels of GSt and GSSG assayed in parallel were lower, 0.82 ± 0.10 (n = 6) and 0.025 ± 0.003 nmol (mg fresh tissue)−1 (n = 6), respectively (Fig. 2B). The ratios GSH/GSt for rat liver and calf CB were 0.98 ± 0.007 and 0.95 ± 0.014, respectively (Fig. 2C). The GSH/GSSG ratio, which is an alternative way of expressing the relative proportions of GSH and GSSG, was over 50 for the rat liver and over 30 for the CB. Standard curves made for GSH and GSSG dissolved in control solutions (phosphate buffer- EDTA- SSA) and in solutions containing 2 mm NAC were almost indistinguishable (Fig. 2D and E).
Figure 2. Validation of the glutathione assay conditions.
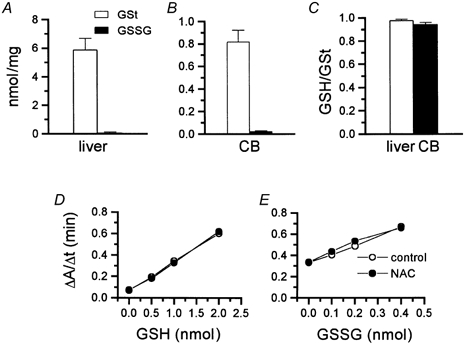
A and B, total (GSt) and oxidized glutathione (GSSG) levels in the rat liver and calf carotid body (CB), respectively. C, reduced to total glutathione (GSH/GSt) ratios in the rat liver and calf carotid body. D and E, standard curves for reduced (D) and oxidized (E) glutathione in control conditions and in the presence of NAC. Least-squares linear fitting for the GSt curves were: y = 0.27x + 0.07 for control and y = 0.27x+ 0.06 for NAC-containing samples (r2 > 0.99 in both cases). For GSSG curves the equations were: y = 0.85x+ 0.32 (r2 > 0.99) for control and y = 0.80x + 0.35 (r2 > 0.98) for NAC-containing samples. Assay mixtures consisted of 700 μl of a 0.3 mm NADPH solution prepared daily, 100 μl of a 6 mm DNTB solution stored at −20 °C in aliquots to be used in a given day, 200 μl of water minus sample volume (1–5 μl of supernatant, equivalent to 0.2–1.0 mg tissue, for GSt and up to 20 μl, equivalent to up to 4 mg tissue, for GSSG; blanks contained a volume identical to the sample volume of 4.31 % SSA) and glutathione reductase (1 unit and 5 units for GSt and GSSG assays, respectively). All reactants were dissolved in a phosphate buffer (0.125 mm; pH 7.5) containing EDTA at 6.3 mm.
Effect of hypoxia and NAC treatment on the CB glutathione levels
The glutathione contents measured in 12 normoxic (incubated at PO2∼ 133 mmHg), 10 hypoxic (PO2∼ 33 mmHg) and six NAC-treated (PO2∼ 133 mmHg; 2 mm NAC) CB tissue samples are shown in Fig. 3. Absolute levels of GSt in normoxic tissues were 0.71 ± 0.07 nmol (mg tissue)−1, in hypoxic tissues 0.76 ± 0.07 nmol (mg tissue)−1 and in NAC-treated tissues 1.03 ± 0.06 nmol (mg tissue)−1 (P < 0.02 vs. previous groups); GSSG levels in normoxic, hypoxic and NAC-treated tissues amounted, respectively, to 0.026 ± 0.003, 0.034 ± 0.009 and 0.019 ± 0.002 nmol (mg tissue)−1 (Fig. 3A). The GSH/GSSG ratios in the groups are shown in Fig. 3B. They were 30.14 ± 4.67 in the normoxic group, 33.03 ± 6.88 in the hypoxic group and 59.05 ± 5.05 in the NAC-treated group (P < 0.001 and P < 0.02 vs. the normoxic and hypoxic group, respectively). The data indicate that hypoxia of moderately high intensity did not significantly alter GSH/GSSG levels or ratios in the CB while NAC treatment significantly increased GSH levels and GSH/GSSG ratios.
Figure 3. Effects of hypoxia and N-acetylcysteine (NAC) on glutathione levels in the calf carotid body.
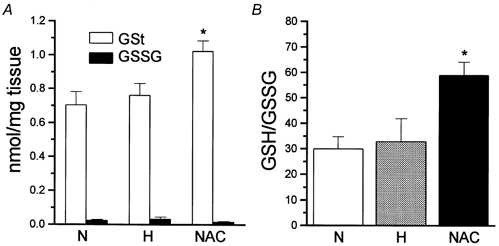
A, levels of total (GSt) and oxidized glutathione (GSSG) in normoxic (N), hypoxic (H) and NAC-treated (NAC) CBs. B, reduced to oxidized glutathione ratios in normoxic, hypoxic and NAC-treated CBs. Data are means ± s.e.m. and n = 12 (normoxic), n = 10 (hypoxic) and n = 6 (NAC-treated). *P < 0.02.
Effects of NAC on normoxic and hypoxic release of 3H-CA from the calf and rabbit CB
According to one redox model of O2 sensing (see Introduction), the increase in the GSH/GSSG ratio (and the decrease in ROS levels, see Dent et al. 1997; Villagrasa et al. 1997; Halliwell & Gutteridge, 1999) produced by NAC treatment should trigger a neurosecretory response in normoxia and potentiate the secretory response induced by a moderate hypoxic stimulus. According to the other redox model it should produce the opposite effect. Therefore, we tested for the capacity of NAC to alter the release of 3H-CA from the CB of calf, a species in which we have measured GSH levels, and from the CB of rabbit, a species whose release of 3H-CA is well characterized (Fidone et al. 1982; Obeso et al. 1992, 1999). The time courses (50 min) of the effects of several concentrations of NAC (20 μm to 10 mm) on the normoxic release of 3H-CA in the calf and rabbit CB are shown in Fig. 4A and B, respectively. None of the concentrations altered the ongoing normoxic release of 3H-CA in the CB of either species.
Figure 4. Effect of several concentrations of N-acetylcysteine (NAC) on the basal release of 3H-CA in the calf (A) and the rabbit CB (B).
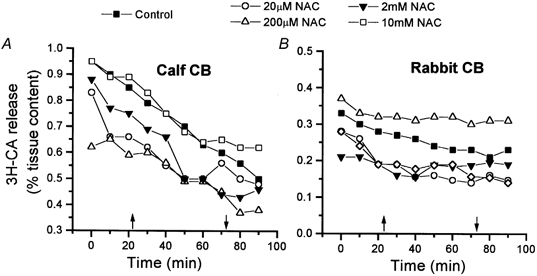
N-Acetylcysteine at the concentrations shown was present in the incubating solution for 50 min (between arrows). Data are means of 10–12 individual values for the calf and 5–8 individual values for the rabbit. Standard error (< 15 %) bars have been eliminated for clarity.
The effect of NAC on the release of 3H-CA elicited by hypoxia (PO2∼ 46 mmHg; 10 min) was studied in pairs of CBs. The CBs were stimulated twice in the absence (control) or the presence (experimental) of 2 mm NAC applied during the 40 min prior to and during the 10 min of the second hypoxic stimulus (Fig. 5A and B, calf CB; Fig. 5D and E, rabbit CB). The ratios of the evoked release in the second/first stimulus (S2/S1) for control and experimental CBs in this particular experiment were calculated and plotted in Fig. 5C (calf) and Fig. 5F (rabbit). Figure 6 shows the mean S2/S1 obtained in control and NAC-treated calf CB pieces and intact rabbit organs. In the calf CB tissues, the S2/S1 ratio in control organs was 0.73 ± 0.12 (n = 10) and in NAC-treated tissues it was 0.71 ± 0.12 (n = 10). In the rabbit CB, the S2/S1 ratios in control and NAC-treated CBs were, respectively, 0.52 ± 0.07 and 0.61 ± 0.10 (n = 12). The observed differences were not statistically significant. In an additional experiment with calf CB tissue, NAC was applied for only 10 min prior to and during the 10 min of hypoxic stimulation. The S2/S1 ratios obtained in this experiment were not statistically different in control (0.83 ± 0.14; n = 6) and NAC-treated CB pieces (0.73 ± 0.08; n = 6) (data not shown). In all these experiments (see Fig. 5B and E), the lack of effect of 2 mm NAC on the basal release of 3H-CA was confirmed.
Figure 6. Effects of N-acetylcysteine (NAC) on the neurosecretory response elicited by hypoxia in chemoreceptor cells of the CB.
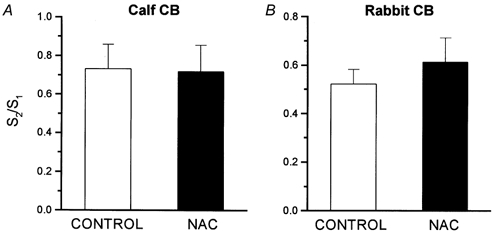
The figure shows means ± s.e.m. of S2/S1 ratios obtained in 10 experiments like that shown in Fig. 5 for the calf CB (A) and 12 experiments with rabbit CBs (B).
Effects of NAC on the release of 3H-CA induced by high external K+ and ionomycin in the calf and rabbit CB
In permeabilized chromaffin cells it was demonstrated that sulfhydryl reagents blocked Ca2+-induced CA secretion, suggesting that thiol groups of proteins involved in the exocytotic machinery were critical in controlling the release process (Augustine et al. 1987). Recently, two N-ethylmaleimide-sensitive factors controlling neurotransmitter release have been identified at the molecular level (Schweizer et al. 1998). In addition, Ca2+ channels, which are known to participate in the release of CA induced by hypoxia (Obeso et al. 1992), are also regulated by redox agents (Fearon et al. 1999). Therefore, the possibility exists that the effects of the altered GSH/GSSG quotients produced by NAC at the O2-sensing machinery are masked by modifications of thiol groups and disulfide bonds in cell proteins located downstream in the transduction cascade (i.e. Ca2+ channels and/or exocytotic machinery). To test this possibility, we have studied the effects of NAC on the release of 3H-CA induced by high extracellular K+ and by ionomycin. The release response induced by high K+ presumably involves all the processes of the hypoxic response except the O2-sensing step (Gonzalez et al. 1994), and the response elicited by ionomycin bypasses all the steps of the hypoxic release except exocytosis itself (Obeso et al. 1992).
The protocols for the experiments with high extracellular K+ (35 mm) were identical to those used for hypoxia. The S2/S1 ratios for control and NAC-treated calf CB tissues were 0.54 ± 0.06 and 0.51 ± 0.04, respectively (n = 10; Fig. 7A); in the rabbit CBs the ratios were 0.64 ± 0.07 (n = 7) for control and 0.77 ± 0.08 (n = 7) for NAC-treated tissues (Fig. 7B). In neither species was the difference statistically significant. In the experiments with ionomycin, the ionophore (20 μm) was applied only once to control and to NAC-treated CB tissues. Figure 8A and B shows a single experiment carried out in a pair of rabbit CBs. Note the absence of effect of NAC on the basal release and the similarity of the magnitude and time course of the release induced by ionomycin (d.p.m. above dotted horizontal lines in the figures) in the absence and in the presence of NAC. The 3H-CA released by ionomycin in the calf CBs represented 18.9 ± 1.8 % of the tissue content in control organs and 17.26 ± 1.12 % in NAC-treated tissues (n = 10; P > 0.05; Fig. 8C). In the rabbit CBs ionomycin released 10.94 ± 1.71 % and 10.77 ± 1.39 % of the 3H-CA content in control and NAC-treated tissues, respectively (n = 10; P > 0.05; Fig. 8D).
Figure 7. Effects of N-acetylcysteine (NAC) on the neurosecretory response elicited by high external K+ in chemoreceptor cells of the CB.
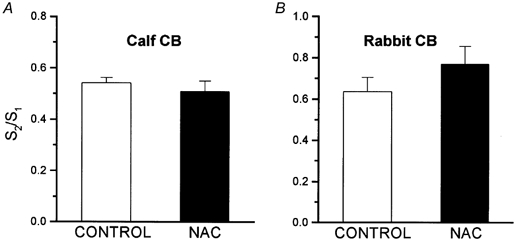
Experimental protocol was as given in Fig. 5. S2/S1 ratios in control and NAC-treated calf (A) and rabbit (B) CBs refer to two sequential stimulations with high external K+ (incubation with 35 mm K+ for 10 min). Data are means ± s.e.m. of 10 individual values for the calf CBs and 7 individual values for the rabbit CBs. The differences between control and NAC-treated organs are not statistically significant.
Figure 8. Effects of N-acetylcysteine (NAC) on the release of 3H-CA elicited by ionomycin in the rabbit and calf CBs.
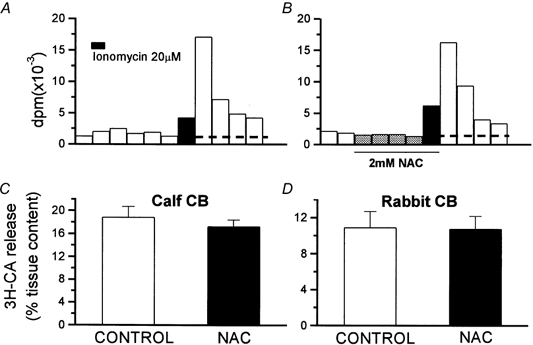
A and B, a single experiment with a pair of rabbit CBs to illustrate the protocol followed in studying the effects of NAC on the release of 3H-CA induced by ionomycin. The horizontal lines crossing the bars separate the basal (below the line) from the ionomycin-evoked (above the line) release of 3H-CA. C and D, means of the release evoked by ionomycin (expressed as a percentage of tissue content) in the control and NAC-treated calf (C; n = 10) and rabbit CBs (D; n = 10). The differences observed were not statistically significant.
DISCUSSION
The aim of the present work has been to test some of the premises of the redox models of O2 chemoreception. Specifically, we have measured the GSH/GSSG ratio in normoxic and hypoxic CBs to verify if hypoxia alters this quotient in a given direction. Additionally, we have experimentally increased the GSH/GSSG ratio by treatment of the CBs with NAC to determine the modifications of the neurosecretory response (release of 3H-CA) of chemoreceptor cells produced by this experimental manoeuvre. The results indicate that hypoxic stimulation of CBs at moderately high intensity (PO2∼ 33 mmHg) does not alter the GSH/GSSG quotient. The increase in the GSH/GSSG quotient produced by NAC does not alter the normoxic release of 3H-CA nor the release response elicited by hypoxia, high external K+ and the Ca2+ ionophore ionomycin.
At the outset of the discussion, it might be of interest to clarify some aspects of the metabolism of 3H-CAs, including the significance of their secretion during CB stimulation and their putative physiological role in chemoreception. Chemoreceptor cells detect PO2 and respond to graded hypoxia with a proportional increase in the release of CA (mostly DA) (see Gonzalez et al. (1994) for data in the rabbit and cat, and Vicario et al. (2000) for data in the rat). Therefore, even if the significance of CA in CB function is in dispute (Gonzalez et al. 1997vs.Zapata, 1997), the release of CA represents a direct measure of the output of the hypoxic chemoreception in chemoreceptor cells. However, it should also be mentioned that on repetitive stimulation of the CB (Donnelly, 1995), the release of 3H-CA tends to decrease while the postsynaptic response decreases with a slower time course, as is the case in many other catecholaminergic structures (for references, see Gonzalez et al. 1997).
In the case of the calf CB, the data available on the metabolism of CA are scarce. Bader et al. (1981) using fluorometric methods found that the calf CB is, like the cat CB, a mixed dopaminergic and noradrenergic organ with levels of DA and NA of ∼500 and 600 nmol (g fresh tissue)−1, respectively. The data of the present study (endogenous DA and NA levels of 597.9 ± 120.8 and 708.0 ± 123.3 pmol (mg tissue)−1, respectively, n = 12; synthesis rates of 28.6 ± 4.0 pmol (mg tissue)−1 (2 h)−1 for 3H-DA and 0.56 ± 0.06 pmol (mg tissue)−1 (2 h)−1 for 3H-NA), confirm the mixed noradrenergic-dopaminergic nature of the calf CB with NA levels slightly higher than DA levels, as is the case in the cat CB (Gonzalez et al. 1994). These data indicate that in the calf, as in other species, the turnover rate for DA is much higher than for NA (Gonzalez et al. 1994; Vicario et al. 2000). Therefore, the findings would suggest that in all species studied DA should be more significant than NA in chemoreceptor signalling at the chemoreceptor cell-sensory nerve ending synapse. The release of 3H-CA induced by moderate hypoxia, high external K+, ionomycin (Figs 5–8) and intense hypoxia (2 % O2; not shown) in the calf CB compares favourably with the release observed in the rabbit CB.
The absolute levels of GSt and the GSH/GSt ratios of almost 1.0, which we found in the liver, are comparable to those found by other authors (Halliwell & Gutteridge, 1999). In the CB, the GSH/GSt ratio is comparable, but the absolute levels of GSt are lower than the levels found in the rat liver, and more like those reported for rat brain (Halliwell & Gutteridge, 1999). The assay was linear for both forms of glutathione in the range of concentrations found in the CB, and the linearity was not affected by the presence of NAC. Although NAC contains a sulfhydryl group that might react with 5,5′-dithiobis-(2-nitrobenzoic acid) (DTNB) - the colour-generating reagent in the assay mixture - the enzymatic cycling mediated by glutathione reductase provides the required assay specificity to measure glutathione, and prevents the interference by other compounds having the sulfhydryl group (Punchard & Kelly, 1996). Therefore, the levels of glutathione measured in the CB correspond to genuine GSt and GSSG.
The first specific aim of our work was to test for the effects of hypoxia on GSH/GSSG ratios in the CB. The strength of the hypoxic stimulus selected to measure glutathione was of moderately high intensity (PO2∼ 33 mmHg) in order to attain a good level of chemoreceptor cell activation without compromising cell functioning during the period of stimulation. As Fig. 3 shows, 10 min of stimulation with hypoxia of moderately high intensity did not significantly alter the levels or the GSH/GSSG ratio. This finding does not support the principal assumption of one of the redox models for oxygen sensing in chemoreceptor cells. This proposal is that hypoxia acts via an increase in GSH/GSSG ratio with subsequent reduction of disulfide bonds in K+ channel proteins (Archer et al. 1993; Acker & Xue, 1995; Lahiri & Acker, 1999), which in turn decreases the opening probability of K+ channels to produce chemoreceptor cell depolarization and release of neurotransmitters. Our findings would indicate that hypoxia activates chemoreceptor cells to promote neurotransmitter release without altering the GSH/GSSG quotient. However, the negative result, i.e. the lack of effect of hypoxia on glutathione level and GSH/GSSG quotient in the entire calf CB, could be a ‘false’ negative. Due to the heterogeneity of the CB, with chemoreceptor cells representing less than 50 % of the CB tissue (Verna, 1997), the possibility exists that hypoxia is in fact altering the GSH/GSSG ratio in chemoreceptor cells, as the redox models propose, but that this effect is undetectable with assay of the entire organ. If this were the case, our conclusions would be unjustified.
To circumvent this potential pitfall, we have used the strategy of increasing the GSH/GSSG quotient and of decreasing ROS levels (Dent et al. 1997; Villagrasa et al. 1997; Halliwell & Gutteridge, 1999) in all cell types of the CB by incubating the organs with NAC and by measuring the release of 3H-CA as a specific parameter of the activation of chemoreceptor cells. If the redox models are correct, NAC should mimic hypoxia and evoke the release of 3H-CA even in normoxic conditions and potentiate the release response evoked by submaximal hypoxic stimuli (or it should inhibit the release, according to the alternative redox model; see Introduction). As expected (Dent et al. 1997; Villagrasa et al. 1997; Halliwell & Gutteridge, 1999), incubation of the calf CB with 2 mm NAC for 50 min was effective in increasing the levels of GSt (Fig. 3A) with almost no change in GSSG (Fig. 3A), and therefore increasing the GSH/GSSG quotient (Fig. 3B). It was at the same time ineffective for altering the basal normoxic release of 3H-CA in the calf and in the rabbit CB (Fig. 4). Thus, it seems that the increase in the GSH/GSSG quotient per se is not a sufficient requirement for activation of the neurosecretory response of chemoreceptor cells, as occurs with hypoxia. Additionally, the treatment with NAC was also ineffective for augmenting the release response elicited by a moderate hypoxic stimulus (Fig. 5 and Fig. 6). Once again, these findings argue against the redox models of oxygen chemoreception. The argument is reinforced by the demonstration that NAC treatment does not alter downstream steps in the neurosecretory response, because the release of 3H-CA elicited by high external K+ and ionomycin (Fig. 7 and Fig. 8) was not different in control and NAC-treated CBs.
Taken together, our findings do not support the redox models of O2 sensing. These models, which envision ROS and GSH/GSSG ratios as playing a critical role in the process, occupy a mainstream position amongst current theories of O2 sensing in the CB and pulmonary vessels. The redox hypothesis, or redox model, was first proposed by Archer et al. (1986) as the mechanism triggering hypoxic pulmonary vasoconstriction. They postulated that O2, through the generation of ROS during oxidative metabolism, controls the redox status of the cells as represented by the ratios GSH/GSSG and NADPH/ NADP. Archer and co-workers (1986) reasoned that the rate of ROS production would parallel tissue PO2 and therefore hypoxia would diminish the production of ROS. The decrease in ROS production would in turn lead to a decrease in the activity of glutathione peroxidase and to an increase in the GSH/GSSG ratio. The final step in the cascade leading to hypoxic vasoconstriction (as formulated at the time) was that a reduced status in the cells would activate Ca2+ influx and the contracting response. The description of O2-sensitive K+ currents in CB chemoreceptor cells (López-Barneo et al. 1988) was soon followed by the description of such currents in pulmonary artery smooth muscle cells (Post et al. 1992) and the ROS hypothesis in these cells changed to accommodate the new findings. Therefore, more recent proposals (Archer et al. 1993, 1999) postulate that a decrease of ROS and/or an increase in the GSH/GSSG quotient would lead to a decrease in the open probability of K+ channels and cell depolarization, as a critical and initial step in the low PO2 transduction cascade. With minimal modifications, Acker's group imported the redox model for O2 sensing into the arterial CB chemoreception field (Acker & Xue, 1995; Lahiri & Acker, 1999). Redox models for O2 sensing gained wide support from the observation that many types of K+ channels change their gating properties when entire cells or isolated membrane patches are exposed to reducing or oxidizing agents, including dithiothreitol, GSH and H2O2 (e.g. Ruppersberg et al. 1991; Vega-Saez de Miera & Rudy, 1992; López-Barneo et al. 1999), albeit not always in the direction adequate for the hypothesis (Thuringer & Findlay, 1997; Liu et al. 1999; Lang et al. 2000). In addition, in a recent study from our laboratory (Perez-Garcia et al. 1999), we demonstrated that O2 sensing is not equivalent to reduction of the sulfhydryl groups of channel proteins. Finally, several recent studies in different cell types indicate that hypoxia increases ROS levels (Marshall et al. 1996; Chandel et al. 1998; Hohler et al. 1999; see Chandel & Shumacker, 2000), implying that low PO2 activates, instead of inhibiting, ROS production, and therefore the GSH/GSSG ratio decreases instead of increasing. However, the present study does not suggest that an increase in ROS or a decrease in GSH/GSSG is a significant signal in O2 chemoreception in the CB, because NAC, which increases the GSH/GSSG ratio and decreases ROS levels (Dent et al. 1997; Villagrasa et al. 1997; Halliwell & Gutteridge, 1999), does not affect the hypoxic transduction cascade leading to the neurosecretory response. In this regard, we should stress the observations of Hohler et al. (1999), which show that the upregulation of tyrosine hydroxylase caused by hypoxia in PC12 cells (hypoxia also upregulates tyrosine hydroxylase in chemoreceptor cells, see Gonzalez et al. 1994 for references) is paralleled, but not induced, by increased ROS production during the hypoxic exposure. A lack of relationship between ROS production/levels, on the one hand, and chemoreceptor and pulmonary artery smooth muscle cell activation, on the other, is also inferred from the well-known observation that mitochondrial poisons, including rotenone, which decreases, and cyanide, which increases, ROS levels (Archer et al. 1993; Chandel & Schumacker, 2000), are both powerful chemostimulants (Zapata, 1997) and both produce pulmonary artery vasoconstriction (Archer et al. 1993).
Two final aspects of this study deserve consideration. The first relates to the meaning of the GSH/GSSG ratio, which we have measured as an index of the redox state of the cells. According to Archer et al. (1986), the ratios GSH/GSSG and NADPH/NADP represented the redox status of the cells in their formulation of the redox model, and indeed this is the case. However, since GSH/GSSG and NADPH/NADP pairs are intimately linked by glutathione reductase, which reduces GSSG to GSH using NADPH as cofactor, both quotients vary in parallel, and the measurement of one of them provides an adequate index of the redox status of the cells (Halliwell & Gutteridge, 1999). In fact, there exists an interrelationship of the equilibria among the different redox pairs and ROS, such that the measurement of one of the elements (i.e. any ROS or any of the redox pairs) would provide an adequate index of the redox status of the cells. The second aspect relates to the possible origin of discrepancies regarding the effects of hypoxia in decreasing or increasing ROS levels and production. In Semenza's opinion, the discrepancies are most likely to be related to the demanding methodology used to directly measure these molecules (see Semenza, 2000). They do not seem to reflect cell specificity (Semenza, 2000) or different parameters of the hypoxic stimulus (e.g. duration or intensity), because Kietzmann et al. (1998), who found that hypoxia decreases the rate of ROS production, used hypoxic stimuli of similar duration and intensity to those used by Chandel et al. (1998) and found that hypoxia increases ROS production and levels.
In conclusion, the present study demonstrates that hypoxic stimuli of moderately high intensity do not affect the GSH/GSSG ratio in CB tissue. Incubation of CBs with NAC, an antioxidant and GSH precursor, augmented the GSH/GSSG ratios (and presumably reduced ROS levels), but did not activate or inhibit chemoreceptor cells, as judged by the lack of effect on the basal (normoxic) and hypoxia-induced release of 3H-CA. Potential side effects of NAC on the exocytotic machinery, which might mask the effects of NAC on prior steps of the low PO2 transduction cascade, were excluded by demonstrating that NAC is unable to alter the activation of chemoreceptor cells produced by high external K+ and ionomycin. Our data do not support the redox models of O2 sensing in the chemoreceptor cells of the CB.
Acknowledgments
This work was supported by Spanish DGICYT grant PB97/0400. We are grateful to M. de los Llanos Bravo for technical assistance. We thank Professor Sal Fidone for his critical reading of the manuscript.
References
- Acker H, Xue D. Mechanisms of O2 sensing in the carotid body in comparison with other O2-sensing cells. News in Physiological Sciences. 1995;10:211–215. [Google Scholar]
- Archer SL, Huang J, Henry T, Peterson D, Weir EK. A redox-based O2 sensor in rat pulmonary vasculature. Circulation Research. 1993;73:1100–1112. doi: 10.1161/01.res.73.6.1100. [DOI] [PubMed] [Google Scholar]
- Archer SL, Reeve HL, Michelakis E, Puttagunta L, Waite R, Nelson DP, Dinauer MC, Weir EK. O2 sensing is preserved in mice lacking the gp91 phox subunit of NADPH oxidase. Proceedings of the National Academy of Sciences of the USA. 1999;96:7944–7949. doi: 10.1073/pnas.96.14.7944. [DOI] [PMC free article] [PubMed] [Google Scholar]
- Archer SL, Will JA, Weir EK. Redox status in the control of pulmonary vascular tone. Herz. 1986;11:127–141. [PubMed] [Google Scholar]
- Augustine GJ, Charlton MP, Smith SJ. Calcium action in synaptic transmitter release. Annual Review of Neuroscience. 1987;10:633–693. doi: 10.1146/annurev.ne.10.030187.003221. [DOI] [PubMed] [Google Scholar]
- Bader B, Bartels J, Thorn W. Biosynthesis of catecholamines in bovine carotid body. Molecular Physiology. 1981;1:273–285. [Google Scholar]
- Chandel NS, Maltepe E, Goldwasser E, Mathieu CE, Simon MC, Schumacker PT. Mitochondrial reactive oxygen species trigger hypoxia-induced transcription. Proceedings of the National Academy of Sciences of the USA. 1998;95:11715–11720. doi: 10.1073/pnas.95.20.11715. [DOI] [PMC free article] [PubMed] [Google Scholar]
- Chandel NS, Schumacker PT. Cellular oxygen sensing by mitochondria: old questions, new insight. Journal of Applied Physiology. 2000;88:1880–1889. doi: 10.1152/jappl.2000.88.5.1880. [DOI] [PubMed] [Google Scholar]
- Dent G, Rabe KF, Magnussen H. Augmentation of human neutrophil and alveolar macrophage LTB4 production by N-acetylcysteine: role of hydrogen peroxide. British Journal of Pharmacology. 1997;122:758–764. doi: 10.1038/sj.bjp.0701428. [DOI] [PMC free article] [PubMed] [Google Scholar]
- Donnelly DF. Does catecholamine secretion mediate the hypoxia-induced increase in nerve activity? Biological Signals. 1995;4:304–309. doi: 10.1159/000109457. [DOI] [PubMed] [Google Scholar]
- Dvorakova M, Hohler B, Vollerthun R, Fischbach T, Kummer W. Macrophages: a major source of cytochrome b558 in the rat carotid body. Brain Research. 2000;852:349–354. doi: 10.1016/s0006-8993(99)02156-3. [DOI] [PubMed] [Google Scholar]
- Fearon IM, Palmer AC, Balmforth AJ, Ball SG, Varadi G, Peers C. Modulation of recombinant human cardiac L-type Ca2+ channel α1C subunits by redox agents and hypoxia. Journal of Physiology. 1999;514:629–637. doi: 10.1111/j.1469-7793.1999.629ad.x. [DOI] [PMC free article] [PubMed] [Google Scholar]
- Fidone S, Gonzalez C, Yoshizaki K. Effects of low oxygen on the release of dopamine from the rabbit carotid body in vitro. Journal of Physiology. 1982;333:93–110. doi: 10.1113/jphysiol.1982.sp014441. [DOI] [PMC free article] [PubMed] [Google Scholar]
- Fu XW, Wang D, Nurse CA, Dinauer MC, Cutz E. NADPH oxidase is an O2 sensor in airway chemoreceptors: evidence from K+ current modulation in wild-type and oxidase-deficient mice. Proceedings of the National Academy of Sciences of the USA. 2000;97:4374–4379. doi: 10.1073/pnas.97.8.4374. [DOI] [PMC free article] [PubMed] [Google Scholar]
- Gleadle JM, Ebert BL, Ratcliffe PJ. Diphenyleneiodonium inhibits the induction of erythropoietin and other mammalian genes by hypoxia. European Journal of Biochemistry. 1995;234:92–99. doi: 10.1111/j.1432-1033.1995.092_c.x. [DOI] [PubMed] [Google Scholar]
- Gonzalez C. Sensitivity to physiologic hypoxia. In: López-Barneo J, Weir EK, editors. Oxygen Regulation of Ion Channels and Gene Expression. Armonk NY USA: Futura Publishing Co. Inc; 1998. pp. 321–336. [Google Scholar]
- Gonzalez C, Almaraz L, Obeso A, Rigual R. Carotid body chemoreceptors: from natural stimuli to sensory discharges. Physiological Reviews. 1994;74:829–898. doi: 10.1152/physrev.1994.74.4.829. [DOI] [PubMed] [Google Scholar]
- Gonzalez C, Dinger B, Fidone S. Functional significance of chemoreceptor cell neurotransmitters. In: Gonzalez C, editor. The Carotid Body Chemoreceptors. Heidelberg Germany: Springer-Verlag; 1997. pp. 47–64. [Google Scholar]
- Griffith OW. Determination of glutathione and glutathione disulfide using glutathione reductase and 2-vinylpyridine. Analytical Biochemistry. 1980;106:207–212. doi: 10.1016/0003-2697(80)90139-6. [DOI] [PubMed] [Google Scholar]
- Halliwell B, Gutteridge MC. Free Radicals in Medicine and Biology. 3. Oxford UK: Oxford University Press; 1999. [Google Scholar]
- Hohler B, Lange B, Holzapfel B, Goldenberg A, Hanze J, Sell A, Testan H, Moller W, Kummer W. Hypoxic upregulation of tyrosine hydroxylase gene expression is paralleled, but not induced, by increased generation of reactive oxygen species in PC12 cells. FEBS Letters. 1999;457:53–56. doi: 10.1016/s0014-5793(99)00999-0. [DOI] [PubMed] [Google Scholar]
- Kietzmann T, Porwol T, Zierold K, Jungermann K, Acker H. Involvement of a local Fenton reaction in the reciprocal modulation by O2 of glucagons-dependent activation of phosphoenolpyruvate carboxykinase gene and the insulin-dependent activation of glucokinase gene in rat hepatocytes. Biochemical Journal. 1998;335:425–432. doi: 10.1042/bj3350425. [DOI] [PMC free article] [PubMed] [Google Scholar]
- Lahiri S, Acker H. Redox-dependent binding of CO to heme protein controls PO2-sensitive chemoreceptor discharge of the rat carotid body. Respiration Physiology. 1999;115:169–177. doi: 10.1016/s0034-5687(99)00014-6. [DOI] [PubMed] [Google Scholar]
- Lang RJ, Harvey JR, McPhee GJ, Klemm MF. Nitric oxide and thiol reagent modulation of Ca2+-activated K+ (BKCa) channels in myocytes of the guinea-pig taenia caeci. Journal of Physiology. 2000;525:363–376. doi: 10.1111/j.1469-7793.2000.00363.x. [DOI] [PMC free article] [PubMed] [Google Scholar]
- Liu H, Moczydlowski E, Haddad GG. O2 deprivation inhibits Ca2+-activated K+ channels via cytosolic factors in mice neocortical neurons. Journal of Clinical Investigation. 1999;104:577–588. doi: 10.1172/JCI7291. [DOI] [PMC free article] [PubMed] [Google Scholar]
- López-Barneo J, López-López JR, Ureña J, González C. Chemotransduction in the carotid body: K+ current modulated by PO2 in type I chemoreceptor cells. Science. 1988;241:580–582. doi: 10.1126/science.2456613. [DOI] [PubMed] [Google Scholar]
- López-Barneo J, Pardal R, Montoro RJ, Smani T, Garcia-Hirschfeld J, Ureña J. K+ and Ca2+ channel activity and cytosolic [Ca2+] in oxygen-sensing tissues. Respiration Physiology. 1999;115:215–227. doi: 10.1016/s0034-5687(99)00016-x. [DOI] [PubMed] [Google Scholar]
- Marshall C, Mamary AJ, Verhoeven AJ, Marshall BE. Pulmonary artery NADPH-oxidase is activated in hypoxic pulmonary vasoconstriction. American Journal of Respiratory Cell and Molecular Biology. 1996;15:633–644. doi: 10.1165/ajrcmb.15.5.8918370. [DOI] [PubMed] [Google Scholar]
- Obeso A, Almaraz L, Gonzalez C. Correlation between adenosine triphosphate levels, dopamine release and electrical activity in the carotid body: support for the metabolic hypothesis of chemoreception. Brain Research. 1985;348:64–68. doi: 10.1016/0006-8993(85)90360-9. [DOI] [PubMed] [Google Scholar]
- Obeso A, Gomez-Niño A, Gonzalez C. NADPH oxidase inhibition does not interfere with low PO2 transduction in rat and rabbit CB chemoreceptor cells. American Journal of Physiology. 1999;276:C593–C601. doi: 10.1152/ajpcell.1999.276.3.C593. [DOI] [PubMed] [Google Scholar]
- Obeso A, Gonzalez C, Rigual R, Dinger B, Fidone S. Effect of low O2 on glucose uptake in rabbit carotid body. Journal of Applied Physiology. 1993;74:2387–2393. doi: 10.1152/jappl.1993.74.5.2387. [DOI] [PubMed] [Google Scholar]
- Obeso A, Rocher A, Fidone S, Gonzalez C. The role of dihydropyridine-sensitive Ca2+ channels in stimulus-evoked catecholamine release from chemoreceptor cells of the carotid body. Neuroscience. 1992;47:463–472. doi: 10.1016/0306-4522(92)90260-9. [DOI] [PubMed] [Google Scholar]
- O'Kelly I, Lewis A, Peers C, Kemp PJ. O2 sensing by airway chemoreceptor-derived cells. Protein kinase C activation reveals functional evidence for involvement of NADPH oxidase. Journal of Biological Chemistry. 2000;275:7684–7692. doi: 10.1074/jbc.275.11.7684. [DOI] [PubMed] [Google Scholar]
- Perez-Garcia MT, López-López JR, Gonzalez C. Kvβ1. 2 subunit coexpression in HEK293 cells confers O2-sensitivity to Kv4.2 but not to Shaker channels. Journal of General Physiology. 1999;113:897–907. doi: 10.1085/jgp.113.6.897. [DOI] [PMC free article] [PubMed] [Google Scholar]
- Post JM, Hume JR, Archer SL, Weir EK. Direct role for potassium channel inhibition in hypoxic pulmonary vasoconstriction. American Journal of Physiology. 1992;262:C882–890. doi: 10.1152/ajpcell.1992.262.4.C882. [DOI] [PubMed] [Google Scholar]
- Punchard NA, Kelly FJ. Free Radicals A Practical Approach. Oxford UK: IRL Press-Oxford University Press; 1996. pp. 1–8. [Google Scholar]
- Reeves JT, Wagner WW, McMurtry IF, Grover RF. Physiological effects of high altitude on the pulmonary circulation. In: Guyton AC, editor. Environmental Physiology III. Baltimore MD USA: University Park Press; 1979. pp. 253–289. [PubMed] [Google Scholar]
- Richalet JP. Oxygen sensors in the organism, examples of regulation under altitude hypoxia in mammals. Comparative Biochemistry and Physiology A. 1997;118:9–14. doi: 10.1016/s0300-9629(96)00370-2. [DOI] [PubMed] [Google Scholar]
- Roy A, Rozanov C, Mokashi A, Daudu P, Al-Mehdi AB, Shams H, Lahiri S. Mice lacking in gp91 phox subunit of NAD(P)H oxidase showed glomus cell [Ca2+]i and respiratory responses to hypoxia. Brain Research. 2000;872:188–193. doi: 10.1016/s0006-8993(00)02458-6. [DOI] [PubMed] [Google Scholar]
- Ruppersberg JP, Stocker M, Pongs O, Heinemann SH, Frank R, Koenen M. Regulation of fast inactivation of cloned mammalian IKA channels by cysteine oxidation. Nature. 1991;352:711–714. doi: 10.1038/352711a0. [DOI] [PubMed] [Google Scholar]
- Schweizer FE, Dresbach T, Debello WM, O'Connor V, Augustine GJ, Betz H. Regulation of neurotransmitter release kinetics by NSF. Science. 1998;279:1203–1206. doi: 10.1126/science.279.5354.1203. [DOI] [PubMed] [Google Scholar]
- Semenza G. Chairman's summary: mechanisms of oxygen homeostasis, circa 1999. Advances in Experimental Medicine and Biology. 2000;475:303–310. doi: 10.1007/0-306-46825-5_29. [DOI] [PubMed] [Google Scholar]
- Thuringer D, Findlay I. Contrasting effects of intracellular redox couples on the regulation of maxi-K+ channels in isolated myocytes from rabbit pulmonary artery. Journal of Physiology. 1997;500:583–592. doi: 10.1113/jphysiol.1997.sp022044. [DOI] [PMC free article] [PubMed] [Google Scholar]
- Vega-Saenz De Miera E, Rudy B. Modulation of K+ channels by hydrogen peroxide. Biochemical and Biophysical Research Communications. 1992;186:1681–1687. doi: 10.1016/s0006-291x(05)81602-x. [DOI] [PubMed] [Google Scholar]
- Verna A. The mammalian carotid body: morphological data. In: Gonzalez C, editor. The Carotid Body Chemoreceptors. Heidelberg Germany: Springer-Verlag; 1997. pp. 1–29. [Google Scholar]
- Verna A, Talib N, Roumy M, Pradet A. Effects of metabolic inhibitors and hypoxia on the ATP, ADP and AMP content of the rabbit carotid body in vitro: the metabolic hypothesis in question. Neuroscience Letters. 1990;116:156–161. doi: 10.1016/0304-3940(90)90402-u. [DOI] [PubMed] [Google Scholar]
- Vicario I, Rigual R, Obeso A, Gonzalez C. Characterization of the synthesis and release of catecholamine in the rat carotid body in vitro. American Journal of Physiology. 2000;278:C490–499. doi: 10.1152/ajpcell.2000.278.3.C490. [DOI] [PubMed] [Google Scholar]
- Villagrasa V, Cortijo J, Marti-Cabrera M, Ortiz JL, Berto L, Esteras A, Bruseghini L, Morcillo EJ. Inhibitory effects of N-acetylcysteine on superoxide anion generation in human polymorphonuclear leukocytes. Journal of Pharmacy and Pharmacology. 1997;49:525–529. doi: 10.1111/j.2042-7158.1997.tb06836.x. [DOI] [PubMed] [Google Scholar]
- Wolin MS, Burke-Wolin TM, Mohazzab KM. Roles for NAD(P)H oxidases and reactive oxygen species in vascular oxygen sensing mechanisms. Respiration Physiology. 1999;115:229–238. doi: 10.1016/s0034-5687(99)00023-7. [DOI] [PubMed] [Google Scholar]
- Zapata P. Chemosensory activity in the carotid nerve: effects of pharmacological agents. In: Gonzalez C, editor. The Carotid Body Chemoreceptors. Heidelberg Germany: Springer-Verlag; 1997. pp. 119–146. [Google Scholar]
- Zhu H, Bunn HF. Oxygen sensing and signaling: impact on the regulation of physiologically important genes. Respiration Physiology. 1999;115:239–247. doi: 10.1016/s0034-5687(99)00024-9. [DOI] [PMC free article] [PubMed] [Google Scholar]