Abstract
Prolonged exercise results in a progressive decline in glycogen content and a concomitant increase in the release of the cytokine interleukin-6 (IL-6) from contracting muscle. This study tests the hypothesis that the exercise-induced IL-6 release from contracting muscle is linked to the intramuscular glycogen availability.
Seven men performed 5 h of a two-legged knee-extensor exercise, with one leg with normal, and one leg with reduced, muscle glycogen content. Muscle biopsies were obtained before (pre-ex), immediately after (end-ex) and 3 h into recovery (3 h rec) from exercise in both legs. In addition, catheters were placed in one femoral artery and both femoral veins and blood was sampled from these catheters prior to exercise and at 1 h intervals during exercise and into recovery.
Pre-exercise glycogen content was lower in the glycogen-depleted leg compared with the control leg. Intramuscular IL-6 mRNA levels increased with exercise in both legs, but this increase was augmented in the leg having the lowest glycogen content at end-ex. The arterial plasma concentration of IL-6 increased from 0.6 ± 0.1 ng l−1 pre-ex to 21.7 ± 5.6 ng l−1 end-ex. The depleted leg had already released IL-6 after 1 h (4.38 ± 2.80 ng min−1 (P < 0.05)), whereas no significant release was observed in the control leg (0.36 ± 0.14 ng min−1). A significant net IL-6 release was not observed until 2 h in the control leg.
This study demonstrates that glycogen availability is associated with alterations in the rate of IL-6 production and release in contracting skeletal muscle.
Physical exercise induces a marked elevation in the plasma level of the cytokine interleukin-6 (IL)-6 (Ostrowski et al. 1998a; Pedersen & Hoffman-Goetz, 2000). A novel role has recently been proposed for IL-6 in exercise. The hypothesis being that contracting skeletal muscles produce and release IL-6, which acts in a hormone-like manner possibly mediating a link to the liver, thereby contributing to the substrate homeostasis in prolonged exercise (Steensberg et al. 2000). This hypothesis was supported in a perspective written by Gleeson, 2000. We have found that IL-6 gene expression is increased in both rat (Jonsdottir et al. 2000) and human (Ostrowski et al. 1998b; Starkie et al. 2001a) skeletal muscle following contraction. Although these studies only suggest that muscle is the source of the increase, we have measured the net skeletal muscle IL-6 release from a concentric exercising leg in humans, demonstrating that it could more than account for the exercise-related increase in plasma IL-6 concentrations (Steensberg et al. 2000). Furthermore, Malm et al. 2000 found expression of IL-6 in human muscle cells using immunohistochemistry. Recently, it was demonstrated that circulating monocytes do not contribute to the increase in plasma IL-6 concentrations during exercise (Starkie et al. 2000, 2001b).
During prolonged knee-extensor exercise, the IL-6 release was not observed before 2 h (Steensberg et al. 2000). Thereafter, it rose steadily and increased markedly after 4 h. Exercise of this intensity and duration results in muscle glycogen depletion and hypoglycaemia is sometimes also observed (Coggan & Coyle, 1991). It is possible, therefore, that IL-6 production during exercise may be related to an increased dependence on an uptake of blood borne substances by the active muscles. This hypothesis is plausible given the observation that carbohydrate ingestion during prolonged exercise attenuates the plasma IL-6 response (Nehlsen-Cannarella et al. 1997; Nieman et al. 1998), while commencing exercise in a glycogen-depleted state augments the plasma IL-6 response (Gleeson & Bishop, 2000). Moreover, infusion of recombinant IL-6 in humans increases the liver glucose output (Stouthard et al. 1995; Tsigos et al. 1997). Therefore, we suggest a link between low intramuscular substrate stores and the IL-6 production during exercise.
To explore a possible relationship between glycogen content in the muscle and IL-6 production, we investigated net skeletal muscle IL-6 release from each leg during two-legged concentric knee-extensor exercise, where one leg was glycogen depleted prior to exercise. This allowed us to compare directly the role of muscle glycogen stores, eliminating the possible effect of blood borne substrates and hormones, as the two legs had the same arterial blood supply. We hypothesized that net IL-6 release would occur earlier during prolonged exercise in a leg beginning exercise with a lower glycogen content.
METHODS
Subjects
Seven healthy males participated in the study. They were physically active, but not specifically trained, with a median age of 26 years (range 19-33 years), a weight of 75 kg (range 70-82 kg), and a height of 1.84 m (range 1.75-1.96 m). The study was approved by the Ethical Committee of the Copenhagen and Frederiksberg Communities, Denmark, and performed according to the Declaration of Helsinki. Subjects were informed about possible risks and the discomfort involved before giving their informed, written consent to participate.
Protocol
Each subject underwent preliminary exercise tests to familiarize themselves with the exercise model and to obtain a measure of their work capacity one week before the experimental trial. They performed two-legged dynamic knee-extension work on a modified ergometer (Andersen et al. 1985). Simply, subjects sat in a chair with both ankles attached to an ergometer. The exercise consisted of ‘kicking’, i.e. contractions of the knee-extensors by moving the ankles over a range of ≈60 deg (from 90 to 30 deg angle). The repositioning of the leg was fully passive due to gravity and the momentum of the ergometer wheel. After familiarization with the model, subjects underwent a maximal-exercise test to determine their individual knee-extensor peak power output (Wmax,ke), which averaged 166 W (range 140-205 W). Thereafter, they practised 2.5 h of two-legged knee-extensor exercise at a workload which corresponded to 40 % Wmax,ke in order to become fully accustomed to the exercise.
At 17.00 h the day before the experimental trial, subjects reported to the laboratory and performed 60 min of one-legged cycling followed by 60 min of two-arm cranking at a workload which subjects could tolerate for the duration of the exercise period. This protocol was designed to deplete glycogen from the quadriceps of the exercised leg and minimize resynthesis of glycogen in this leg, as the endogenous glucose production was distributed to the muscles of the upper body as well. Apart from being permitted to drink water ad libitum, the subjects were instructed to abstain from food and drink from 13.00 h on the day of the depletion protocol until the cessation of the experiment. However, each subject was provided with 3 eggs, 6 slices of bacon and 500 ml of diet coke to be consumed in the evening before the experimental trial and two eggs to consume at 07.00 h on the morning of the experimental trial. These meals provided ≈3937 kJ (≈960 kJ protein, ≈70 kJ carbohydrate, ≈2907 kJ fat).
Subjects reported to the laboratory at 07.30 h, voided, changed into appropriate exercise attire and remained supine for the next 90 min. After 10 min in the supine position, one femoral artery and both femoral veins were cannulated under local anaesthesia (lidocaine, 20 mg ml−1), with the Seldinger technique (20G; Ohmeda, Wiltshire, UK; (Bernèus et al. 1954). The femoral arterial catheter was inserted ≈2 cm below the inguinal ligament and advanced ≈10 cm in proximal direction. The femoral venous catheter was inserted ≈2-5 cm below the inguinal ligament and placed ≈10 cm in the distal direction. The distal orientation of the femoral venous catheter is crucial to avoid contamination with blood from the lower abdomen and the saphenous vein as discussed previously (van Hall et al. 1999). The subjects then exercised for 4 to 5 h (until exhaustion) at the workload used during the familiarization trial (40 % of Wmax,ke). This protocol was based on a former study (Steensberg et al. 2000). Blood samples were obtained immediately prior to exercise, at hourly intervals during exercise and at 3 h into the recovery period. At each sampling time point the femoral arterial blood flow in both legs was measured with ultrasound Doppler as previously described (Radegran, 1997), or by estimation from the measured arterial minus femoral venous (a-fv) O2 differences and rate of O2 consumption for the given workload (Fick's principle; Wade & Bishop, 1962). Furthermore a strain gauge was connected to the ergometer and force measurements were performed using a Macintosh computer during the entire exercise period. The data were analysed using MacLab 8:s, ADInstruments, Sydney, Australia. Figure 1 shows a representative picture of the strain-gauge profile for one subject for a depleted leg and control leg, respectively, at a given time point during the knee-extensor exercise. The area under the curve for each kick represents the total force produced by the muscle contraction during that particular kick.
Figure 1.
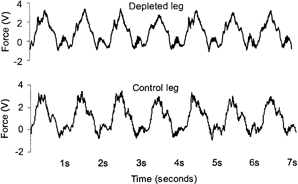
The kicking profile for one subject for a glycogen-depleted leg and a control leg, respectively, at a given time point during the knee-extensor exercise. This was measured by a strain gauge and visualized on a computer. Note that the kicking rate is 60 kicks min−1.
Muscle biopsies were obtained from the vastus lateralis of both limbs using the percutaneous needle biopsy technique with suction at rest (pre-ex), immediately following exercise (end-ex) and at the cessation of the 3 h recovery period (3 h rec).
Plasma creatine kinase (CK)
These measurements were performed at the Central Laboratory, University Hospital of Copenhagen, Rigshospitalet, using standard laboratory procedures.
Plasma glucose
This was determined with an enzymatic method for glucose using hexokinase and an automatic analyser (Cobas Fara, Roche, Switzerland).
Measurement of plasma IL-6
Blood samples for IL-6 measurement were drawn into pre-cooled glass tubes containing EDTA. The tubes were spun immediately at 2200 g for 15 min at 4 °C. The plasma was stored at -80 °C until analyses were performed. Enzyme-linked immunosorbent assay (ELISA) kits from R&D systems, Minneapolis, MN, USA, were used to measure IL-6 in plasma. According to R&D systems the IL-6 ELISA kit is insensitive to the addition of the recombinant forms of the soluble receptor (sIL-6R) and the measurements, therefore, correspond to both soluble and receptor-bound cytokine. The intra-assay coefficient of variation (c.v.) for the kit is 5.9 %.
Muscle analysis
Muscle biopsy samples were divided into two and frozen in liquid nitrogen for subsequent analysis. One portion was then freeze dried, dissected free from visible blood and connective tissue, extracted and analysed for glycogen using a standard enzymatic technique with fluorimetric detection (Lowry & Passonneau, 1978). The second portion of the muscle biopsy was extracted for total RNA as described by Chomczynski & Sacchi, 1987. The muscle tissue was homogenized in 1 ml TriReagent (Molecular Research Center, Cincinnati, OH, USA) using a polytron (Ultra-Turrax T8, Ika Labortechnik, Staufen, Germany). 50 μl 1-bromo-3-chloropropane was added and the sample mixed thoroughly. After 5 min the samples were centrifuged at 12 000 g, 4 °C for 15 min and the aqueous phase was precipitated with one volume isopropanol for 5 min. After centrifugation at 12 000 g, 4 °C for 8 min the pellet was washed once with 1 ml 75 % ethanol. The dry pellet was resuspended in 20 μl RNase-free water and stored at -20 °C for later use.
Polymerase chain reaction
One microgram of total RNA from each sample was reverse transcribed in a 10 μl reaction containing 1 × TaqMan RT buffer, 5.5 mm MgCl2, and 500 μm each of 2′-deoxynucleoside 5′-triphosphate, 2.5 μm random hexamers, 0.4 U μl−1 RNase inhibitor, 1.25 U μl−1 multiscribe reverse transcriptase (Applied Biosystems, Foster City, CA, USA) and made up to volume with H2O (0.05 % diethyl pyrocarbonate DEPC treated). Control samples were also analysed where all the above reagents are added to RNA samples except the multiscribe reverse transcriptase. The reverse transcription reactions were performed using a GeneAmp PCR system 9600 (Applied Biosystems) with conditions at 25 °C for 10 min, 48 °C for 30 min and 95 °C for 5 min. EDTA (2 μl, 0.5 m, pH 8.0) was added to each sample and stored at -20 °C until further analysis.
Real time (RT) PCR was employed to quantify human IL-6 gene expression from the cDNA samples. Human IL-6 was designed (Primer Express version 1.0 Applied Biosystems) from the human IL-6 gene sequence (GenBank/EMBL accession nos M54894 and M38669). A 76 base-length IL-6 fragment was amplified using the forward primer 5′-GGTACATCCTCGACGGCATCT-3′ and reverse 5′-GTGCCTCTTTGCTGCTTTCAC-3′ (Sigma Geno-sys, Castle Hill, NSW, Australia). A TaqMan fluorescent probe 5′-FAM (6-carboxyfluorescein)-TGTTACTCTTGTTACATGTCTCCTTTCTCAGGGC-3′ TAMRA (6-carboxy-tetramethylrhodamine) (Applied Biosystems) was included with the primers in each reaction. We also amplified 18S rRNA, and the TaqMan probes and primers for this gene were supplied in a control reagent kit (Applied Biosystems). We quantified gene expression using a multiplex comparative critical threshold (CT) method (ABI PRISM 7700). A CT value reflects the cycle number at which the DNA amplification is first detected. This method detected our reference gene (human 18S rRNA) and IL-6 in a single tube, where the primers for 18S were limited to ensure adequate amounts of reagents were present for amplification of both genes.
It was possible to detect 18S in the same tube as IL-6 because the reporter dyes attached to the TaqMan probes fluoresce at different emission wavelength maxima. In preliminary experiments we determined the relative efficiency of amplification of 18S vs. IL-6. These experiments revealed approximately equal efficiencies of 18S and IL-6 amplifications over different starting template concentrations. We also performed experiments to demonstrate that multiplex vs. non-multiplex experiments had no effect on CT values, as well as primer-limited multiplex 18S vs. non-primer-limited non-multiplex 18S reactions. Finally, we determined the linear dynamic range for starting template concentrations.
Polymerase chain reactions were carried out in 25 μl reactions of TaqMan universal PCR master mix (1 ×), 50 nm TaqMan 18S probe, 20 nm 18S forward primer, 80 nm 18S reverse primer, 100 nm TaqMan IL-6 probe, 900 nm IL-6 forward primer, 300 nm IL-6 reverse primer and was made up to volume with H2O (0.05 % DEPC treated). The concentration of the IL-6 probes and primers were chosen based on pilot analyses in which optimal concentrations were determined. cDNA (5 ng) and control preparations not containing RT were amplified using the following conditions: 50 °C for 2 min, 95 °C for 10 min followed by 50 cycles at 95 °C for 15 s and at 60 °C for 1 min. For each sample, a ΔCT value was obtained by subtracting 18S CT values from IL-6, using the resting value as the control. Resting values for each subject were subtracted from the exercise samples for each subject to derive a Δ-ΔCT value. The expression of human IL-6 was then evaluated by 2-Δ-ΔCT.
Quantitative competitive, real time-PCR (QCRT-PCR)
To support the results from the RT-PCR, the IL-6 mRNA from two subjects, was also quantified using a quantitative competitive (QC) RT-PCR assay essentially as described by Sun et al. 1996 and Jonsdottir et al. 2000.
The primers used were IL-6 sense (5′-TGGTCTTTTGGAGTTTGAGGTA-3′), IL-6 antisense (5′-AGGTTTCTGACCAGAAGAAGGA-3′), IL-6 competitor (5′-TGGTCTTTTGGAGTTTGAGGTACAAAAGTCCTGAT CCAGTTCCT-3′), GAPDH sense (5′-GAACATCATCCCTGCCTCTACT-3′), GAPDH antisense (5′-GTCTACATGGCAACTGTGAGGA-3′), and GAPDH competitor (5′-GTCTACATGGCAACTGTGAGGACAGCAGTGAG GGT CTCTCTCTT-3′).
The QCRT-PCR demonstrated a similar induction of the IL-6 mRNA level elicited by the exercise, confirming the conclusion from the RT-PCR.
Statistics
Data are shown as means ±s.e.m. Log plasma IL-6 and log IL-6 mRNA were normally distributed, therefore the logarithms were used for the statistical analyses. To analyse changes over time repeated measures analysis of variance (RM-ANOVA) was used. If significance was indicated, Student's t test was used to test for significant differences between pre- and exercise values and groups. P < 0.05 was accepted as significant. The difference in glycogen content of the two legs is observed at the start of exercise, after which it gradually diminishes. Therefore, the hypothesis was that the net IL-6 release would differ only at the beginning of the exercise, and a Student's paired t test for differences between the two legs and not a two-way ANOVA is used.
Calculations
The IL-6 net release from the legs is calculated by multiplying the a-fv IL-6 differences with the blood flow of the legs (Fick's principle).
RESULTS
The glycogen content of the depleted leg was ≈40 % lower than the control leg pre-ex (P < 0.05). At end-ex no differences in glycogen content were found between the legs but both legs were lower compared with pre-ex (P < 0.05) (Fig. 2). There was no detectable glucose uptake in the two legs pre-ex. After 1 h of exercise the glucose uptake was markedly augmented in the depleted leg compared with the control leg (P < 0.05), being 1.65 ± 0.41 and 0.42 ± 0.36 mmol min−1, respectively. During the rest of the exercise and recovery period the glucose uptake in the two legs was of the same magnitude and followed the same patterns (Fig. 3). Plasma CK was measured before the depletion procedure and did not differ from values pre-ex (Fig. 4). Although only a crude measure of muscle damage, this observation nonetheless indicated that the prior glycogen depleting exercise did not cause muscle damage. During the knee-extensor exercise plasma CK increased slightly.
Figure 2. Muscle glycogen content.
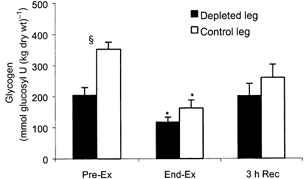
Muscle glycogen content in a glycogen-depleted and a control leg, respectively, before and after knee-extensor exercise and 3 h into recovery, n = 7. Data are presented as means and s.e.m.* Significant difference from pre-ex (P < 0.05), § significant difference between legs (P < 0.05).
Figure 3. Glycogen depletion.
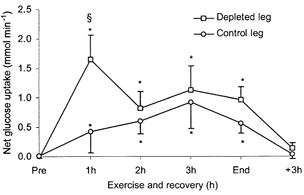
Net glucose uptake by a glycogen-depleted and a control leg, respectively (Fick's principle: blood flow times a-fv differences) measured before and every hour during knee-extensor exercise and at the cession of the 3 h recovery, n = 7. Data are presented as means and s.e.m.* Significant difference from pre-ex (P < 0.05), § significant difference between legs (P < 0.05).
Figure 4. Accumulation of plasma creatine kinase.
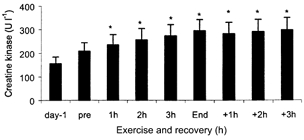
Data are presented as means and s.e.m. Day-1 is obtained before glycogen depletion and pre before the two-legged knee-extensor exercise, n = 7. * Significant difference from pre value (P < 0.05). Pre values did not differ from day-1 values.
The work performed (kicking-rate × force) by the depleted and the control leg did not differ at any time. Thus, the mean muscle contraction force was the same in the depleted legs (0.96 ± 0.14 V) and the control legs (0.95 ± 0.15 V), demonstrating that the work performed was equal in the two legs.
The arterial plasma concentration of IL-6 increased from 0.6 ± 0.1 ng l−1 at rest to 21.7 ± 5.6 ng l−1 at the end of the two-legged knee-extensor exercise (Fig. 5A). There was a gradual increase in the arterial plasma IL-6 concentration with exercise, but a more substantial increase in IL-6 concentrations occurred after 3 h of exercise. In the recovery period, the arterial plasma IL-6 gradually decreased. Pre-exercise, there was no difference in a-fv plasma IL-6 comparing the two legs. After 1 h of exercise an a-fv difference in the depleted leg was observed, whereas an a-fv difference in the control leg was not detected until the end of exercise (4-5 h of exercise), at which time the depleted and the control leg exhibited a-fv differences, being 5.5 ± 2.8 and 5.2 ± 2.7 ng l−1, respectively (Fig. 5B).
Figure 5.
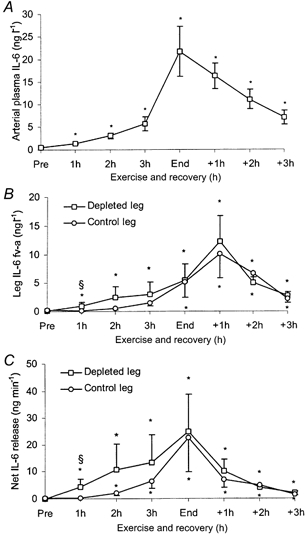
IL-6 data for 7 male subjects measured before and every hour during knee-extensor exercise and recovery. Data are presented as means and s.e.m.A, arterial IL-6 plasma concentrations. B, a-fv differences for a glycogen-depleted and a control leg, respectively. C, net release of IL-6 from a glycogen-depleted and a control leg, respectively (Fick's principle: blood flow × a-fv differences). * Significant difference from pre-ex (P < 0.05), § significant difference between legs (P < 0.05).
The blood flows to the depleted leg and the control leg pre-ex were 0.60 ± 0.09 and 0.60 ± 0.20 l min−1, respectively (Fig. 6). With the two-legged knee-extensor exercise the blood flow increased to 3.89 ± 0.26 l min−1 in the depleted leg and 3.87 ± 0.22 l min−1 in the control leg. Thereafter it was in essence unaltered. In the recovery period the blood flows were 0.84 ± 0.17 l min−1 in the depleted leg and 0.75 ± 0.16 l min−1 in the control leg. With only very small differences in leg blood flow comparing the two legs, the net release of IL-6 from the two legs mimicked the pattern observed for IL-6 a-fv differences (Fig. 5C). The net IL-6 release in the depleted leg was already observed after 1 h of exercise (P < 0.05), whereas a significant net IL-6 release was not observed until 2 h of exercise in the control leg. After 1 h of exercise the net IL-6 release was 4.38 ± 2.80 ng l−1 in the depleted leg and 0.36 ± 0.14 ng l−1 in the control leg (P < 0.05). Pre-exercise, there was no significant difference in muscle IL-6 mRNA levels between the two legs. Muscle IL-6 mRNA levels were higher (P < 0.05) end-ex in both legs compared with pre-ex (Fig. 7). At 3 h rec the IL-6 mRNA levels had declined compared with end-ex, but they were still elevated above pre-ex values. At end-ex no significant difference was found between the legs in IL-6 mRNA, although there was a trend for the depleted leg to express a greater amount of IL-6 mRNA (P = 0.11). However, when analysing the individual data for the leg with the lowest glycogen content at end-ex it could be demonstrated that this leg expressed the highest increase of IL-6 mRNA (P < 0.05), namely a 33.6 ± 14.6-fold increase versus a 14.5 ± 5.2-fold increase in the control leg. At 3 h rec no association was found between muscle glycogen content and IL-6 mRNA.
Figure 6.
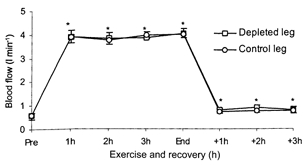
Blood flow in a glycogen-depleted leg and a control leg, respectively, measured before and every hour during knee-extensor exercise and recovery, n = 7. Data are presented as means and s.e.m.* Significant difference from pre-ex (P < 0.05).
Figure 7.
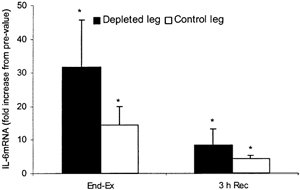
IL-6 mRNA in a glycogen-depleted leg and a control leg after knee-extensor exercise and 3 h into recovery measured by real time PCR, n = 7. Data are presented as means and s.e.m.* Significant difference from pre-ex (P < 0.05).
DISCUSSION
We have demonstrated that IL-6 release from contracting skeletal muscle is related to pre-exercise glycogen availability. Furthermore, the observation of a net IL-6 release in the depleted leg within 1 h of concentric exercise, suggests that IL-6 production and subsequent release from skeletal muscle is not due to an inflammatory response, but is a consequence of muscle contractions per se. Hence, we propose that, apart from the well-categorized actions of IL-6 as a pro-inflammatory cytokine, it may play a novel metabolic role during exercise.
There is some evidence to suggest that IL-6 is involved in glucose regulation. Supplying exogenous glucose during exercise by carbohydrate ingestion attenuates the exercise-induced increase in IL-6 (Nehlsen-Cannarella et al. 1997; Nieman et al. 1998), although these data are difficult to interpret since the site of IL-6 production was not determined. However, there is evidence to suggest that IL-6 may augment glucose uptake by insulin-sensitive tissues. Stouthard et al. 1995 demonstrated that infusion of recombinant human IL-6 (rHIL-6) into human subjects, increased whole body glucose disposal and subsequent oxidation compared with a control trial. Even though endogenous glucose production was increased with rHIL-6 infusion, the metabolic clearance rate of glucose was higher in this trial suggesting that relative hyperglycaemia was not responsible for the augmented glucose disposal. Moreover, in a follow-up study, it was demonstrated that IL-6 increased both basal and insulin-stimulated glucose uptake in cultured 3T3-L1 adipocytes (Stouthard et al. 1996). These authors concluded that IL-6 acted by increasing glucose transporter (GLUT)-1, intrinsic activity.
In the present study, IL-6 was released from contracting muscle and the release was observed in the glycogen-depleted leg 1 h before the control leg. At end-ex the IL-6 release did not differ between the legs. This finding is compatible with the finding that the glycogen content was similar in the two legs at termination of the work period. Indeed in three of the subjects glycogen content was lower in the control leg end-ex. This smaller decrease in glycogen content in the depleted leg is explained by the markedly larger glucose uptake in this leg (Fig. 3). Exactly when the muscle glycogen content became similar during the exercise, due to the difference in glucose uptake by the legs, cannot be stated, but with the exceptionally high glucose uptake in the depleted leg, in the very early phase of the exercise, the difference narrowed quickly. A critical role of the glycogen content (or glucose uptake) in the activation of the IL-6 gene is suggested by the finding that regardless of pre-ex muscle glycogen content, IL-6 mRNA was highest at end-ex in the leg with the lowest glycogen content.
The biological significance of the augmented IL-6 release is not known. However, previous studies suggest that IL-6 has a marked influence on hepatic glucose metabolism. IL-6 has been shown to inhibit glycogen synthase activity, but accelerate glycogen phosphorylase activity (Kanemaki et al. 1998) in rodent hepatocytes. Moreover, it has been demonstrated that injection of recombinant human IL-6 (rHIL-6) into humans increases hepatic glucose production (Stouthard et al. 1995) and fasting blood glucose concentration in a dose-dependent manner (Tsigos et al. 1997). Although the effect of exercise on hepatic glucose production has been well studied and involves a complex interplay of neurohumoral factors (Kjaer, 1995), the precise mechanism by which muscle contraction augments hepatic glucose production is unclear. Research has demonstrated that exercise-induced changes in insulin and/or glucagon (Coker et al. 2001), cortisol (Cryer, 1993) adrenaline (Howlett et al. 1999) or adrenergic neural stimulation (Sigal et al. 1994, 2000) cannot account for the exercise-induced increase in hepatic glucose production. Indeed, it has been concluded that the possibility exists that an, as yet, unidentified factor may contribute to the increase in hepatic glucose production (Howlett et al. 1999). The data from the current study raises the possibility that IL-6 produced by contracting skeletal muscle directly or indirectly participates in mediating the hepatic glucose output necessary to maintain blood glucose homeostasis when the uptake of blood glucose by skeletal muscles is increased by prolonged exercise.
It must be noted that we only observed a relationship between IL-6 production and subsequent release from the contracting skeletal muscles and glycogen availability within those muscles. The design of this study did not allow us to directly test if the augmented IL-6 production and release was caused by low glycogen per se. Indeed, we cannot rule out the possibility that other intramuscular metabolic changes associated with commencing exercise with lower than normal glycogen resulted in an altered IL-6 response. In addition, our data only suggest that the biological role of the increase in production and subsequent release of IL-6 in contracting skeletal muscle is to increase muscle glucose uptake and/or hepatic glucose production. In order to test these hypotheses further research using pharmacological inhibitors of IL-6 production or using transgenic rodent models of either overexpression of IL-6 or IL-6 knockout are warranted.
In summary, this study demonstrates that IL-6 release from contracting skeletal muscle is related to pre-exercise glycogen content. It is possible that muscle-derived IL-6 may act as a hormone and is involved in glucoregulatory processes during exercise.
Acknowledgments
The excellent technical assistance by Ruth Rousing and Carsten Nielsen is acknowledged. The study was supported by a scholarship from The Danish National Research Foundation and grant 504-14 to The Copenhagen Muscle Research Centre. Takuya Osada is a Visiting Fellow from the Department of Preventive Medicine and Public Health, Tokyo Medical University, Tokyo, Japan.
References
- Andersen P, Adams RP, Sjogaard G, Thorboe A, Saltin B. Dynamic knee extension as model for study of isolated exercising muscle in humans. Journal of Applied Physiology. 1985;59:1647–1653. doi: 10.1152/jappl.1985.59.5.1647. [DOI] [PubMed] [Google Scholar]
- Bernèus B, Carlsen A, Holmgren A, Seldinger SI. Percutaneus catheterization of peripheral arteries as a method for blood sampling. Scandinavian Journal of Clinical Laboratory Investigation. 1954;6:217–221. [PubMed] [Google Scholar]
- Chomczynski P, Sacchi N. Single-step method of RNA isolation by acid guanidinium thiocyanate-phenol-chloroform extraction. Annals of Biochemistry. 1987;162:156–159. doi: 10.1006/abio.1987.9999. [DOI] [PubMed] [Google Scholar]
- Coggan AR, Coyle EF. Carbohydrate ingestion during prolonged exercise: effects on metabolism and performance. Exercise and Sport Science Review. 1991;19:1–40. [PubMed] [Google Scholar]
- Coker RH, Simonsen L, Bulow J, Wasserman DH, Kjaer M. Stimulation of splanchnic glucose production during exercise in humans contains a glucagon-independent component. American Journal of Physiology, Endocrinology and Metabolism. 2001;280:E918–927. doi: 10.1152/ajpendo.2001.280.6.E918. [DOI] [PubMed] [Google Scholar]
- Cryer PE. Glucose counterregulation: prevention and correction of hypoglycemia in humans. American Journal of Physiology. 1993;264:E149–155. doi: 10.1152/ajpendo.1993.264.2.E149. [DOI] [PubMed] [Google Scholar]
- Gleeson M. Interleukins and exercise. Journal of Physiology. 2000;529:1. doi: 10.1111/j.1469-7793.2000.00001.x. [DOI] [PMC free article] [PubMed] [Google Scholar]
- Gleeson M, Bishop NC. Special feature for the olympics: effects of exercise on the immune system: modification of immune responses to exercise by carbohydrate, glutamine and anti-oxidant supplements. Immunology and Cell Biology. 2000;78:554–561. doi: 10.1111/j.1440-1711.2000.t01-6-.x. [DOI] [PubMed] [Google Scholar]
- Howlett K, Febbraio M, Hargreaves M. Glucose production during strenuous exercise in humans: role of epinephrine. American Journal of Physiology. 1999;276:E1130–1135. doi: 10.1152/ajpendo.1999.276.6.E1130. [DOI] [PubMed] [Google Scholar]
- Jonsdottir IH, Schjerling P, Ostrowski K, Asp S, Richter EA, Pedersen BK. Muscle contractions induce interleukin-6 mRNA production in rat skeletal muscles. Journal of Physiology. 2000;528:157–163. doi: 10.1111/j.1469-7793.2000.00157.x. [DOI] [PMC free article] [PubMed] [Google Scholar]
- Kanemaki T, Kitade H, Kaibori M, Sakitani K, Hiramatsu Y, Kamiyama Y, Ito S, Okumura T. Interleukin 1 beta and interleukin 6, but not tumor necrosis factor alpha, inhibit insulin-stimulated glycogen synthesis in rat hepatocytes. Hepatology. 1998;27:1296–1303. doi: 10.1002/hep.510270515. [DOI] [PubMed] [Google Scholar]
- Kjaer M. Hepatic fuel metabolism during exercise. In: Hargreaves M, editor. Exercise Metabolism. Champaign, IL: Human Kinetics Inc; 1995. pp. 73–98. [Google Scholar]
- Lowry O, Passonneau J. A flexible system of enzymatic analysis. New York: Academic Press; 1978. [Google Scholar]
- Malm C, Nyberg P, Engstrom M, Sjodin B, Lenkei R, Ekblom B, Lundberg I. Immunological changes in human skeletal muscle and blood after eccentric exercise and multiple biopsies. Journal of Physiology. 2000;529:243–262. doi: 10.1111/j.1469-7793.2000.00243.x. [DOI] [PMC free article] [PubMed] [Google Scholar]
- Nehlsen-Cannarella SL, Fagoaga OR, Nieman DC, Henson DA, Butterworth DE, Schmitt RL, Bailey EM, Warren BJ, Utter A, Davis JM. Carbohydrate and the cytokine response to 2. 5 h of running. Journal of Applied Physiology. 1997;82:1662–1667. doi: 10.1152/jappl.1997.82.5.1662. [DOI] [PubMed] [Google Scholar]
- Nieman DC, Nehlsen-Cannarella SL, Fagoaga OR, Henson DA, Utter A, Davis JM, Williams F, Butterworth DE. Influence of mode and carbohydrate on the cytokine response to heavy exertion. Medicine and Science in Sports and Exercise. 1998;30:671–678. doi: 10.1097/00005768-199805000-00005. [DOI] [PubMed] [Google Scholar]
- Ostrowski K, Hermann C, Bangash A, Schjerling P, Nielsen JN, Pedersen BK. A trauma-like elevation of plasma cytokines in humans in response to treadmill running. Journal of Physiology. 1998a;513:889–894. doi: 10.1111/j.1469-7793.1998.889ba.x. [DOI] [PMC free article] [PubMed] [Google Scholar]
- Ostrowski K, Rohde T, Zacho M, Asp S, Pedersen BK. Evidence that interleukin-6 is produced in human skeletal muscle during prolonged running. Journal of Physiology. 1998b;508:949–953. doi: 10.1111/j.1469-7793.1998.949bp.x. [DOI] [PMC free article] [PubMed] [Google Scholar]
- Pedersen BK, Hoffman-Goetz L. Exercise and the immune system: regulation, integration, and adaptation. Physiological Reviews. 2000;80:1055–1081. doi: 10.1152/physrev.2000.80.3.1055. [DOI] [PubMed] [Google Scholar]
- Radegran G. Ultrasound Doppler estimates of femoral artery blood flow during dynamic knee extensor exercise in humans. Journal of Applied Physiology. 1997;83:1383–1388. doi: 10.1152/jappl.1997.83.4.1383. [DOI] [PubMed] [Google Scholar]
- Sigal RJ, Fisher SJ, Manzon A, Morais JA, Halter JB, Vranic M, Marliss EB. Glucoregulation during and after intense exercise: effects of alpha-adrenergic blockade. Metabolism. 2000;49:386–394. doi: 10.1016/s0026-0495(00)90374-3. [DOI] [PubMed] [Google Scholar]
- Sigal RJ, Purdon C, Bilinski D, Vranic M, Halter JB, Marliss EB. Glucoregulation during and after intense exercise: effects of beta-blockade. Journal of Clinical Endocrinology and Metabolism. 1994;78:359–366. doi: 10.1210/jcem.78.2.7906280. [DOI] [PubMed] [Google Scholar]
- Starkie RL, Angus DJ, Rolland J, Hargreaves M, Febbraio MA. Effect of prolonged, submaximal exercise and carbohydrate ingestion on monocyte intracellular cytokine production in humans. Journal of Physiology. 2000;528:647–655. doi: 10.1111/j.1469-7793.2000.t01-1-00647.x. [DOI] [PMC free article] [PubMed] [Google Scholar]
- Starkie RL, Arkinstall MJ, Koukoulas I, Hawley JA, Febbraio M. Carbohydrate ingestion attenuates the increase in plasma interleukin-6, but not skeletal muscle interleukin-6 mRNA, during exercise in humans. Journal of Physiology. 2001a;533:585–591. doi: 10.1111/j.1469-7793.2001.0585a.x. [DOI] [PMC free article] [PubMed] [Google Scholar]
- Starkie RL, Rolland J, Angus DJ, Anderson MJ, Febbraio M. Circulating monocytes are not the source of elevations in plasma IL-6 & TNF- concentrations after prolonged running. American Journal of Physiology. 2001b;280:C769–774. doi: 10.1152/ajpcell.2001.280.4.C769. [DOI] [PubMed] [Google Scholar]
- Steensberg A, van Hall G, Osada T, Sacchetti M, Saltin B, Klarlund PB. Production of interleukin-6 in contracting human skeletal muscles can account for the exercise-induced increase in plasma interleukin-6. Journal of Physiology. 2000;529:237–242. doi: 10.1111/j.1469-7793.2000.00237.x. [DOI] [PMC free article] [PubMed] [Google Scholar]
- Stouthard JM, Oude Elferink RP, Sauerwein HP. Interleukin-6 enhances glucose transport in 3T3-L1 adipocytes. Biochemical and Biophysical Research Communications. 1996;220:241–245. doi: 10.1006/bbrc.1996.0389. [DOI] [PubMed] [Google Scholar]
- Stouthard JM, Romijn JA, Vander Poll T, Endert E, Klein S, Bakker PJ, Veenhof CH, Sauerwein HP. Endocrinologic and metabolic effects of interleukin-6 in humans. American Journal of Physiology. 1995;268:E813–819. doi: 10.1152/ajpendo.1995.268.5.E813. [DOI] [PubMed] [Google Scholar]
- Sun B, Wells J, Goldmuntz E, Silver P, Remmers EF, Wilder RL, Caspi RR. A simplified, competitive RT-PCR method for measuring rat IFN-gamma mRNA expression. Journal of Immunological Methods. 1996;195:139–148. doi: 10.1016/0022-1759(96)00099-3. [DOI] [PubMed] [Google Scholar]
- Tsigos C, Papanicolaou DA, Kyrou I, Defensor R, Mitsiadis CS, Chrousos GP. Dose-dependent effects of recombinant human interleukin-6 on glucose regulation. Journal of Clinical Endocrinology and Metabolism. 1997;82:4167–4170. doi: 10.1210/jcem.82.12.4422. [DOI] [PubMed] [Google Scholar]
- van Hall G, Gonzalez-Alonso J, Sacchetti M, Saltin B. Skeletal muscle substrate metabolism during exercise: methodological considerations. Proceedings of the Nutrition Society. 1999;58:899–912. doi: 10.1017/s0029665199001202. [DOI] [PubMed] [Google Scholar]
- Wade OL, Bishop JM. Cardiac Output and Regional Blood Flow. Oxford: Blackwell; 1962. [Google Scholar]


