

Abstract
We have examined the temporal discharge patterns of single units from the ventral cochlear nucleus (VCN) of anaesthetized guinea-pigs in response to iterated rippled noise (IRN). The pitch range evoked by the stimuli was from 32 to 1000 Hz.
Single units were classified into four groups using existing classification schemes: primary-like (PL), onset (O), sustained chopper (CS) and transient chopper (CT). For all unit types the delay of the IRN stimuli was well represented in the all-order interspike interval histograms (ISIHs).
A subset of the onset units (onset-chopper, OC) showed a clear preference for some delays of the IRN in their first-order interval statistics. We describe this delay preference as ‘periodicity tuning’. The delay at which the pitch estimate was at its maximum was designated its best periodicity. The range of best periodicities for OC units was 3.75-13 ms (between 77 and 267 Hz).
The other unit types also showed enhancement of the first-order interval statistics at the delay of the IRN. The range of best periodicities was 1.4-8.8 ms (113-714 Hz) for the CT group, 2.25-10.8 ms (93-444 Hz) for the CS group and 0.5-4.6 ms (217-2000 Hz) for the PL group.
The correlation between the maximum interval enhancement observed in response to the IRN stimuli and the peak in the first-order ISIH in response to white noise was 0.81 for OC units, 0.72 for CS units, 0.44 for CT units and -0.15 for PL units.
These results demonstrate that all unit types in the VCN can enhance the representation of the delay of IRN using first-order interspike intervals (ISIs) over a range of periodicities. CS and OC units show the greatest range of best periodicities and they are well-suited to encode the delay of IRN in their first-order ISIs for a wide range of pitches.
It is important for animals to be able to separate periodic sounds from aperiodic sounds; in the natural world, periodic sounds typically indicate the presence of animals (e.g. the whistles and hoots of birds and mammals), whereas aperiodic sounds are more commonly background noises (e.g. wind in the trees, rain, or rushing water). With regard to human perception and communication, periodic sounds produce strong pitch sensations, and the controlled variation of the period of the sound is the basis of melody in music and prosody in speech. As a result, there is considerable interest in how the auditory system detects and extracts the temporal regularity of periodic and quasi-periodic sounds.
In the cochlea the basilar membrane performs a spectral analysis of incoming sound and maps stimulus frequency onto place along the basilar membrane. Periodic sounds produce maxima in membrane motion at places corresponding to the first 5-10 integer multiples of the reciprocal of the period of the sound (the low harmonics of the fundamental frequency of the sound). The internal tonotopic representation of a sound is often simulated using a computational model in which the membrane motion is represented by a bank of ‘auditory’ filters (e.g. Patterson et al. 1995). The output of each filter is half-wave rectified and integrated to determine the activity level in that filter, and the set of levels is then plotted as a function of filter centre frequency (place) to produce what is referred to as an ‘auditory spectrum’ (Patterson, 1994). This representation of tonotopic activity is often assumed to be the basis of pitch perception (e.g. Srulovicz & Goldstein, 1983; Cohen et al. 1995).
It is also the case, however, that the inner hair cells, which transduce basilar membrane motion, do so in-phase with membrane motion up to relatively high frequencies (e.g. approximately 3.5 kHz in the guinea-pig; Palmer & Russell, 1986). As a result, there is detailed information about the timing of membrane peaks in each tonotopic channel. When the incoming sound is periodic, time interval histograms computed from auditory-filter outputs exhibit peaks at the period of the sound, as do time interval histograms computed from the activity in primary auditory fibres. Computational models have also been developed to analyse complex, pitch-producing sounds, using the time interval information from the auditory filterbank. Instead of integrating the filterbank output with a simple low-pass filter, each channel is subjected to autocorrelation (Slaney & Lyon, 1990; Meddis & Hewitt, 1991a), or some other form of time interval analysis (Patterson et al. 1995). The resulting two-dimensional representations (filter-centre frequency vs. lag or time interval) exhibit activity peaks across a range of channels at the period of complex pitch-producing sounds. There are some models of auditory perception in which it is argued that it is this distribution of activity in these ‘autocorrelograms’ that determines the perceived pitch (e.g. Meddis & Hewitt, 1991a, b; Yost et al. 1996). The debate about the relative roles of spectral and temporal information in pitch perception is reviewed in Hartmann (1996).
For most pitch-producing sounds, there is a strong correlation between the presence of peaks in the auditory spectrum at harmonics of the fundamental of the sound, and the presence of peaks in the interval histogram or autocorrelogram at the period of the sound. For such sounds it is difficult to say which auditory mechanism is more likely to be the basis of the pitch. There is, however, a stimulus, referred to as ‘iterated rippled noise’ whose auditory spectrum (Patterson, 1994) is more disrupted by the variability in the stimulus than the autocorrelogram, but which nevertheless produces a strong pitch sensation. There is temporal regularity in the fine structure of the neural firing patterns and it produces peaks in the autocorrelogram. Consequently, this stimulus has been used in both perceptual and physiological experiments to study the processing of temporal fine structure in the auditory system (e.g. Shofner, 1991, 1999; Wiegrebe & Patterson, 1999a; Yost, 1996a, b; Yost et al. 1996).
Rippled noise (RN) is produced from white noise (WN) by delaying a copy of the noise (Fig. 1A) by d ms and adding the delayed noise back to the original. Iterated rippled noise (IRN) is produced by repeating the delay-and-add process n times, and it is referred to as IRN(d,n). The delay-and-add process introduces temporal regularity into the fine structure of the noise (Fig. 1B) which is revealed by peaks in the autocorrelation function of the wave (Fig. 1D). It also introduces a ‘ripple’ into the long-term power spectrum of the wave (Fig. 1C). Note, however, that the resolution of the spectral analysis performed in the cochlea is proportional to frequency, and so high frequency peaks merge in the internal tonotopic representation. Simulations of the processing of IRN (Griffiths et al. 1998) do not show resolved peaks above about the sixth harmonic. Indeed, it has been argued (Yost et al. 1996) that the pitch of IRN is best represented by the position of the first peak in the autocorrelation of the waveform (h1, see Fig. 1D).
Figure 1. The generation of iterated rippled noise.
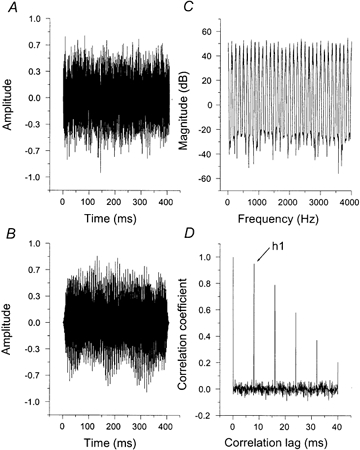
A, a sample of WN is processed in a delay-and-add network. In this network, the output of one delay-and-add stage (one iteration) serves as the input for the next iteration. Thus this network corresponds to the ‘add-same’ network described by Yost (1996a, b). B, the resulting IRN wave when the delay is 8 ms, the gain is unity and the number of iterations is 16. C, the resulting spectrum shows harmonic peaks at integer multiples of 125 Hz which is the reciprocal of the 8 ms delay used to generate the IRN. Note the complete stimulus is not shown. D, the normalized autocorrelation function shows peaks at integer multiples of the 8 ms correlation lag. The position and height of the first peak (apart from the peak at the zero lag) in the autocorrelation function, h1, has been used to model the pitch and pitch strength of IRN. Note that the height of h1 is slightly less than unity reflecting the quasi-periodicity of IRN stimuli.
The iteration process does produce some amplitude modulation (AM) in individual frequency channels; however, the modulation has a different phase in each presentation, it has different phases in different channels, and the phase drifts continuously in every channel. As a result, the stimulus does not have the pronounced envelope modulation typical of traditional pitch-producing stimuli like AM tones or AM noise. The form of the modulation is important for two reasons. Firstly, it means that the stimulus precludes a simple phase-locked analysis of the spike discharges. Secondly, it greatly reduces the chances that the results will be confounded by aural distortion products. When AM is applied to a tone or band of noise, even-order distortion in the cochlea generates a relatively strong distortion component on the basilar membrane at the modulation frequency (Wiegrebe & Patterson, 1999b). As a result, when the response of a unit exhibits activity at the modulation frequency, it is difficult to determine whether the response represents central extraction of the modulation information from high-frequency channels, or a direct response to a distortion component at the modulation frequency on the basilar membrane. Recent, psychophysical studies with harmonic complexes (Pressnitzer & Patterson, 2001; Pressnitzer et al. 2001) have shown that the even-order distortion products are strongly dependent on the presence of simple phase relationships between components - phase relationships that are absent in IRN. Moreover, Yost et al. (1998) have shown that if IRN produces audible distortion products, they are at such a low level as to be essentially negligible.
More sophisticated analyses of spike discharges using autocorrelation analysis revealed that time domain models can explain the pitch of IRN, as well as the pitch of other complex tones (Cariani & Delgutte, 1996a, b; Shofner, 1999). Here we show that the position of the first peak in the all-order interspike interval histogram (ISIH; equivalent to an autocorrelation) of the response of many unit types in the ventral cochlear nucleus (VCN) is able to encode the delay of IRN. Specifically, units classified as onset, chopper and primary-like were able to represent the pitch of IRN in the all-order ISIH of their spike output in a manner very similar to their auditory-nerve fibre input. However, analyses of the first-order ISIHs revealed interesting differences between the unit types: each onset-chopper (OC) and sustained chopper (CS) unit had a stimulus period that evoked a maximal response, its best period, but it also responded well for a limited range of periods (or pitches) around this best period. We refer to this preference in first-order interval statistics as ‘periodicity tuning’. The range of best periods varied from 3.75 to 13 ms (between 77 and 267 Hz) for OC units and from 2.25 to 10.8 ms (between 93 and 444 Hz) for CS units. Primary-like (PL) and transient chopper (CT) units generally showed an enhancement of first-order intervals in response to IRN stimuli with shorter delays.
METHODS
Preparation
The data reported in this paper were recorded from 29 pigmented guinea-pigs weighing between 319 and 471 g. The procedures used in this paper were approved by the United Kingdom Home Office (1986) Act by the issue of a project and a personal licence to the first author. Animals were anaesthetized with urethane (1.5 g kg−1i.p.) and supplementary analgesia provided by either operidine (1 mg kg−1i.m.) or Hypnorm (1 mg kg−1i.m.). All animals were given atropine sulphate (0.06 mg kg−1, s.c.) as a premedication. Additional doses of urethane and the analgesic were administered when required.
The surgical preparation and stimulus presentation took place in a sound-attenuated chamber (IAC). All animals were tracheotomized and core temperature was maintained at 38 °C with a heating blanket. Following placement in the stereotaxic apparatus a midline incision of the scalp was made and the skin was retracted laterally. The temporalis muscle on the left-hand side of the skull was removed and the bulla exposed. The method of stereotaxic positioning follows that reported previously (Winter & Palmer, 1990a, b). No histological verification of recording position was undertaken but the following observations suggest that all the units reported in this paper were recorded from the ventral division of the cochlear nucleus. The stereotaxic coordinates were identical to those used in previous studies in the ventral and anteroventral cochlear nucleus (VCN and AVCN, respectively) (Winter & Palmer, 1990a, b, 1995; Palmer & Winter, 1992, 1993) and electrode tracks sometimes coursed their way through the dorsal cochlear nucleus (DCN) before entering the ventral division. Although, exceptionally, data were recorded from units in the DCN, as judged by their stereotaxic position and physiological response type (e.g. Stabler et al. 1996), we have excluded them from the present data set.
The compound action potential (CAP) was monitored with the use of a silver-coated wire placed on the round window of the cochlea. The signal was filtered and amplified (×10 000). The CAP threshold was determined visually (10 ms tone-pip, 1 ms rise-fall time, 10 s−1) at selected frequencies (0.5, 1, 2, 3, 4, 5, 7, 10 and 15 kHz) at intervals during the experiment. If thresholds had deteriorated by more than 10 dB and were not recoverable (for example, by removal of fluid from the bulla) the animal was killed by an anaesthetic overdose of sodium pentobarbital (i.p.).
Complex stimuli
The pitch-producing stimuli presented in this study were IRN, random-phase harmonic complexes (RPH) and cosine-phase harmonic complexes (CPH). The fundamental frequency (f0) for all stimulus types (equivalent to the reciprocal of the delay for IRN) ranged from 31.25 Hz to 1 kHz in half-octave steps. IRN was generated as described in the Introduction by delaying and adding WN. When this process was iterated, the output waveform of one delay-and-add stage served as the input to the next stage. We used the ‘add same’ configuration as defined in Yost (1996a, b) with a gain of one and 16 iterations. CPH and RPH complexes were generated in the frequency domain by producing a harmonic magnitude spectrum and a uniformly random-phase spectrum (for RPH) or a phase spectrum set to zero (for CPH). Applying an inverse fast Fourier transform to the magnitude and phase spectra results in the stimulus waveform. Examples of the waveforms of CPH and RPH complexes are shown in Fig. 2A and C, respectively. The magnitude spectrum, common to these two stimuli, is shown in Fig. 2B. Note the pronounced difference in the waveform despite the identical magnitude spectra. Stimuli were generated digitally using the Tucker-Davis (TDT) System II DSP Board at a sampling rate of 20 kHz. The stimulus duration was 409.6 ms including 10 ms cos2 ramps. Each stimulus was usually presented 25 times at a rate of one per second. Unless otherwise stated, the stimuli were refreshed for every presentation. Due to the non-deterministic nature of RPH complexes and IRN, different stimulus waveforms share the same regularity features. The stimulus energy was kept constant irrespective of stimulus type and fundamental frequency. As a control we also collected the responses to WN at the same sampling rate and energy level.
Figure 2. Harmonic complexes with a fundamental frequency of 125 Hz.

A, the waveform of a cosine-phase harmonic complex; C, the waveform of a random-phase harmonic complex. The fundamental frequency was 125 Hz in each case. B, a segment of the magnitude spectrum, common to the two waveforms. The two waveforms have the same energy. Note the distinct peaks in the waveform of the cosine-phase harmonic complex in comparison with the less distinct peaks in the random-phase stimulus.
After digital-to-analog conversion, the stimuli were low-pass filtered at the Nyquist frequency, 10 kHz (using a TDT FT6) and attenuated (using a TDT PA4). The stimuli were equalized (Phonics graphic equalizer EQ 3600) to compensate for the frequency response of the speaker and coupler before being fed into a Rotel RB971 power amplifier and a programmable end attenuator (0-75 dB in 5 dB steps). The signal was presented via a speaker mounted in a coupler designed for the ear of a guinea-pig. The stimuli were acoustically monitored with a Bruel & Kjaer 4134 microphone attached to a calibrated 1 mm probe-tube. Following the procedure of Shofner (1991), the sound levels of the IRN, CPH and RPH stimuli were selected arbitrarily as that level which produced a reasonable spike discharge rate (≈> 50 spikes s−1).
Analyses
Recordings from single units were made using tungsten-in-glass microelectrodes (Merrill & Ainsworth, 1972). Electrodes were advanced by an electronic microdrive (Kopf 650 W) through the intact cerebellum in the sagittal plane at an angle of 45 deg. The appearance of stimulus-locked activity in response to a wideband noise stimulus was taken to indicate the arrival of the electrode tip at the surface of the cochlear nucleus. Wideband noise was also used to search for single units. Upon isolation of a single unit, estimates of best frequency and threshold were obtained using audio-visual criteria. The spontaneous discharge was measured over a 10 s period. Single units were classified by the shape of their peri-stimulus time histogram (PSTH) in response to suprathreshold best frequency tone-bursts and their discharge regularity (Young et al. 1985). To identify a unit as an onset unit we have used the classification scheme of Winter & Palmer (1995).
PSTHs were generated in response to 250 short tone bursts (50 ms) at the unit's best frequency. Rise-fall time was 1 ms (cos2 gate) and the repetition rate was 4 s−1. The starting phase of each tone burst was varied randomly to reduce the influence of phase-locked discharges on the shape of the PSTH for units with low best frequencies. Spikes were timed with 1 μs resolution with a Tucker-Davis Technologies (TDT) event timer (ET1). Typically, sound levels were 20 dB and either 40 or 50 dB suprathreshold. All single tone PSTHs shown in this paper include a 20 ms delay before the onset of the stimulus.
We have analysed the responses of single units in terms of their first-order and all-order interval statistics. The all-order interval statistic is analogous to the autocorrelation calculation used by neural modellers and psychophysicists with IRN stimuli. In the majority of cases we also presented WN to the unit at the same sampling rate and sound level. This ensured that a similar discharge rate was elicited for both WN and IRN stimuli except where the best frequency of the unit was in a spectral dip between low harmonics in the IRN spectrum. The delay-and-add process used to generate IRN points to the fact that the stimulus is derived from WN. The strength of the pitch associated with IRN increases monotonically with the number of iterations (Yost 1996a). We have therefore sought to define a measure of the neural response that can reveal increases in activity with increasing iteration. We have chosen to compare the response to the WN with the responses to the IRN, RPH and CPH stimuli by subtracting the number of first- and all-order intervals in response to the WN, from the number of first- and all-order intervals in response to the complex stimuli. The difference between the number of intervals at the stimulus period in response to the complex stimuli and the number at the same interval in response to WN was termed interval enhancement. The interval enhancement was then plotted as a function of delay (or fundamental period) and was normalized to the largest enhancement value (see Figs 6, 7 and 9). This interval enhancement measure emphasizes the fact that our reference condition (WN) does not produce a pitch sensation and that any changes in the interspike interval (ISI) statistics are due to the periodicity or quasi-periodicity present in the pitch-producing stimuli.
Figure 6. Normalized interval enhancement in an OC unit.
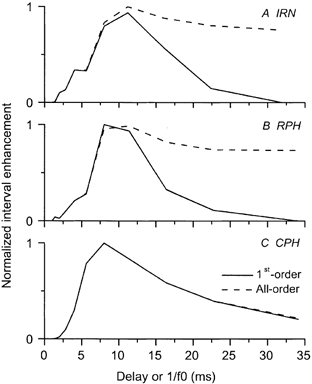
Interval enhancement of the OC unit shown in Figs 4 and 5 as a function of stimulus period. The continuous line indicates the interval enhancement based on first-order interval statistics; the dashed line represents the all-order interval statistics. For this unit there is a clear preference for periods around 11 ms in the first-order interval statistics for the IRN stimulus. A similar peak in the interval enhancement function is found around 100 Hz for the RPH and CPH stimulus conditions.
Figure 7. Normalized interval enhancement in a CS unit.
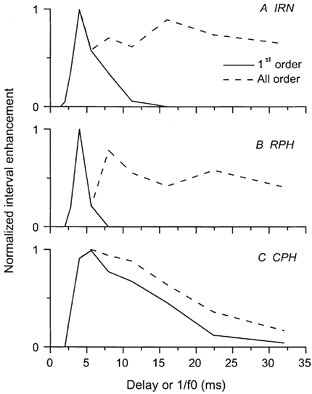
Best frequency was 3 kHz. Interval enhancement to IRN, RPH and CPH stimuli is shown in the first-order ISIHs (continuous line). The periodicity tuning was narrowest in response to the RPH stimulus and widest in response to the CPH stimulus. A more low-pass function is seen in the all-order statistics (dashed line).
Figure 9. Normalized interval enhancement for a PL unit.
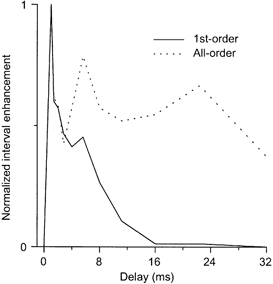
Response of the same PL unit as in Fig. 8 as a function of IRN period. The continuous line indicates the interval enhancement based on first-order interval statistics; the dotted line represents the all-order interval statistics. For this unit there is a clear preference for periods around 1 ms in both the first-order and all-order statistics. However, note the good representation of stimulus periods as long as 32 ms in the all-order responses; the response to the period in the first-order statistics declines very rapidly from 1.4 ms and is not evident for delays longer than 11.2 ms.
In order to quantify the relationship between the peak in the first-order ISI response to WN and the peak in the interval enhancement seen in response to IRN (see Fig. 11 and Fig. 12), we fitted a gamma distribution (eqn (1)) to the WN first-order ISI distribution (e.g. Fig. 10A). The gamma function was chosen for its ability to characterize the relative rate of rise and fall in the first-order ISIH distributions of all the unit types examined in this study:
Figure 11. Relationship between the peak of first-order ISIH in response to WN and the peak of the interval enhancement plot for single units.
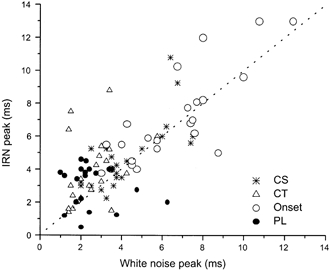
The peak of the first-order ISIH in response to WN is plotted on the abscissa. The peak was estimated from a gamma fit to the ISIH distribution. The peak of the gamma fit to the interval enhancement plot in response to IRN is plotted on the ordinate. The dotted line indicates when the two values are equal. The correlation between the two measurements is greatest for OC and CS units (see Table 1). Note that onset units (○) generally had the largest values and PLs (•) the smallest. Units classified as CT (▵) had values similar to PL units whereas CS units (*) had values that overlapped those of the other three unit types.
Figure 12. Relationship between the peak of the first-order ISIH in response to WN and unit best frequency.

The peak response to the WN distribution was calculated from the gamma fit to the first-order ISIH. The greatest range of peaks was found for OC units in the 5-10 kHz octave.
Figure 10. Estimation of the peak in the first-order ISIH for WN and the peak in the interval enhancement.

A, an example of a WN first-order ISIH and the fitted gamma function for an OC unit (0287006). Best frequency was 1.07 kHz. B, the interval enhancement is shown by the continuous line and filled squares. The best-fitting gamma function for the interval enhancement is shown by the dashed line. The peaks, as estimated from the maximum height in the gamma functions, are shown on the figure.
| (1) |
This best-fitting gamma distribution was then subtracted from the first-order ISI distribution in response to the IRN. The difference between the number of intervals at the IRN delay in the two distributions was the interval enhancement. The interval enhancement distribution was then itself fitted with a gamma function (see Fig. 10B).
RESULTS
The data presented in this paper come from 105 units for which we have analysed their temporal responses as a function of the delay of the IRN stimulus. For a small subset of units we have measured their response to the period of RPH and CPH stimuli.
Single units were classified by the shape of their PSTH and their discharge regularity (Bourk, 1976; Young et al. 1985; Rhode & Smith, 1986; Blackburn & Sachs, 1989). In this study, we have divided the units into one of four groups (Fig. 3): primary-like (PL; n = 23), sustained chopper (CS; n = 24), transient chopper (CT; n = 27) and onset units (O; n = 23). A further eight units were classified as unusual as they did not fit into the above scheme. The PL unit has a high probability of discharge just following the stimulus onset followed by an exponential decline to a steady-state rate. The ISIH also has an exponential decline and is multi-peaked, which is indicative of the unit's ability to phase-lock well to low-frequency sounds (Bourk, 1976; Rhode & Smith, 1986; Blackburn & Sachs, 1989; Winter & Palmer, 1990a). The regularity analysis revealed that the unit is characterized by irregular firing (CV > 0.5). In contrast the CS unit is characterized by a sequence of regularly spaced peaks in the PSTH that are unrelated to stimulus frequency. The ISIH has a narrow peak at the chopping period and the regularity analysis confirmed the regularity of the sustained discharge (the mean and standard deviation remain constant over the analysis period). The constant regularity, with a CV less than 0.35, identifies this unit as a CS (Young et al. 1985). If the PSTH was characterized by regular peaks but the CV was greater than 0.35 the unit was classified as a CT. Finally, the onset unit is characterized by a very high probability of discharge at stimulus onset, often followed by a pause and then a low level of discharge. In Fig. 3 we have chosen to show the response of an onset unit to a 50 dB suprathreshold tone burst at the unit's best frequency. This sound level was chosen because the unit had a reasonably high level of steady-state discharge rate which permitted the calculation of the unit's discharge regularity. The CV was 0.35 which placed it in-between the regular dischargers and the irregular dischargers (cf. Young et al. 1985; Winter & Palmer, 1995). The high, narrow peaks in the temporal adaptation pattern and the first-order ISIH pattern identify this unit as an OC.
Figure 3. Examples of the unit types found in the VCN.
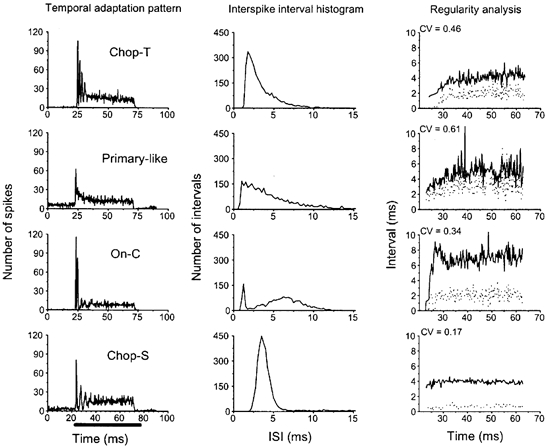
All PSTHs were obtained in response to 50 ms suprathreshold tone bursts, 20 dB above threshold at the unit's best frequency. The bar beneath the lowest PSTH indicates the temporal position of the tone burst. The middle column shows the first-order ISIHs. The right column is a measure of a unit's discharge regularity (see Methods for details of calculation). The continuous line indicates the mean interspike interval; the dotted line indicates the standard deviation of the interspike interval. Note that a low coefficient of variation (CV < 0.5) indicates a unit with a regular discharge pattern. The PSTH for the OC unit was obtained in response to a 50 dB suprathreshold tone-burst in order to generate enough spikes to calculate the regularity of spike discharge.
Responses of single units to IRN
The all-order ISIHs from an OC unit in response to IRN, RPH and CPH, as a function of stimulus period, are shown in Fig. 4. The upper row shows the response to WN of equal energy (it is identical for all 3 columns). Note the change in the ordinate scale for the responses to the CPH stimuli. There was a peak in each histogram corresponding to the delay of the IRN stimulus or the period of the harmonic complex for all delays/periods greater than 2 ms. In addition there were often peaks at integer multiples of the delay/period. In contrast, Fig. 5 shows the first-order ISIHs for the same unit and stimuli. There was no peak at a delay of 22.4 ms for the IRN or at an f0 of 45 Hz for the harmonic complexes; however, at 11.2 ms there was a large peak indicating a larger number of intervals at this delay/period. We have chosen to quantify these results by subtracting the ISIH response to the WN from the ISIH response to the complex pitch-producing stimuli and then measuring the magnitude of the response at the appropriate delay. We refer to an increase in intervals beyond the magnitude of the WN response as interval enhancement. Figure 6 shows the normalized interval enhancement plots of ISIs for all the different stimulus types as a function of periodicity. There was a clear peak in the function for all three types of stimuli in the first-order statistics; we refer to this response as band-pass periodicity tuning. The enhancement for all-order ISIs was much broader, reflecting the strong enhancement seen even at delays as long as 32 ms.
Figure 4. All-order interval statistics in response to IRN, RPH and CPH stimuli as a function of stimulus period.
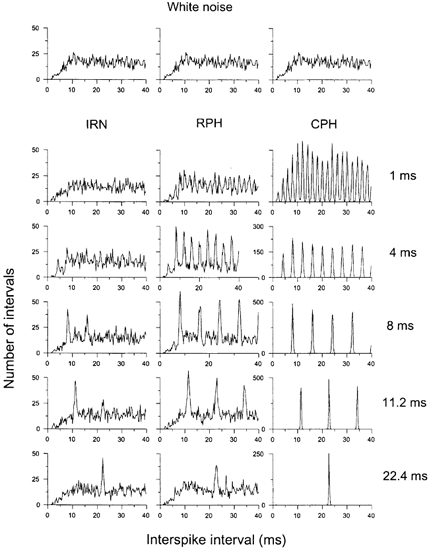
The unit was classified as an OC unit (211003) and had a best frequency of 11.2 kHz. The top row is the response to the equal energy WN stimulus; for comparison purposes it is shown in each column. Note the peak in the ISIH at the delay of the IRN stimuli (left column) and at the reciprocal of the delay for the RPH and CPH stimuli (middle and right columns).
Figure 5. First-order interval statistics in response to IRN, RPH and CPH stimuli as a function of stimulus period.
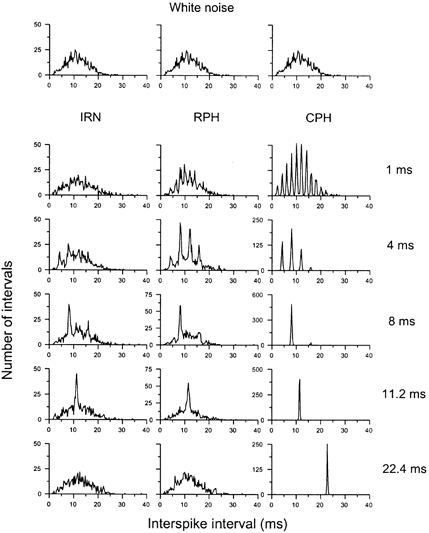
Same OC unit as shown in Fig. 4. Note the peak at an ISI equal to the stimulus delay for periods 4 ms and greater. However, in contrast to the all-order statistics shown in Fig. 4 there is no peak evident for a delay of 22.4 ms in response to the IRN or at 45 Hz (1/delay) for the RPH complex. For the CPH complex, which has the most distinct peaks in its waveform, there is a clear response even at 45 Hz (1/delay).
The response of a CS unit as a function of the delay of IRN or the period of the harmonic complexes is shown in Fig. 7A. In response to the IRN the largest interval enhancement appeared at a delay of 4 ms. A similar preference was found for the response to RPH stimuli (Fig. 7B) and CPH stimuli (Fig. 7C).
The responses of PL units often resemble the responses observed in their auditory nerve fibre input; however, they can be accompanied by evidence of inhibitory inputs that are not evident in the responses of auditory nerve fibres (Winter & Palmer, 1990a;Caspary et al. 1993; Ruebsamen et al. 1999). The possibility of inhibition places a constraint on the interpretation of results from this unit type. The response of a PL unit to IRN with delays from 1 to 16 ms is shown in Fig. 8. For small delays there was a peak at the interval corresponding to the delay of the IRN in the first-order interval statistics. This peak was not always, however, the dominant peak in the ISI distribution and it was usually absent for stimuli with delays greater than 11.2 ms. The all-order response is shown in the right column of Fig. 8. Note that there are peaks in this representation for all of the IRN delays. In Fig. 9 we plot the normalized interval enhancement as a function of the delay of the IRN stimulus. This plot shows a strong enhancement for small delays but for delays longer than 11.2 ms there was no evidence for any interval enhancement in the first-order ISIs.
Figure 8. First-order and all-order interval histograms of the responses to IRN stimuli as a function of stimulus period for a PL unit.

(Unit 227010.) Best frequency was 2.74 kHz. The first-order ISIHs are shown on the left. There is a clear peak in these histograms for periods between 1 and 8 ms; however, this is in contrast to the all-order ISIHs, where a clear peak can even be seen at a delay of 16 ms. The WN control stimulus is shown in the top row. Note the change in ordinate scale for the 1 ms condition.
Comparison of the responses to broadband noise and IRN
It is clear from the results presented above (see Fig. 5 and Fig. 8) that there is a relationship between the first-order ISI in response to WN and the periodicity tuning seen in response to IRN. To quantify this relationship we have chosen to fit the WN first-order ISIH with a gamma distribution and then compare this fit with a gamma function fitted to the interval enhancement plot. The gamma function was chosen for its ability to easily fit the range of first-order ISIHs observed in response to the IRN stimulus. Examples of the result of the fitting procedure are shown in Fig. 10 for a unit classified as OC. The position of the peak fitted to the noise ISIH distribution and that of the peak fitted to the IRN interval enhancement plot were similar. Figure 11 shows the relationship between the peak of the gamma fit to the IRN as a function of the peak of the gamma fit to the WN. Units classified as onset exhibited peaks between 3 and 13 ms. Of these 23 onset units 16 were classified as OC. PL units (including PL with a notch) showed a preference for the shortest delays (5 ms or less) while units classified as CS showed preferences for delays between 3 and 10.8 ms. Units classified as CT showed interval enhancement at shorter delays than their CS counterparts. There was no significant difference between the mean peak enhancement for CT and PL units. However, it should be noted (Table 1) that there was a significant difference between the peak in response to WN and the peak in response to IRN for CT units. There was a tendency for the points to lie above the line of unity indicating that the maximum enhancement in response to the IRN stimulus was at lower frequencies (longer delays) than the peak in the first-order ISIH. There was no significant difference between the peak in the response to WN and the peak in response to IRN for the CS, OC and PL unit types. The correlation between the WN and IRN peak responses is shown in Table 1. There was very little correlation for PL units, a weak correlation for CT units and strong correlations for the CS and OC unit types.
Table 1.
Mean and standard deviation of the peak in the first-order ISIH in response to WN and the peak in the interval enhancement plot
| PL | CT | CS | Onset | |
|---|---|---|---|---|
| White noise (ms) | 2.5 ± 1.21 | 2.42 ± 1.08 | 4.45 ± 1.83 | 6.55 ± 2.36 |
| Interval enhancement (ms) | 3.1 ± 1.21 | 3.53 ± 2.02 * | 4.88 ± 2.1 | 7.05 ± 2.61 |
| Correlation | −0.15 | 0.44 | 0.72 | 0.81 |
Significant difference between peak in interval enhancement and peak in WN (Student's one-tailed t test at P < 0.05).
The relationship between the peak in the response to WN and unit best frequency (for best frequencies in the range 0.5-15 kHz) is shown in Fig. 12. For all unit types there was a spread of best frequencies over which interval enhancement was observed. The greatest range of peaks was found for OC units. In keeping with previous studies (Rhode & Smith, 1986; Winter & Palmer, 1995) we have not recorded from OC units with best frequencies less than 1 kHz.
DISCUSSION
In this study we have shown that single units in the VCN can enhance the representation of the delay of IRN in their all-order and first-order ISI distributions. The enhancement was dependent on the magnitude of the delay; although there was overlap between unit types, PL and CT units enhanced the short delays whereas CS and OC units enhanced the longer delays. The implications of these findings for the neural encoding of the pitch of complex sounds are discussed below.
The role of OC units in encoding the delay of IRN
OC units encode the pitch of voiced speech sounds with remarkable fidelity and may respond to the ambiguous pitches of in-harmonic complexes (Kim et al. 1986; Palmer & Winter, 1992, 1993; Rhode, 1994, 1995). They also respond to the pitch of amplitude-modulated noise in a manner that is similar to their response to 200 % amplitude-modulated tones (Rhode, 1994).
In order to explain the remarkable precision of spike timing in these units several authors have speculated that a form of across-frequency coincidence detection must be employed by these units (Rhode & Smith, 1986; Kim et al. 1986; Palmer & Winter, 1996). The wide bandwidth of OC units is certainly beneficial for the encoding of envelope periodicity (e.g. steady-state vowels; Kim et al. 1986). However, Wiegrebe & Patterson (1999b) showed that spectral integration decreases the effective envelope modulation for IRN stimuli. Thus, an envelope-based code would be expected to be worse in OC units than in narrowly tuned units. The smaller interval enhancement in response to IRN in comparison with the response of the same unit to RPH and CPH stimuli (see Fig. 5) is consistent with an envelope-following response from OC units; however, it does not preclude the unit from responding to the fine structure.
If OC units are involved in the encoding of the delay of IRN then it is important to know the termination site of their axonal projections. A few studies have examined this question, either directly or indirectly, and increasingly it appears that units with an OC PSTH shape may provide wideband inhibition both within the cochlear nuclear complex and also to the contralateral cochlear nucleus. OC units have been recorded from large multipolar cells within the ventral division of the cochlear nucleus (Smith & Rhode, 1989). In their study an axon of an OC unit was seen coursing through the DCN seemingly en route to the exit pathways of the posteroventral cochlear nucleus (PVCN) and DCN, the intermediate and dorsal acoustic striae. In slices of the mouse cochlear nucleus, Oertel et al. (1990) have identified a cell that may be homologous to OC units in vivo (their stellate-D cell). This cell had a dorsally projecting axon and formed connections with other multipolar cells in the VCN and with fusiform cells in the DCN. In a study on the rat cochlear nucleus, Doucet & Ryugo (1997) have shown that intracellular labelling in the fusiform layer of the DCN labels large multipolar cells in the PVCN; they hypothesized that these large multipolar cells correspond to OC units. The connection of these cells in the cochlear nucleus is likely to be inhibitory as their terminals stain positively for glycine and are characterized by pleomorphic vesicles in their synaptic endings (Smith & Rhode, 1989). In further studies, Doucet et al. (1999) have shown that large multipolar cells located in the PVCN project to the contralateral cochlear nucleus. The current anatomical information about OC units would seem to argue against them playing a role in the encoding of the pitch of complex sounds and suggests that other unit types (e.g. PL and chopper units) may play a more pivotal role; however, until we have a more detailed picture of the anatomical projections of OC units it would be premature to rule them out completely.
The role of CS and CT units in encoding the delay of IRN
It has been proposed that the regular discharge pattern seen in the responses of chopper units may serve as a stage of temporal processing that converts the all-order ISI representation of the pitch of complex sounds at the level of the auditory nerve into a first-order ISI code (Frisina et al. 1990; Kim et al. 1990). This hypothesis requires an array of chopper units with a range of best periodicities in iso-frequency laminae of the cochlear nucleus. The range of intrinsic oscillations seen in the unanaesthetized cat (90-500 Hz) was smaller than the range of best periodicities observed in response to IRN stimuli in this study (77-2000 Hz). However, it should be noted that the value of 2000 Hz or 0.5 ms was obtained from the gamma fit to the IRN interval enhancement plot; the upper limit for first-order interval enhancement should be around 1000 Hz or 1 ms, as determined by the refractory period. The narrow range of best periodicities in PL units would appear to rule them out in the encoding of the long delays in terms of their first-order ISIs (see Fig. 10 and Table 1). The range of best periodicities was larger for CT units but the correlation with the peak WN response was poor. However, both CS and OC units show a larger range of best periodicities. If the regular discharge pattern observed in chopper units is responsible for the interval enhancement seen in this paper, and the best modulation frequency observed in other studies, then one should find a close correlation between intrinsic chopping frequency and interval enhancement. In the study by Frisina et al. (1990) there was little correlation between intrinsic chopping frequency and best periodicity (their best modulation frequency). However, in the study by Kim et al. (1990) a much closer relationship was found between a unit's intrinsic oscillation and its best modulation frequency. Kim et al. (1990) attributed this to their method of estimating a unit's intrinsic oscillation and/or a difference in unit type. The best correlation in their study was found in CS units. If the response to WN is also a good measure of a units intrinsic oscillation then the results in the present study support the findings of Kim et al. (1990). In addition, in this study, we have also observed a good correlation between ‘intrinsic chopping frequency’ and best periodicity in OC units (see Figs 4, 10 and 11).
If the intrinsic oscillation seen in chopper units conveys the pitch of complex sounds then it is important to know what is the range of pitches evoked by complex sounds. Recent studies suggest that the lower limit of pitch in humans is approximately 30 Hz (Krumbholz et al. 2000). This value is considerably lower than the lowest best oscillation frequencies seen in chopper units of the cat and guinea-pig. However, if the lower limit of pitch is similar in these species and humans, such low pitches could be represented by the low frequency tail of the periodicity tuning curve. A further possibility is that the low pitches are represented by the OC units, which show a range of best periodicities from 3 to 13 ms. Units classified as CT and PL do enhance the shortest delays seen in the IRN stimuli of this study. This result is in agreement with Kim et al. (1990) who showed that the PL units were best at encoding high modulation rates. The weak correlation between the periodicity tuning and the peak in the WN ISIH for CT units is in keeping with the observation of Frisina et al. (1990) who found little correlation between the chopping frequency to best frequency tone bursts and the peak enhancement in response to sinusoidal amplitude modulation. However, like Kim et al. (1990), we did find a good correlation between the peak in periodicity tuning and the maximum WN response for units classified as CS. It is possible that the response to the WN provides a better estimate of the intrinsic oscillation of these units than does the response to best frequency tone bursts.
This study has concentrated on the responses of single units in the ventral division of the cochlear nucleus; however, the dorsal division may also be important for the temporal encoding of the pitch of complex sounds. Kim et al. (1990) have shown that units classified as pause/build show oscillatory behaviour in response to single tones and amplitude-modulated stimuli. This appears to be similar to the oscillatory behaviour of OC units. It has been hypothesized that units classified as OC may provide an inhibitory input to pause/build units (Nelken & Young, 1994, Winter & Palmer, 1995) and it is possible that the inhibitory input, if it is tuned, may impose an intrinsic rhythm upon the pause/build units. Of course, this does not preclude the possibility that both of these cell types generate their periodicity encoding de novo. Pause/build units also show a robust representation of AM in the presence of background noise (Frisina et al. 1994). At levels of 0 dB signal to noise ratio, the responses to the AM signal were as strong as those in quiet.
Comparison with previous studies using IRN
There have been relatively few studies that have examined the encoding of IRN in the central auditory pathway. Direct comparisons can be made with the studies of Shofner (1991, 1999) who looked at the temporal encoding of RN and infinitely RN in the AVCN of the chinchilla. Shofner (1991) observed that 59 % of units had features in their responses that were related to the delay of the RN. However, it should be remembered that RN (1 iteration) produces a pitch percept that is considerably weaker than that produced by the 16 iterations used in this study. Interestingly, Shofner (1991) also found that the majority of units with features related to the delay of the RN were characterized by low best frequencies, where phase-locking would be strong. This result contrasts with the results in this paper (see Fig. 12) where units with best frequencies well removed from the phase-locking region could encode the delay of IRN in terms of their first-order interval statistics.
Although the range of IRN periods in Shofner's paper (Shofner, 1991) was 1-10 ms, there appeared to be no difference between the response to WN and the response to RN with delays of 1 and 2 ms. This is in contrast with the results shown in this paper where a PL unit was shown to enhance delays as short as 1 ms, although once again this may be a function of the number of iterations. The response of PL units has been likened to that of primary auditory nerve fibres. To date the only study to have examined the response of auditory nerve fibres reported that fibres in the cat were able to encode the delay of RN in their all-order interval statistics (Ten Kate & Buunen, 1988). Shofner (1991) also reported the response of chopper units in the AVCN. Most chopper units failed to encode the delay of RN in their temporal discharge characteristics but some were characterized by a broad peak in their temporal response at the delay of the RN. Shofner (1999) has argued that units with a PL PSTH shape were the most likely carriers of pitch-related information based on their responses to IRN stimuli with negative gain. These stimuli elicit ambiguous pitches that were only signalled in the temporal discharge patterns of PL units. The responses of non-PL units (mainly choppers) largely reflected the stimulus envelope and not the fine timing in the waveform structure. Similar results have been found by others when looking at the response of chopper units to complex stimuli (e.g. Frisina et al. 1990; Palmer & Winter, 1993; Rhode & Greenberg, 1994; Rhode, 1995). If OC or CS units are to encode the pitch of complex sounds in their first-order ISIHs then they must respond to the shift in time intervals associated with the pitch of IRN with negative gain and they must also remain stable over a wide range of sound levels.
Of relevance here is the response to other complex stimuli that produce ambiguous pitches, analogous to those produced by IRN stimuli produced with negative gain. Palmer & Winter (1993) have shown that some units, classified as OC, could represent the ambiguous pitches by peaks at the corresponding time intervals in the all-order ISIH. OC and chopper units in the cochlear nucleus of the cat (Rhode, 1995) have also been shown to preserve information about the ambiguous pitches of AM stimuli in their first-order ISIHs. The issue of whether single units in the cochlear nucleus of the guinea-pig can signal the presence of ambiguous pitches in response to IRN computed with a negative gain remains to be resolved.
A further test of a units’ involvement in pitch perception is the stability of the representation as a function of sound level. Our perception of pitch changes very little with increasing sound level (Terhardt, 1975) and this could distinguish between the use of first-order and all-order ISIs (e.g. Carianni & Delgutte, 1996a). In a small number of units Wiegrebe & Winter (2001) have shown that units identified as CS may indeed respond in a level-independent manner. This was in contrast to OC units whose best periodicity appeared to change with increases in sound level. Wiegrebe & Winter (2001) concluded that a sub-population of CS units, characterized by flat-saturation, were potential candidates for encoding the pitch of complex sounds in terms of their first-order ISIs. Others have looked at the encoding of sinusoidally amplitude-modulated tones as a function of sound level and have shown that the chopper units change their response from low-pass to a band-pass function at higher sound levels (Frisina et al. 1990). However, Frisina et al. (1990) did not distinguish between CT and CS units and our results suggest that this may be important when looking at their responses to regular interval sounds.
Summary
Our results support the idea that units classified as CS and OC in the VCN may be good candidates for the encoding of the pitch of complex sounds in terms of their first-order temporal discharge patterns for a wide range of frequencies. While it remains a moot point as to the range of pitches heard by the guinea-pig, neither OC or CS units show a sufficient range of best periodicities to encompass the entire range of pitches perceived by humans, but the overlap is substantial. CT and PL units may be particularly important for encoding relatively high pitches (> 500 Hz). Units that respond best to periodicities less than approximately 80 Hz have yet to be identified but such low pitches may be encoded by the skirts of the interval enhancement curve of either OC or CS units.
Acknowledgments
This work was supported by the Wellcome Trust and the MRC. L.W. was supported by a research grant from the Deutsche Forschungsgemeinschaft. R.D.P. was supported by an MRC programme grant (G9703469). Mark Radon and Alex Saxby participated in some of the early experiments as part of their undergraduate degree at the University of Cambridge. We thank Katrin Krumbholz and Daniel Pressnitzer for advice on the manuscript and the implementation of the gamma fits.
References
- Blackburn CC, Sachs MB. Classification of unit types in the anteroventral cochlear nucleus: PST histograms and regularity analysis. Journal of Neurophysiology. 1989;62:1303–1329. doi: 10.1152/jn.1989.62.6.1303. [DOI] [PubMed] [Google Scholar]
- Bourk TR. PhD thesis. Cambridge, MIT, MA: 1976. Electrical responses of neural units in the anteroventral cochlear nucleus of the cat. [Google Scholar]
- Cariani PA, Delgutte B. Neural correlates of the pitch of complex tones. I. Pitch and pitch salience. Journal of Neurophysiology. 1996a;76:1698–1716. doi: 10.1152/jn.1996.76.3.1698. [DOI] [PubMed] [Google Scholar]
- Cariani PA, Delgutte B. Neural correlates of the pitch of complex tones. II. Pitch shift, pitch ambiguity, phase-invariance, pitch circularity, rate pitch, and the dominance region of pitch. Journal of Neurophysiology. 1996b;76:1717–1734. doi: 10.1152/jn.1996.76.3.1717. [DOI] [PubMed] [Google Scholar]
- Caspary DM, Palombi PS, Backoff PM, Helfert RH, Finlayson PG. GABA and glycine inputs control discharge rate within the excitatory response area of primarylike and phase-locked neurons. In: Merchan MA, Juiz J, Godfrey DA, Mugnaini E, editors. The Mammalian Cochlear Nuclei: Organization and Function. New York: Plenum Press; 1993. pp. 239–252. [Google Scholar]
- Cohen MA, Grossberg S, Wise LL. A spectral network model of pitch perception. Journal of the Acoustical Society of America. 1995;98:862–879. doi: 10.1121/1.413512. [DOI] [PubMed] [Google Scholar]
- Doucet JR, Ross AT, Gillespie MB, Ryugo DK. Glycine immunoreactivity of multipolar neurons in the ventral cochlear nucleus which project to the dorsal cochlear nucleus. Journal of Comparative Neurology. 1999;408:515–531. [PubMed] [Google Scholar]
- Doucet JR, Ryugo DK. Projections from the ventral cochlear nucleus to the dorsal cochlear nucleus in rats. Journal of Comparative Neurology. 1997;385:245–264. [PubMed] [Google Scholar]
- Frisina RD, Smith RL, Chamberlain SC. Encoding of amplitude modulation in the gerbil cochlear nucleus: I. A hierarchy of enhancement. Hearing Research. 1990;44:99–122. doi: 10.1016/0378-5955(90)90074-y. [DOI] [PubMed] [Google Scholar]
- Frisina RD, Walton JP, Karcich KJ. Dorsal cochlear nucleus single neurons can enhance temporal processing capabilities in background noise. Experimental Brain Research. 1994;102:160–164. doi: 10.1007/BF00232448. [DOI] [PubMed] [Google Scholar]
- Griffiths TD, Buchel C, Frackowiak RSJ, Patterson RD. Analysis of temporal structure in sound by the human brain. Nature Neuroscience. 1998;1:422–427. doi: 10.1038/1637. [DOI] [PubMed] [Google Scholar]
- Hartmann WM. Pitch, periodicity, and auditory organization. Journal of the Acoustical Society of America. 1996;100:3491–3502. doi: 10.1121/1.417248. [DOI] [PubMed] [Google Scholar]
- Kim DO, Rhode WS, Greenberg SR. Responses of cochlear nucleus neurones to speech signals: neural encoding of pitch, intensity and other parameters. In: Moore BCJ, Patterson RD, editors. Auditory Frequency Selectivity: A NATO Advanced Research Workshop. New York: Plenum Press; 1986. pp. 281–288. [Google Scholar]
- Kim DO, Sirianni JG, Chang SO. Responses of DCN-PVCN neurons and auditory-nerve fibres in unanaesthetised decerebrate cats to AM and pure tones: Analysis with autocorrelation/power spectrum. Hearing Research. 1990;45:95–113. doi: 10.1016/0378-5955(90)90186-s. [DOI] [PubMed] [Google Scholar]
- Krumbholz K, Patterson RD, Pressnitzer D. The lower limit of pitch as determined by rate discrimination. Journal of the Acoustical Society of America. 2000;108:1170–1180. doi: 10.1121/1.1287843. [DOI] [PubMed] [Google Scholar]
- Meddis R, Hewitt MJ. Virtual pitch and phase sensitivity studied using a computer model of the auditory periphery. I: Pitch identification. Journal of the Acoustical Society of America. 1991a;89:2866–2882. [Google Scholar]
- Meddis R, Hewitt MJ. Virtual pitch and phase sensitivity studied using a computer model of the auditory periphery. II: Phase sensitivity. Journal of the Acoustical Society of America. 1991b;89:2883–2894. [Google Scholar]
- Merrill EG, Ainsworth A. Glass coated platinum tipped tungsten microelectrodes. Medical and Biological Engineering. 1972;10:662–672. doi: 10.1007/BF02476084. [DOI] [PubMed] [Google Scholar]
- Nelken I, Young ED. Two separate inhibitory mechanisms shape the responses of dorsal cochlear nucleus type IV units to narrowband and wideband stimuli. Journal of Neurophysiology. 1994;71:2446–2462. doi: 10.1152/jn.1994.71.6.2446. [DOI] [PubMed] [Google Scholar]
- Oertel D, Wu SH, Garb MW, Dizack C. Morphology and physiology of cells in slice preparations of the posteroventral cochlear nucleus of mice. Journal of Comparative Neurology. 1990;295:136–154. doi: 10.1002/cne.902950112. [DOI] [PubMed] [Google Scholar]
- Palmer AR, Russell IJ. Phase-locking in the cochlear nerve of the guinea pig and its relationship to the receptor potential of inner hair cells. Hearing Research. 1986;24:1–15. doi: 10.1016/0378-5955(86)90002-x. [DOI] [PubMed] [Google Scholar]
- Palmer AR, Winter IM. Cochlear nerve and cochlear nucleus response to the fundamental frequency of voiced speech sounds and harmonic complex tones. In: Cazals Y, Demany L, Horner K, editors. Auditory Physiology and Perception. Oxford: Pergamon; 1992. pp. 231–239. [Google Scholar]
- Palmer AR, Winter IM. Coding of the fundamental frequency of voiced speech sounds and harmonic complex tones in the ventral cochlear nucleus. In: Merchan MA, Juiz J, Godfrey DA, Mugnaini E, editors. Mammalian Cochlear Nuclei: Organization and Function. New York: Plenum Press; 1993. pp. 373–384. [Google Scholar]
- Palmer AR, Winter IM. The temporal window of two-tone facilitation in onset units of the ventral cochlear nucleus. Audiology and Neurootology. 1996;1:12–30. doi: 10.1159/000259199. [DOI] [PubMed] [Google Scholar]
- Patterson RD. The sound of a sinusoid: spectral models. Journal of the Acoustical Society of America. 1994;96:1409–1418. [Google Scholar]
- Patterson RD, Allerhand MH, Giguerre C. Time-domain modeling of peripheral auditory processing: a modular architecture and a software platform. Journal of the Acoustical Society of America. 1995;98:1890–1894. doi: 10.1121/1.414456. [DOI] [PubMed] [Google Scholar]
- Pressnitzer D, Patterson RD. Distortion products and the pitch of harmonic complex tones. In: Breebaart D, Houtsma A, Kohlrausch A, Prijs V, Schoonhoven R, editors. Proceedings of the 12th International Symposium on Hearing: Physiological and Psychophysical Bases of Auditory Function. Maastrict: Shaker BV; 2001. pp. 97–104. [Google Scholar]
- Pressnitzer D, Patterson RD, Krumbholz K. The lower limit of melodic pitch. Journal of the Acoustical Society of America. 2001;109:2074–2084. doi: 10.1121/1.1359797. [DOI] [PubMed] [Google Scholar]
- Rhode WS. Temporal encoding of 200 % amplitude modulated signals in the ventral cochlear nucleus of the cat. Hearing Research. 1994;77:43–68. doi: 10.1016/0378-5955(94)90252-6. [DOI] [PubMed] [Google Scholar]
- Rhode WS. Interspike intervals as a correlate of periodicity in cat cochlear nucleus. Journal of the Acoustical Society of America. 1995;97:2414–2429. doi: 10.1121/1.411963. [DOI] [PubMed] [Google Scholar]
- Rhode WS, Greenberg SR. Encoding of amplitude modulation in the cochlear nucleus of the cat. Journal of Neurophysiology. 1994;71:1797–1825. doi: 10.1152/jn.1994.71.5.1797. [DOI] [PubMed] [Google Scholar]
- Rhode WS, Smith PH. Encoding timing and intensity in the ventral cochlear nucleus of the cat. Journal of Neurophysiology. 1986;56:261–286. doi: 10.1152/jn.1986.56.2.261. [DOI] [PubMed] [Google Scholar]
- Ruebsamen R, Kopp C, Dorrscheidt G. Dynamics of neuronal excitation and inhibition in the auditory brainstem. In: Dau T, Hohhmann V, Kollmeier B, editors. Psychophysics, Physiology and Models of Hearing. Singapore: World Scientific Press; 1999. pp. 15–20. [Google Scholar]
- Shofner WP. Temporal representation of rippled noise in the anteroventral cochlear nucleus of the chinchilla. Journal of the Acoustical Society of America. 1991;90:2450–2466. doi: 10.1121/1.402049. [DOI] [PubMed] [Google Scholar]
- Shofner WP. Responses of cochlear nucleus units in the chinchilla to iterated rippled noises: Quantitative analysis of neural autocorrelograms of primarylike and chopper units. Journal of Neurophysiology. 1999;81:2662–2674. doi: 10.1152/jn.1999.81.6.2662. [DOI] [PubMed] [Google Scholar]
- Slaney M, Lyon R. Proceedings of the International Conference on Acoustics, Speech and Signal Processing. New Mexico: Alburquerque; 1990. A perceptual pitch detector; p. 90. [Google Scholar]
- Smith PH, Rhode WS. Structural and functional properties distinguish two types of multipolar cells in the ventral cochlear nucleus. Journal of Comparative Neurology. 1989;282:595–616. doi: 10.1002/cne.902820410. [DOI] [PubMed] [Google Scholar]
- Srulovicz P, Goldstein JL. A central spectrum model: synthesis of auditory-nerve timing and place cues in monaural communication of frequency spectrum. Journal of the Acoustical Society of America. 1983;73:1266–1276. doi: 10.1121/1.389275. [DOI] [PubMed] [Google Scholar]
- Stabler SE, Palmer AR, Winter IM. Temporal and mean rate discharge patterns of single units in the dorsal cochlear nucleus of the anaesthetised guinea pig. Journal of Neurophysiology. 1996;76:1677–1688. doi: 10.1152/jn.1996.76.3.1667. [DOI] [PubMed] [Google Scholar]
- Ten Kate JH, Van Bekkum MF. Synchrony-dependent autocorrelation in eighth-nerve fiber response to rippled noise. Journal of the Acoustical Society of America. 1988;84:2092–2102. doi: 10.1121/1.397054. [DOI] [PubMed] [Google Scholar]
- Terhardt E. Influence of intensity on the pitch perception of complex tones. Acustica. 1975;33:344–348. [Google Scholar]
- Wiegrebe L, Patterson RD. The role of modulation in the pitch of high-pass filtered iterated rippled noise. Hearing Research. 1999a;132:94–108. doi: 10.1016/s0378-5955(99)00040-4. [DOI] [PubMed] [Google Scholar]
- Wiegrebe L, Patterson RD. Quantifying the distortion products generated by amplitude-modulated noise. Journal of the Acoustical Society of America. 1999b;106:2709–2718. doi: 10.1121/1.428099. [DOI] [PubMed] [Google Scholar]
- Wiegrebe L, Winter IM. Temporal representation of iterated rippled noise as a function of delay and sound level in the ventral cochlear nucleus. Journal of Neurophysiology. 2001;85:1206–1219. doi: 10.1152/jn.2001.85.3.1206. [DOI] [PubMed] [Google Scholar]
- Winter IM, Palmer AR. Responses of single units in the anteroventral cochlear of the guinea pig. Hearing Research. 1990a;44:161–178. doi: 10.1016/0378-5955(90)90078-4. [DOI] [PubMed] [Google Scholar]
- Winter IM, Palmer AR. Temporal responses of primarylike anteroventral cochlear nucleus units to the steady-state vowel/i/ Journal of the Acoustical Society of America. 1990b;88:1437–1441. doi: 10.1121/1.399720. [DOI] [PubMed] [Google Scholar]
- Winter IM, Palmer AR. Level dependence of cochlear nucleus onset unit responses and facilitation by second tones or broadband noise. Journal of Neurophysiology. 1995;73:141–159. doi: 10.1152/jn.1995.73.1.141. [DOI] [PubMed] [Google Scholar]
- Yost WA. The pitch of iterated rippled noise. Journal of the Acoustical Society of America. 1996a;100:511–518. doi: 10.1121/1.415873. [DOI] [PubMed] [Google Scholar]
- Yost WA. The pitch strength of iterated rippled noise. Journal of the Acoustical Society of America. 1996b;100:3329–3335. doi: 10.1121/1.416973. [DOI] [PubMed] [Google Scholar]
- Yost WA, Patterson RD, Sheft S. A time domain description for the pitch strength of iterated rippled noise. Journal of the Acoustical Society of America. 1996;99:1066–1078. doi: 10.1121/1.414593. [DOI] [PubMed] [Google Scholar]
- Yost WA, Patterson RD, Sheft S. The role of the envelope in processing iterated rippled noise. Journal of the Acoustical Society of America. 1998;104:2349–2361. doi: 10.1121/1.423746. [DOI] [PubMed] [Google Scholar]
- Young ED, Robert J-M, Shofner WP. Regularity and latency of units in ventral cochlear nucleus: Implications for unit classification and generation of response properties. Journal of Neurophysiology. 1985;60:1–29. doi: 10.1152/jn.1988.60.1.1. [DOI] [PubMed] [Google Scholar]