

Abstract
Electrophysiological effects of endothelin-1 (ET-1) were studied in rabbit sinoatrial node (SAN) using conventional microelectrode and whole-cell voltage and current recordings.
In rabbit SAN, RT-PCR detected ETA endothelin receptor mRNA. ET−1 (100 nm) increased the cycle length of action potentials (APs) from 305 ± 15 to 388 ± 25 ms; this effect was antagonised by the ETA receptor-selective antagonist BQ−123 (1 μm). ET-1 increased AP duration (APD50) by 22 %, depolarised the maximum diastolic potential (MDP) from −59 ± 1 to −53 ± 2 mV, shifted the take-off potential by +5 mV and decreased the pacemaker potential (PMP) slope by 15 %. Under exactly the same experimental conditions, ET-1 caused a positive chronotropic effect in guinea-pig SAN with a decrease of 13 % in APD50, a shift of −4 mV in the take-off potential and an increase of 8 % in the PMP slope.
Rabbit SAN exhibited two major cell types, distinguished both by their appearances and by their electrophysiological responses to ET-1. Whereas the spontaneous pacing rate and the PMP slope were similarly decreased by ET-1 (10 nm) in both cell types, ET-1 depolarised MDP from −67 ± 1 to −62 ± 4 mV in spindle-shaped cells but hyperpolarised it from −73 ± 1 to −81 ± 3 mV in rod-shaped cells. ET-1 decreased APD50 by 8 and 52 % and shifted the take-off potential by +5 and −9 mV in spindle- and rod-shaped cells, respectively.
ET-1 decreased the high-threshold calcium current (ICaL) by about 50 % in both cell types, without affecting its voltage dependence, and decreased the delayed rectifier K+ current (IK) with significant shifts (of +4.7 and +14.0 mV in spindle- and rod-shaped cells, respectively) in its voltage dependence. It was exclusively in rod-shaped cells that ET-1 activated a sizeable amount of time-independent inward-rectifying current.
The hyperpolarisation-activated current (If), observed exclusively in spindle-shaped cells, was significantly increased by ET-1 at membrane potentials between −74.7 and −84.7 mV whereas it was significantly decreased at more negative potentials. ET−1 significantly decreased the slope of the current-voltage (I–V) relation of the If tail without changing its half-maximum voltage.
The overall negative chronotropic influence of ET-1 on the whole rabbit SAN is interpreted as resulting from the integration of its different actions on spindle- and rod-shaped SAN cells through electrotonic interaction.
The endothelins (ETs) are a family of potent endogenous peptides, consisting of 21 amino acid residues, termed endothelin-1, -2 and -3 (ET-1, -2 and -3) (Inoue et al. 1989). The first member of the family, ET-1, was initially described as a potent vasoconstrictor produced by vascular endothelial cells (Yanagisawa et al. 1988). ETs have a wide variety of biological actions that are mediated by specific cell-surface receptors belonging to the superfamily of heptahelical G-protein coupled receptors. To date, two subtypes of endothelin receptors, named ETA and ETB, have been identified (Arai et al. 1990; Sakurai et al. 1990; Hosoda et al. 1991; Lin et al. 1991; Sakamoto et al. 1991). The ETA receptor has an affinity rank order of ET-1 > ET-2 >> ET-3, whereas the ETB receptor exhibits similar affinities for all three isopeptides. It has been shown that ETA and ETB receptors couple with distinct signal transduction pathways through different populations of GTP-binding proteins and that they have distinct cell-type and/or tissue distributions. In the body, all of these combine to confer the wide variety of functions of the endothelin system (Masaki et al. 1992; Goto et al. 1996).
In the heart, ET-1 was initially reported to exert strong positive inotropic (Ishikawa et al. 1988a) and chronotropic actions (Ishikawa et al. 1988b). These effects were first believed to be mediated by augmentation of the high-threshold, long lasting, voltage-dependent calcium channel current ICaL, since they were cancelled by blockers of ICaL. However, later electrophysiological studies showed that ET-1 failed to increase ICaL in guinea-pig ventricular myocytes (Tohse et al. 1990). Hence, there have so far been no satisfactory data which can explain in electrophysiological terms such strong cardiotonic actions of ET-1, although the effect of ET-1 in increasing ICaL (Lauer et al. 1992) and the T-type calcium current, ICaT (Furukawa et al. 1992), has been documented. In contrast, our electrophysiological studies have disclosed that ET-1 can exert a negative chronotropic action, mediated by the ETA receptor, under the stimulation of the β-adrenoceptor (Ono et al. 1994, 1995a, b). We have found that stimulation of the ETA receptor hyperpolarises the resting membrane potential and decreases the duration of AP in guinea-pig and rabbit atrial myocytes by activating the muscarinic potassium current (IK(ACh)) and by inhibiting the ICaL (Ono et al. 1994, 1995b). Recently, quite similar results have been reported indicating that ET-1 reduces the ICaL and the delayed rectifier potassium current (IK) in single rabbit SAN cells and decreases the rate of spontaneous APs in small clusters of SAN cells (Tanaka et al. 1997). More recently we have demonstrated the distinct roles of ETA and ETB receptors in negative and positive chronotropic responses, respectively, in guinea-pig and rat heart (Ono et al. 1998).
The SAN cells play a central role in the initiation and hormonal regulation of heart pacing (DiFrancesco, 1993; Irisawa et al. 1993). During the last decade, intensive electrophysiological studies using isolated SAN cells have revealed the contribution of several distinct ionic currents to the pacemaker activity of the SAN (Irisawa et al. 1993). The most important ionic currents are ICaL (Hagiwara et al. 1988; Brown & Denyer, 1989), ICaT (Hagiwara et al. 1988), the hyperpolarisation-activated inward current, If (DiFrancesco, 1986, 1993; DiFrancesco et al. 1986; DiFrancesco & Tortora, 1991), IK (Anumonwo et al. 1992), IK(ACh) (Sakmann et al. 1983), the sustained inward current, Ist (Guo et al. 1995), and the background sodium current (Hagiwara et al. 1992). Modulation of these currents by plasma membrane receptors, such as β-adrenoceptors and muscarinic acetylcholine receptors, have also been well documented (DiFrancesco, 1993; Irisawa et al. 1993). However, very little is known about the ionic basis for the strong chronotropic actions of ETs in SAN.
During the past decade, histological investigations on the architecture of the SAN have revealed that it is composed of several types of cells with quite divergent morphological appearances (Opthof et al. 1985; Verheijck et al. 1998). Correspondingly, regional variations within the SAN in the configuration of APs (Verheijck et al. 1998), in the contribution of ionic currents (Kodama et al. 1997) and in the responses to pharmacological agents (Nikmaram et al. 1997) have been reported. Therefore, it is important, in order to understand the activity and response of the whole SAN, to elucidate possible differences among cell types within the SAN in their responses to endogenous modulators, including ET-1.
In the present study, we found that ET-1 causes a negative chronotropic response in rabbit SAN through stimulation of the ETA receptor. The underlying ionic mechanisms for this negative chronotropic action of ET-1 were further examined by analysing the effects of ET-1 on membrane currents, using the whole-cell voltage clamp technique. Striking differences were found between two major, morphologically distinct types of SAN cells in ET-1-induced changes in spontaneous activity and in the underlying membrane currents. These data provide insight into the mechanisms of negative chronotropy of ET-1 in each cell type and into their contribution to the overall response of the SAN to ET-1. Preliminary results have been reported previously (Ono et al. 1997).
METHODS
All procedures were carried out in accordance with the ethical guidelines of the National Institute of Health Sciences, Japan, for animal experimentation.
Measurement of heart rate in the right atrium
Adult male albino rabbits (Jla; JW strain, 1.5-2.5 kg) and adult male guinea-pigs (Hartley strain, 300-350 g) were purchased from Japan Laboratory Animals, Inc. (Tokyo, Japan). The whole heart was removed after the animals were injected with heparin (300 U kg−1, i.p.) and deeply anaesthetised with sodium pentobarbital (100 mg kg−1i.p. for rabbits; 50 mg kg−1i.p. for guinea-pigs). The right atrium of the rabbit was dissected out in modified Krebs solution and attached to an organ bath containing 20 ml of the modified Krebs solution kept at 37 °C with a basic tension of 0.5 g. After equilibration for 30-60 min, continuously bubbled with 95 % O2-5 % CO2, cumulative applications of ET-1 were started. BQ-123 was applied 20 min prior to the application of ET-1. The right atrial rate was counted using the Mac-Lab system (Analog Digital Instruments, NSW, Australia) by monitoring the spontaneous contractions with a force-displacement transducer (TB611-T, Nihon Kohden, Japan) as described previously (Ono et al. 1995a).
Detection of ETA/ETB receptors using reverse transcriptase- mediated PCR (RT-PCR)
Ten micrograms each of total RNA were prepared from rabbit heart SAN, right atrium, left atrium, right ventricle and left ventricle including the interventricular septum. The total RNAs were reverse transcribed using Super Script II (Gibco BRL, Gaithersburg, MD, USA) and then subjected to RT-PCR. cDNAs for rabbit ETA and ETB receptors, encompassing the 2nd to the 4th intracellular loops, were amplified by Thermal Cycler 480 (Perkin Elmer, Norwalk, CT, USA) using the primer set: 5′-TCTGCGCGCTAAGTGTTGACAGGT-3′ (upper primer) and 5′-TCATCAGGCTTTAGGACTGGTAAC-3′ (lower primer) for the ETA receptor (Ono et al. 1998) and 5′-TCTCTGTGGT-TCTGGCTGTC-3′ (upper primer) and 5′-TGCTGAGGTGAAGGGGAAGC-3′ (lower primer) for the ETB receptor. The reactions were carried out under the following conditions: amplified with 30 cycles of 94 °C for 20 s, 55 °C for 30 s and 72 °C for 1 min, then extended at 72 °C for 10 min.
Conventional microelectrode recording
The transmembrane potential of SAN cells was recorded by a conventional microelectrode technique, as described previously (Agata et al. 1993). In brief, a preparation of the SAN area of either rabbit or guinea-pig was dissected out according to Denyer & Brown (1990) and pinned down onto a silicone block placed in an organ bath containing 20 ml of modified Krebs solution which was kept at 36 ± 0.5 °C and continuously bubbled with 95 % O2-5 % CO2. Spontaneous APs were recorded with conventional glass microelectrodes filled with 3 m KCl (resistance 15-50 MΩ). The microelectrode was coupled via an Ag-AgCl2 junction to a microelectrode preamplifier that provided capacity compensation (MEX-7101, Nihon Kohden, Tokyo, Japan). The membrane potential signal was displayed on an oscilloscope (VC-10, Nihon Kohden) and automatically digitised into a personal computer (PC-9801VX, NEC, Tokyo, Japan) through an A/D converter board (Canopus, Tokyo, Japan) for later off-line analyses. The same signal was also recorded on a DAT-based recorder (SONY, Japan) and the replayed signal was recorded on a Macintosh computer, using Mac-Lab, for further off-line analysis. The rate of AP generation was counted using a computed rate meter and the Mac-Lab Chart software (Analog Digital Instruments). After penetration of the microelectrode, a period of at least 5 min was allowed before application of ET-1, to ensure that the recordings were stable.
Isolation of rabbit SAN cells
SAN cells were enzymatically isolated using collagenase and elastase as described in Ono et al. (1989, 1994) and Ono & Giles (1991) with slight modifications. Briefly, the whole heart was attached to a Langendorff apparatus and retrogradely perfused at a hydrostatic pressure of 80 cmH2O with the following solutions in sequence: (1) normal Tyrode solution for 10 min, (2) 0-Ca2+ Tyrode solution, in which CaCl2 was omitted from the normal Tyrode solution, for 20 min, and (3) 0-Ca2+ Tyrode solution containing collagenase (42 U ml−1, Yakult, Japan) for 40 min. All the solutions were kept at 37 °C and continuously bubbled with 100 % O2. After this treatment, the SAN area was dissected out according to Denyer & Brown (1990) and cut, perpendicularly to the crista terminalis, into strips of 1 mm width and 3-5 mm length. The strips were further incubated in 0-Ca2+ Tyrode solution containing collagenase (200 U ml−1) and elastase (20 U ml−1, type I, Sigma Chemical Co., MO, USA) for 40 min, continuously bubbled with 100 % O2, at 37 °C and mildly shaken every 5 min. These procedures produced viable SAN cells, which showed a wide variety of morphological appearances and kept beating spontaneously in normal Tyrode solution. Of these, two major cell types, ‘spindle-shaped’ and ‘rod-shaped’ (Denyer & Brown, 1990), were used in the experiments reported here. The former type included both ‘elongated spindle’ (Muramatsu et al. 1996; Verheijck et al. 1998) and ‘spindle’ cells (Verheijck et al. 1998), both of which have thin and rounded ends and relatively faint striations. These two cell types were not distinguished from each other in the present study. The rod-shaped cells have clear striations and looked very much like the atrial-type cells described by Verheijck et al. (1998) but, in contrast to their finding, the cells showed spontaneous and regular beating. Cells were kept at 4 °C in Kraft-Brühe (KB) medium before use.
Whole-cell voltage clamp recording
Only SAN cells spontaneously beating in normal Tyrode solution were used in these experiments. Membrane potentials and currents were recorded from isolated single SAN cells with a single electrode patch-clamp technique in the whole-cell configuration, as described previously (Ono & Giles, 1991), using EPC-7 (List Electronic, Darmstadt/Eberstadt, Germany) and TM-1000 (ACT-ME Laboratories Inc., Tokyo, Japan) patch-clamp amplifiers. All recordings were done at 37 °C, unless otherwise noted. A gigaohm seal was established while the cell was kept spontaneously beating, carefully avoiding mechanical damage by the pipette tip. Signals were digitised at sampling speeds from 0.25 to 10 kHz, after Bessel filtering at 3 kHz, and acquired in PC-AT compatible computers (Deskpro 386s, Compaq, USA; PRO2266DL, Proside, Tokyo, Japan) using the Clampex software in pCLAMP, versions 5.5.1 and 8.0.0.81, (Axon Instruments Inc., Foster City, CA, USA) for later analyses using the Clampfit software (Axon Instruments Inc.) and MATLAB 386 (The Math Works Inc., Natick, MA,USA).
When evaluating the effect of ET-1 on the voltage dependence of ICaL, IK or If activation, superfusion of ET-1 was started just after obtaining the control I–V relation. During the superfusion of ET-1, the membrane potential was kept at holding potential and no test pulse was applied until the next activation-voltage relation for IK or If was recorded. ICaL was repetitively induced during the superfusion of ET-1, at an interval of 5 s, with a depolarising test pulse to -4.7 mV until achievement of the maximal effect of ET-1 was obtained. The I–V relation in the presence of ET-1 was then recorded.
Any offset voltage appearing when the patch pipette was introduced into the external medium close to the cell was nulled by the offset compensation of the patch-clamp amplifiers. It was calculated (using Peter Barry's software as included in Axoscope version 1.1.1, Axon Instruments Inc.) that the junction potential was -14.7 mV at 37 °C and -14.0 mV at 20 °C with the extracellular and pipette solutions described below. This was compensated for in the recordings of APs and I–V relations presented in the figures. The series resistance remaining after its compensation was of the order of 1-2 MΩ. Therefore, the resultant possible voltage clamp error was minimal, i.e. less than 3 mV, even for the measurement of the peak size of ICaL or the maximum activation of IK and If, and was not corrected for.
Nystatin-perforated patch recordings were made by the second variant of the method described by Yawo & Chuhma (1993), in which N-methyl-d-glucamine (NMG) and methanesulfonic acid were used in place of fluorescein in the nystatin-methanol stock solution.
Solutions
Superfusates
Modified Krebs solution contained (mm): NaCl 113.0, KCl 4.8, glucose 5.5, NaHCO3 25.0, CaCl2 2.2, MgSO4 1.2, KH2PO4 1.2, and was bubbled with 95 % O2-5 % CO2 at 37 °C. Normal Tyrode solution contained (mm): NaCl 135.0, KCl 5.4, glucose 5.5, Hepes 5.0, CaCl2 1.8, MgCl2 0.5, NaH2PO4 0.33, and the pH was adjusted to 7.4 with NaOH and the solution bubbled with 100 % O2. When the tail current of If was measured, the bath solution contained 3 mm NiCl2 to block the calcium current and the Na+-Ca2+ exchange current, and 3 mm BaCl2 to block IK1 and IK(ACh). KB medium contained (mm): l-glutamic acid (mono potassium salt) 50.0, taurine 10.0, KCl 25.0, KH2PO4 10.0, EGTA 0.5, Hepes 10.0, MgCl2 3.0, d-glucose 10.0, and the pH was adjusted to 7.4 with KOH.
Internal solutions
The composition of the pipette solution was (mm): l-aspartic acid (mono potassium salt) 120.0, KCl 30.0, EGTA 0.05, Hepes 5.0, Na2ATP 4.0, MgCl2 1.0, adjusted to pH 7.2 with KOH. When If was measured, the EGTA concentration was 5 mm. For nystatin-perforated patch recordings, the final concentrations of nystatin, NMG and methanesulfonic acid in the pipette solution were 250 μg ml−1, 5 mm and 5 mm, respectively. All these compounds were of analytical grade.
Solutions of peptides and chemicals
When measuring contractions of right atria and in microelectrode studies, ET-1 (Peptide Institute Inc., Minoh, Osaka, Japan) and BQ-123 (American Peptide Co., Sunnyvale, CA, USA) were dissolved in distilled water at concentrations 200-fold greater than the desired final concentrations and an aliquot was applied to the organ bath. In patch-clamp studies, all the peptides and other chemicals were dissolved in normal Tyrode solution and applied by superfusion at about 2.0 ml min−1 in a recording chamber of ≈0.2 ml capacity that was attached over an inverted phase-contrast microscope, TMD-1000 (Nikon, Japan). TTX and E-4031 (1-[2-(6-methyl-2-pyridyl)ethyl]-4-(4-methylsulfonylaminobenzoyl)piperidine) were from Wako Pure Chemical Industries Ltd (Osaka, Japan).
Statistical analyses
All values are expressed as means ±s.e.m. and vertical bars in graphs indicate ±s.e.m. The statistical difference between two groups was tested by ANOVA and Student's t test. Time-dependent changes in AP parameters were tested by repeated measures ANOVA, using the Statview software (Abacus Concepts Inc., CA, USA). A value of P < 0.05 was considered to be statistically significant. The value of P for statistical significance is indicated in the table and in figures by *, ** and *** or †, †† and ††† for P < 0.05, P < 0.01 and P < 0.001, respectively.
RESULTS
Effects of ET-1 on spontaneous electrical activity in rabbit and guinea-pig SANs, as recorded with microelectrodes
In order to know the overall effect of ET-1 on the electrophysiological activity of the SAN, the membrane potential in the ex vivo central SAN region was recorded by a conventional microelectrode technique. Figure 1 shows representative examples of the effects of ET-1 (100 nm) on the shape of APs and the rate of spontaneous pacing in SANs isolated from rabbit (A) and from guinea-pig (B).
Figure 1. Effect of ET-1 (100 nm) on the shape of spontaneous action potentials (APs) obtained using a conventional microelectrode technique in sinoatrial node tissues from rabbit (A) and guinea-pig (G-P, B).
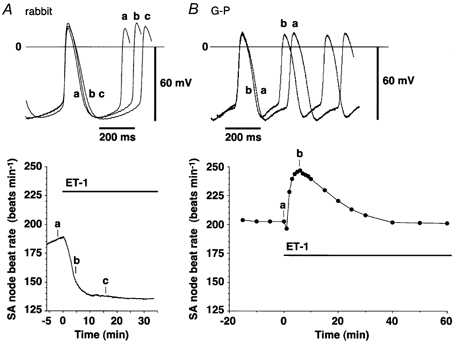
Upper panels, superimposed traces of spontaneous APs. a, control; b and c, in the presence of ET-1 (100 nm). The time at which each trace was recorded is indicated in the lower panel. Lower panels, time courses of changes in the rate of spontaneous generation of APs. The application of ET-1 is indicated by a horizontal bar.
In rabbit SAN, ET-1 produced a profoundly negative chronotropic response that developed with rapid onset, progressed relatively slowly and lasted for a long period (Fig. 1A and Fig. 2A). In good agreement with the time course of this negative chronotropic effect, ET-1 gradually lengthened the duration of the AP at 50 % repolarisation (APD50, Fig. 1A and Fig. 2A) and decreased the slope of the diastolic depolarisation (Fig. 1A). The take-off potential was slightly shifted in the positive direction by ET-1 (Fig. 1A).
Figure 2. Time courses of changes in AP parameters after application of ET-1 (100 nm) to the whole sinoatrial node of rabbit (A) and guinea-pig (G-P, B).
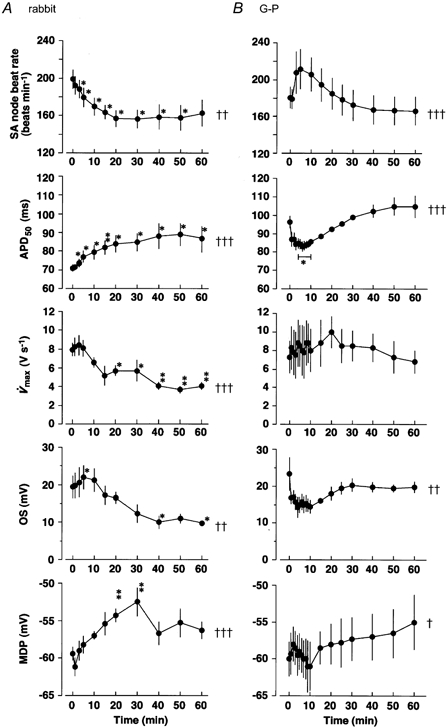
Recordings were made using a conventional microelectrode technique. Each point represents a mean value obtained from five (rabbit) or four (guinea-pig) independent experiments. Abscissa, time after application of ET-1. Ordinate: sinoatrial (SA) node beat rate, frequency of AP generation; APD50, duration of AP to 50 % repolarisation; V̇max, maximum upstroke velocity of AP; OS, overshoot potential; MDP, maximum diastolic potential. †, †† and †††: significantly time dependent. * and **: significantly different from the value at time = 0. See Methods for levels of significance.
ET-1 also gradually decreased the overshoot potential (OS) (Fig. 2A and Fig. 3). V̇max, the maximum rate of rise of the AP, was below 10 V s−1 in our observations, which ensured that the recordings were made from the central SA nodal region (Kodama et al. 1997; Nikmaram et al. 1997). ET-1 gradually decreased V̇max along with the development of its negative chronotropic effect and significantly depolarised MDP (Fig. 2A and Fig. 3).
Figure 3. Concentration-response relationship of ET-1-induced changes in AP parameters of rabbit sinoatrial node tissue, as recorded by the conventional microelectrode technique.
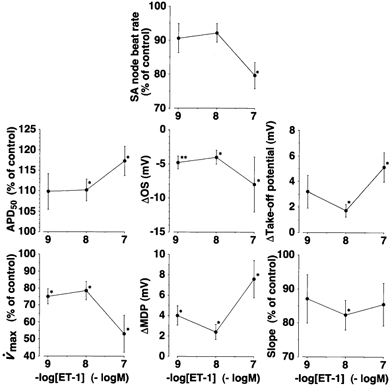
Ordinate, change in each parameter expressed either in units (Δ) or as a percentage (%), assuming the value obtained in the absence of ET-1 (Control) to be 100 % in each preparation. Each value was obtained when the effect of ET-1 reached a maximum level. Abscissa, concentration of ET-1 (-logm). Each point represents a mean value obtained from five different experiments. Data for different concentrations of ET-1 were obtained from different preparations. Ordinate: Δtake-off potential, change in take-off potential; Slope, slope of the PMP. For other definitions, see Fig. 2. * and **: significantly different from the value obtained at the time of ET-1 application (time = 0 in Fig. 2).
As these effects were the opposite of the positive chronotropic effects reported in guinea-pig heart (Ishikawa et al. 1988b; Ono et al. 1998), we next compared the effects of ET-1 in guinea-pig SAN under exactly the same experimental conditions used for rabbit SAN. Guinea-pig SAN was found to respond to ET-1 in a totally different manner. The beat rate changed with a triphasic time course; it slightly decreased at first, thereafter rapidly and greatly accelerated for the first 5 min and then gradually decreased, coming near to control values after 40 min. This was consistent with the time courses of the chronotropic responses to ET-1 obtained in the isolated right atria of guinea-pigs, which we previously analysed in detail (Ono et al. 1998). Figure 2B summarises the time courses of changes in the AP configuration in guinea-pig SAN. In parallel with the time course of the increase in the beat rate, ET-1 slightly depolarised MDP and decreased the overshoot potential. In contrast to that in rabbit SAN, the APD50 in guinea-pig SAN was significantly decreased by ET-1 along a time course also parallel with that of the positive chronotropic response (Fig. 1B and Fig. 2B). Approximately 5 min after starting the application of ET-1, when the positive chronotropic effect reached its maximum, the PMP slope was slightly increased from 78.6 ± 2.5 (n = 37) to 84.9 ± 4.8 mV s−1 (n = 44) and the take-off potential was significantly shifted (P < 0.01) in the hyperpolarising direction from -51.2 ± 0.7 (n = 37) to -55.0 ± 1.1 mV (n = 44) in four different preparations. V̇max was not significantly affected by ET-1 (Fig. 2B).
The concentration dependence of ET-1-induced changes in AP configuration in rabbit SAN tissue is summarised in Fig. 3. The negative chronotropic response to ET-1 was concentration dependent. ET-1 increased APD50, decreased V̇max and OS, depolarised MDP, displaced the take-off potential to less negative potentials and decreased the slope of the diastolic depolarisation. All these effects were found to be statistically significant (Fig. 3), although we did not see a clear concentration dependency in some of these parameters at concentrations between 10−9 and 10−8m and, therefore, not all the parameters appeared to change in parallel with the decrease in the beating rate. These data clearly show that, in rabbit SAN, ET-1 causes a negative chronotropic response by acting directly on the electrophysiological activities in this area. It is notable that ET-1 caused a negative chronotropic response even without pre-elevation of the sinus rate in this species, whereas, in the guinea-pig heart, ET-1 caused a negative chronotropic response only when the heart rate was pre-elevated by positive chronotropic agents such as isoprenaline (Ono et al. 1995a).
Negative chronotropic effect of ET-1 in isolated rabbit right atrium
In order to see the overall chronotropic effect of ET-1 on the heart, we applied the peptide cumulatively over the concentration range 0.01-100 nm to isolated rabbit right atria and measured the rate of spontaneous contractions (Fig. 4A). ET-1 in this concentration range produces a positive chronotropic effect in other species (Ishikawa et al. 1988b; Ono et al. 1995a, 1998). It did not, however, exert a positive chronotropic response over the whole concentration range. Instead, it showed a mild negative chronotropic response at very high concentration (100 nm). BQ-123, an ETA receptor-selective antagonist, partially but significantly relieved this effect, indicating that ETA receptors are involved in the negative chronotropic effect of ET-1. A positive chronotropic effect was hardly ever observed even in the presence of BQ-123 in rabbit heart, in contrast to guinea-pig and rat hearts (Ono et al. 1998).
Figure 4. Concentration-response curves showing the chronotropic effect of ET-1 on isolated rabbit right atria (A) and RT-PCR analysis of the distribution of mRNAs for ETA and ETB receptors in rabbit heart (B).
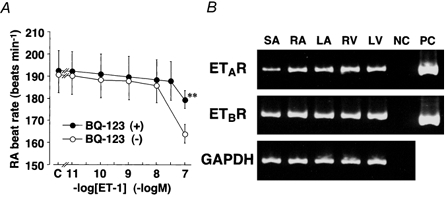
A, ET-1 was applied in a cumulative manner in the absence (○) or presence (•) of BQ-123 (10−6m). Ordinate, rate of spontaneous beating in right atria (RA beat rate). Abscissa, concentration of ET-1 (-logm). C, basal RA rate before the application of ET-1. Each point represents the mean of five independent experiments in the absence (BQ-123 (-)) or four independent experiments in the presence (BQ-123 (+)) of BQ-123. Vertical bars denote s.e.m.**: significantly different from BQ-123 (-). B, SA, sinoatrial node; RA and LA, right and left atrium; RV and LV, right and left ventricle; NC, negative control; PC, positive control (mRNAs for human ETA and ETB receptors). The nucleotide sequences of cDNAs for rabbit ETA and ETB receptors were deposited in the DNA Data Bank of Japan (DDBJ) under the accession numbers D83954 and AB043704, respectively.
Distribution of ET receptor subtypes in rabbit heart
The distribution of the subtypes of ET receptor in different cardiac tissues of the rabbit was examined using RT-PCR (Fig. 4B). It was found that all regions of the rabbit heart, including SAN, express both ETA and ETB receptor mRNAs. The subjective measurement of ETB receptor mRNA detection spots suggested that the density of these were similar whether from atria, ventricles or SAN, whereas the densities of ETA receptor mRNA detection spots indicated a somewhat lower expression in SAN than in atria or ventricles.
Effect of ET-1 on the AP configuration in isolated single rabbit SAN cells
To further investigate the effects of ET-1 at the single cell level, we used isolated rabbit SAN cells of spindle- and rod-shaped morphology. Cells of both types displayed rhythmic contractions in normal Tyrode solution at 37 °C. Using the whole-cell configuration of the patch-clamp, we compared the effects of ET-1 on AP configuration in both cell types, to obtain a basis for understanding the contribution of each cell type to the overall response to ET-1.
Figure 5 illustrates typical recordings of APs in spindle- and rod-shaped SAN cells and the time courses of changes in their configuration during the application of ET-1. Figure 6 summarises the results: ET-1 reduced the rate of the spontaneous generation of APs in both spindle- and rod-shaped cells to a similar extent and with a similar time course.
Figure 5. Effect of ET-1 (10 nm) on the configuration of spontaneous APs in single spindle- or rod-shaped cells isolated from rabbit sinoatrial node.
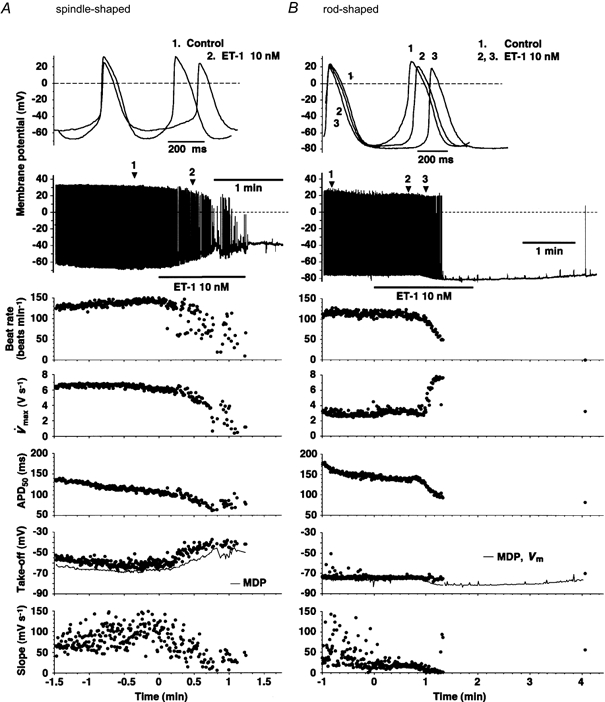
Representative examples are illustrated. Recordings were made by the whole-cell patch-clamp method in spindle-shaped (A) or rod-shaped (B) cells. In each panel the top drawing illustrates superimposed recordings of APs, obtained at the times marked on the chart recordings just below, which were obtained with a much slower sweep speed. Horizontal bars indicate the duration of ET-1 application. The graphs below the chart recordings illustrate the time course of each parameter of the AP configuration, as derived by analysing every AP present in the recorded data. Abscissa, time after application of ET-1. The scale corresponds with that of the chart recording above. Ordinate: beat rate, frequency of AP generation; V̇max, maximum upstroke velocity of AP; APD50, duration of AP to 50 % repolarisation; Take-off, take-off potential of AP; Slope, slope of PMP; Vm, resting membrane potential in the absence of AP.
Figure 6. Time courses of 10 nm ET-1-induced changes in the parameters of AP configurations in isolated spindle- and rod-shaped rabbit sinoatrial node cells.
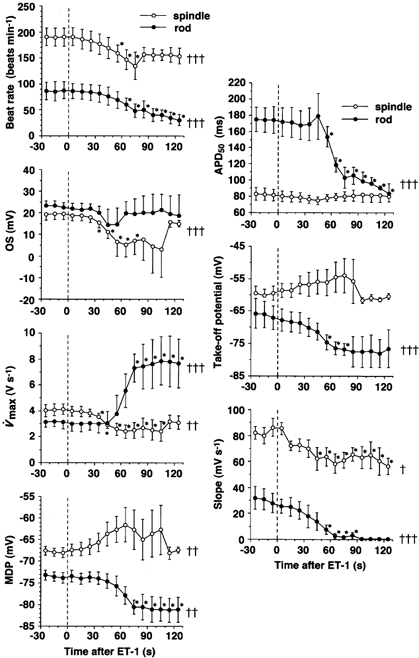
Typical recordings of APs in spindle- (○) and rod-shaped (•) cells are shown in Figs 5A and B, respectively. In this figure the abscissa represents time after application of ET-1 in seconds. ET-1 was applied at time = 0 and was present throughout. Each point represents a mean value obtained from seven different spindle-shaped or five different rod-shaped cells. Vertical bars denote s.e.m.†, †† and †††: significantly time dependent. *Significantly different from the value at time = 0. Abbreviations for the ordinates are as defined in Figs 2, 3 and 5.
In parallel with this negative chronotropic effect, ET-1 significantly decreased the slope of the diastolic depolarisation in both types of cells. APD50 was shortened only slightly in spindle-shaped cells and significantly in rod-shaped cells. However, several other parameters of AP configuration responded quite differently to ET-1 in one cell type as compared to the other. For example, spindle-shaped cells exhibited a relatively shallow MDP of around -67 mV, in which ET-1 (10 nm) consistently depolarised MDP and displaced the take-off potential in the more depolarised direction (Fig. 5A and Fig. 6). As the application of ET-1 was continued, MDP was further depolarised, which may be attributed to the cessation of spontaneous AP generation (Fig. 5A; Irisawa et al. 1993). ET-1 significantly decreased V̇max in this type of SAN cell (Fig. 6). The overshoot potential was significantly decreased by ET-1, in accordance with the changes in these two parameters. In contrast, rod-shaped cells exhibited significantly more negative MDP values around -73 mV, responded to ET-1 with significantly hyperpolarised MDP and showed significantly (more than twofold) increased V̇max, as the negative chronotropic effect progressed (Figs 5B, 6 and 8A). Hyperpolarisation of the MDP continued even after the cessation of AP generation. The overshoot potential was not affected significantly in this cell type (Fig. 5B and Fig. 6).
Figure 8. Involvement of fast Na+ current in the augmentation of V̇max during the ET-1-induced hyperpolarisation of rod-shaped rabbit sinoatrial node cells.
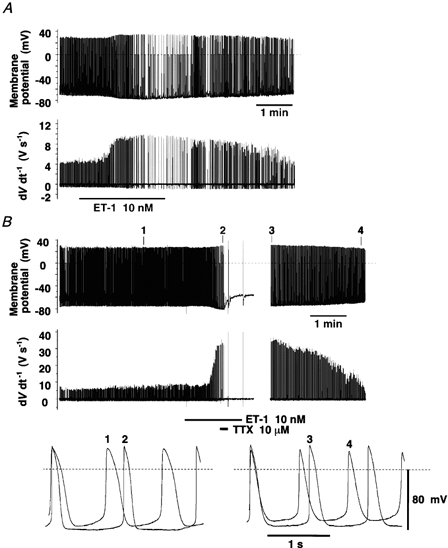
A, effect of 10 nm ET-1, alone, on the MDP and V̇max of the AP. B, effect of TTX (10 μm) in the presence of ET-1 (10 nm) on the MDP and V̇max. In each panel, the first and the second traces illustrate the AP and its dV dt−1, respectively. The bottom traces in B show the AP obtained at the times marked on the top trace. Dashed lines indicate 0 mV. ET-1 and TTX were applied during the time marked by the horizontal bars. Recordings were made by the ruptured whole-cell patch method at 25 °C. Similar recordings were obtained from two (A) and three (B) other rod-shaped sinoatrial node cells.
The MDP values in both cell types, as measured using patch-clamp electrodes corrected for the calculated pipette junction potential (Fig. 6), appear to be about 7 mV (spindle-shaped cells) or 17 mV (rod-shaped cells) more negative than those measured in multicellular preparations (Fig. 2), although it would be expected that the values for each cell type would bracket the one for intact SAN, owing to mutual electrotonic interaction. The reason for this discrepancy is not clear at present. However, as the effects of ET-1 in spindle- and rod-shaped cells have been studied under identical conditions, this should not alter our conclusions regarding the effects of ET-1 in isolated cells and the comparison of cell types. Care should also be taken when comparing our membrane potential data with those obtained by others, in which a correction would not have been made for the liquid junction potential.
We next examined whether or not the depolarisation of MDP upon application of ET-1, which we consistently observed in spindle-shaped cells, was merely an artefact of so-called ‘run down’ of the recording. We did this by obtaining longer and more stable recordings using the nystatin-perforated patch method. After a suitably long (> 8 min) control recording, during which the AP was quite stable, application of ET-1 caused a sustained depolarisation of the MDP with a great decrease in the PMP slope (Fig. 7). Moreover, washing out the peptide almost restored the MDP, along with the restoration of spontaneous APs. Thus, the effect of ET-1 was at least partly reversible. This result suggests that the depolarisation of MDP was not due to run down but was caused by ET-1. Also, we did not see any qualitative difference in the ET-1-induced changes in AP parameters in our ruptured and nystatin-perforated patch recordings.
Figure 7. Effect of ET-1 on the AP in a single spindle-shaped rabbit sinoatrial node cell, showing an extended recording and recovery after wash out of ET-1.
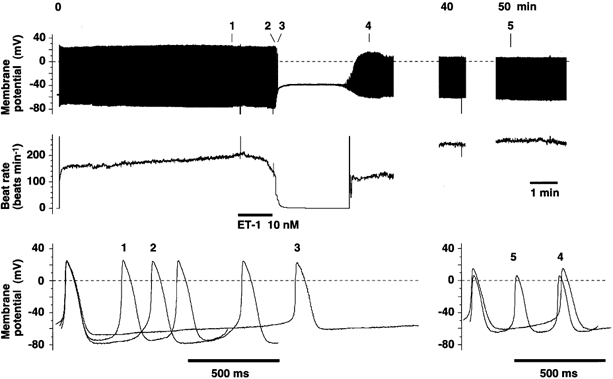
The top and the middle traces show the AP and the sinoatrial node beat rate, respectively. The bottom traces of APs were obtained at the times marked on the top panel. Dashed lines indicate 0 mV. The recording was made using the nystatin-perforated whole-cell patch method at 37 °C. ET-1 (10 nm) was applied during the period indicated by the horizontal bar, after 8 min of stable control recording. Continuous recording, up to a total of 50 min, revealed that washing out ET-1 restored the generation of APs. Similar recordings were consistently obtained from three other cells.
TTX (10 μm), alone, did not stop AP generation in rod-shaped cells when ET-1 was absent, as reported by Shinagawa et al. (2000), although it slightly decreased V̇max (not shown). However, TTX consistently stopped AP generation when V̇max was greatly increased in the presence of ET-1 (Fig. 8B). Under these conditions, a large depolarisation of the resting membrane potential was observed during application of TTX, but washing out TTX and ET-1 restored the MDP. This indicates that the depolarisation of the membrane by TTX was not due to run down of the recording. V̇max, increased in the presence of ET-1, almost returned to the initial level, in parallel with the recovery of the MDP (Fig. 8B).
In spindle-shaped cells, the take-off potential was displaced towards less negative potentials by ET-1 whereas, in rod-shaped cells, it was either unchanged or shifted in the negative direction during the continuous presence of ET-1 (Fig. 5 and Fig. 6). The PMP slope was eventually almost lost in rod-shaped cells in the presence of ET-1, along with the significant hyperpolarisation of MDP; at this stage, the spontaneous APs started to exhibit a very steep upstroke with a significant increase in V̇max (Figs 5B, 6 and 8). These results showed that the effect of ET-1 on the AP configuration was quite different, depending on the cell type. Comparison of these responses with that obtained with our conventional microelectrode recordings points to a clear discrepancy between the whole tissue and single rod-shaped cells in their APD50 response to ET-1. APD50 was increased by ET-1 in the whole tissue but was strongly decreased in single rod-shaped cells. However, it was clear that the effects of ET-1 on the OS, V̇max, MDP and the take-off potential in whole SAN tissue corresponded well with those observed in spindle-shaped cells, although these effects occurred faster and at somewhat lower ET-1 concentrations in these single cells than in the whole tissue.
ET-1-induced changes in membrane currents in rabbit SAN cells under whole-cell voltage clamp
In order to discover the ionic mechanisms contributing to the negative chronotropic response to ET-1 in rabbit SAN, we used isolated SAN cells to examine the effects of ET-1 on several membrane currents known to be responsible for the generation and regulation of pacemaking in the SAN (DiFrancesco, 1993; Irisawa et al. 1993). Several patterns of electrophysiological characteristics were found which could, again, be classified into two major types, correlating with the morphological appearance of the cell. Figure 9 illustrates the effects of ET-1 (10 nm) on membrane currents in spindle- (Fig. 9A) and rod-shaped (Fig. 9B) rabbit SAN cells. As was described above, all cells used here exhibited spontaneous and regular beats, as well as APs, in normal Tyrode solution.
Figure 9. Effect of ET-1 (10 nm) on membrane currents in spindle- and rod-shaped rabbit sinoatrial node cells.
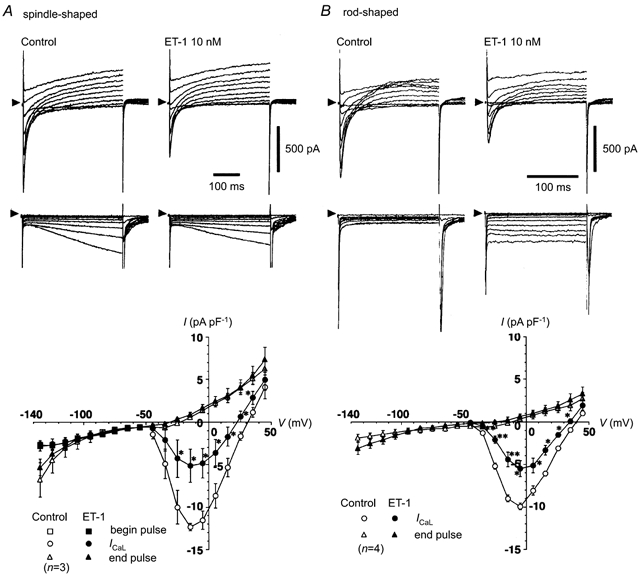
Whole-cell membrane currents, ICaL, If and the time-independent background current were recorded under voltage clamp in a spindle-shaped cell (A) and a rod-shaped cell (B). Top and middle traces, superimposed typical recordings of membrane currents before (Control) and after application of ET-1 (10 nm). The arrowheads indicate the absolute zero current level. Depolarising (-44.7 to +45.3 mV, top traces) or hyperpolarising (-134.7 to -64.7 mV, middle traces) test pulses of 500 ms (A) or 200 ms (B) duration were applied from a holding potential of -54.7 mV, with a 10 mV stepwise increment, starting at -134.7 mV, with an interval of 5 s. Bottom panels show the I–V relationship of each membrane current. Open and filled symbols indicate current sizes before and after application of ET-1, respectively. ○ and •, peak size of ICaL, measured as the current at the peak of the inward-going transient, relative to the absolute zero current; ▵ and ▴, current sizes measured at the end of the test pulse (end pulse); □ and □ (in A), the instantaneous current measured at the beginning of the hyperpolarising test pulses (begin pulse). Each point indicates the mean value obtained from three spindle-shaped (A) or four rod-shaped cells (B). Experiments were performed at 28 °C.
Spindle-shaped cells invariably exhibited hyperpolarisation-activated inward current, If, which was slightly decreased by ET-1 (10 nm) from -6.2 ± 1.0 to -5.0 ± 1.2 pA pF−1 when the current densities were measured at the end of the hyperpolarising test pulses (400 ms duration, -134.7 mV, Fig. 9A). The time-independent background current, which is known to be minimal in SAN cells (Irisawa et al. 1993; Guo et al. 1995), was not significantly affected by ET-1 even at such relatively high concentrations as 10 nm (Fig. 9A) or 100 nm (Fig. 10A). In fact, the holding current and the instantaneous inward current, which was measured upon hyperpolarisation to various test potentials, did not change significantly after application of ET-1 (Fig. 9A, see below). The capacitance of the spindle-shaped cells was 51.0 ± 1.5 pF (n = 76).
Figure 10. Time courses of changes in the magnitudes of ICaL and of the background current in response to ET-1 application in spindle- and rod-shaped sinoatrial node cells.
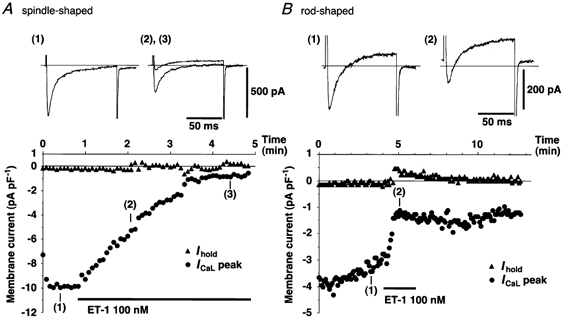
Recordings were made as ICaL was repeatedly induced in spindle- (A) and rod-shaped (B) cells, by the test potential of -4.7 mV for 100 ms duration from the holding potential of -54.7 mV, applied every 5 s. Top, actual recordings of the whole-cell currents, obtained at the times shown in the bottom panels. Horizontal lines indicate the absolute zero current level. Bottom, time courses of the holding current (▴) and the peak size of ICaL (•). Horizontal bars indicate the duration of ET-1 application (100 nm). Similar recordings were obtained consistently in six other spindle-shaped and five other rod-shaped cells. Experiments were performed at 28 °C.
In marked contrast, rod-shaped cells had a membrane capacitance of 65.4 ± 2.6 pF (n = 28) and none of them showed any detectable level of If in our experimental conditions (Fig. 9B). It is notable that they were, nevertheless, capable of generating APs spontaneously and regularly with distinct slow diastolic pacemaker depolarisation (Fig. 5B), which is consistent with the report of Shinagawa et al. (2000). In these cells, ET-1 slightly and transiently shifted the holding current in the outward direction (Fig. 10B) and produced a time-independent and inwardly rectifying current component (Fig. 9B) that was qualitatively identical to what we previously observed in atrial cells of both guinea-pig and rabbit (Ono et al. 1994, 1995b).
Analysis of the full I–V relation of the activation of the L-type calcium current, ICaL, showed that ET-1 dramatically decreased ICaL in both types of SAN cells, without affecting its voltage dependence (Fig. 9). ET-1 reduced the peak size of ICaL from -12.4 ± 0.4 to -5.1 ± 2.0 pA pF−1 (n = 3, P < 0.05, paired t test, measured at -14.7 mV) in spindle-shaped cells and from -10.0 ± 0.4 to -5.5 ± 0.9 pA pF−1 (n = 4, P < 0.01, paired t test, measured at -4.7 mV) in rod-shaped cells. Figure 10 illustrates the typical time course of the effect of ET-1 on ICaL, measured at -4.7 mV, and on the holding current measured at the holding potential of -54.7 mV. ET-1 was applied after a stable recording of ICaL was established. The results show that the decrease in ICaL was clearly distinguishable from any possible run down of the current. Here we may note that the decrease in the density of ICaL may account for the decreased V̇max and overshoot caused by ET-1 in spindle-shaped cells, whereas it contrasts with increased V̇max in rod-shaped cells. This point is further discussed later on.
Since the outward shift caused by ET-1 in the holding current in rod-shaped cells often lasted for a limited time, as we have previously shown in atrial myocytes (Ono et al. 1994, 1995), the full I–V relation study in Fig. 9 may not correctly evaluate the shift in the holding current by ET-1. Comparison of the time courses of the holding currents clearly demonstrates how differently these two types of SAN cells behaved in response to ET-1 (Fig. 10). ET-1 did not affect the holding current in spindle-shaped cells (ΔIhold= 3.4 ± 3.1 pA cell−1, or 0.07 ± 0.06 pA pF−1, n = 7, not significant compared with the basal level, Fig. 10A), whereas it strongly shifted the holding current in the outward direction in rod-shaped cells (ΔIhold= 37.6 ± 3.2 pA cell−1, or 0.56 ± 0.05 pA pF−1, n = 6, P < 0.001, compared with spindle-shaped cells, Fig. 10B).
Figure 11 shows the effect of ET-1 (10 nm) on the delayed rectifier K+ current, IK, in rabbit SAN cells with either spindle or rod morphology. Exposure to ET-1 for 5 min significantly decreased the activation of IK and its tail current. To estimate the relationship of the infinite activation variable to membrane voltage, the steady-state activation of the IK tail current was fitted by a Boltzmann distribution function:
Figure 11. Inhibition by ET-1 of IK in rabbit sinoatrial node cells.
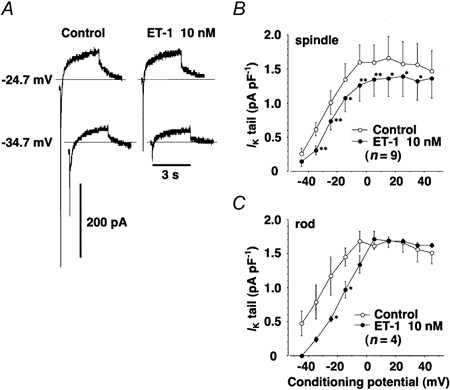
A, typical traces from IK recordings from spindle-shaped SAN cells in the absence (Control) or presence of ET-1 (10 nm), recorded at -34.7 and -24.7 mV during the study of steady-state activation of IK tail current shown in B. Horizontal lines indicate the absolute zero current level. B and C, the steady-state activation-voltage curve of the tail currents of IK in spindle- (B) and rod-shaped (C) SAN cells, in the absence (Control, ○) and presence of 10 nm ET-1 (•). IK was induced by depolarising conditioning pulses of 3 s duration between -44.7 and +45.3 mV from the holding potential of -54.7 mV, with 10 mV increments at intervals of 10 s; the tail currents were measured at the holding potential. Each point represents the mean of values obtained from nine (spindle-shaped, B) or four (rod-shaped, C) different cells. * and **: significantly different from control.
| (1) |
where n∞ is the dimensionless activation variable; Vm is the membrane potential; Vh is the half-activation voltage corresponding to n∞= 0.5 and K (in mV) is the slope factor (Giles et al. 1989). Values of Vh and K resulting from such analysis are summarised in Table 1. IK in spindle- and rod-shaped cells showed a similar voltage dependence of the steady-state activation in control conditions. ET-1 caused a significant rightward shift of Vh (by 4.7 mV in spindle-shaped and 14 mV in rod-shaped cells), whereas the slope factor, K, was not significantly affected by ET-1 in either type of cell (Fig. 11).
Table 1.
Kinetic properties of the voltage dependence of IK and If tail currents before (Control) and after application of ET-1 (10 nM)
| ET-1 | ||||
|---|---|---|---|---|
| Control | 3 min | 5 min | ||
| IK in spindle-shaped | Vh (mV) | −28.2 ± 2.4 | — | −23.5 ± 1.5 * |
| cells (n = 9) | K (mV) | −10.6 ± 1.1 | — | −9.1 ± 0.9 |
| IK in rod-shaped | Vh (mV) | −32.9 ± 4.6 | — | −18.9 ± 3.1 * |
| cells (n = 4) | K (mV) | −11.2 ± 1.4 | — | −9.9 ± 1.0 |
| If in spindle-shaped | Vh (mV) | −101.4 ± 1.5 | −100.2 ± 2.1 | −101.1 ± 2.5 |
| cells (n = 11) | K (mV) | 7.3 ± 0.2 | 9.2 ± 0.5 ** | 9.1 ± 0.3 *** |
IK was recorded in both spindle- and rod-shaped rabbit SAN cells and Ifin spindle-shaped cells. Values are means ±s.e.m. *, ** and ***: significant differences from the corresponding control values.
Next, the effect of ET-1 on If in spindle-shaped cells was analysed more precisely by using a longer test pulse than that used in Fig. 9. As the time course of the effect of ET-1 on If tail current clearly shows (Fig. 12), ET-1 (10 nm) strongly inhibited If induced by hyperpolarising test pulses to -114.7 mV. Elevation of the concentration of ET-1 did not cause a greater effect, but application of isoprenaline strongly increased If (Fig. 12, lower left panel), as is consistent with previous studies (Irisawa et al. 1993; DiFrancesco & Mangoni, 1994). It should also be noted here that ET-1 did not affect the holding current level under voltage clamp at -44.7 mV, even at such a very high concentration as 300 nm. This again indicated that ET-1 failed to activate the time-independent inwardly rectifying current in this type of SAN cell.
Figure 12. Effect of ET-1 (10 and 300 nm) and isoprenaline (1 μm) on the hyperpolarisation-activated current, If, recorded in spindle-shaped sinoatrial node cells of rabbit.
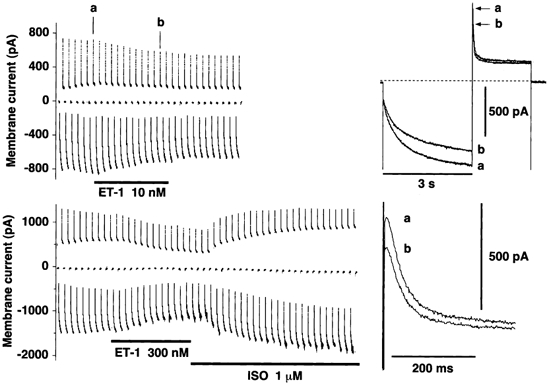
Left panels, time courses of If in response to a train of hyperpolarising conditioning pulses (to -114.7 mV for 3 s duration), each followed by a depolarising test pulse (to +5.3 mV for 2 s duration) to record the tail current, from the holding potential of -44.7 mV. The set of the hyperpolarising conditioning pulse and the depolarising test pulse was applied at an interval of 10 s. ET-1 (10 or 300 nm) or isoprenaline (ISO, 1 μm) were applied as indicated by horizontal bars. On the right are shown superimposed traces of If (upper) and expanded time scale images of their tail currents (lower), recorded at the times marked in the upper left trace. a, control; b,10 nm ET-1. Dotted line indicates the absolute zero current level.
Comparison of the current-voltage relation of the outward tail current of If, recorded at +5.3 mV before and after ET-1 clearly demonstrates that ET-1 decreased both the activation and the tail of If at very negative membrane potentials (Fig. 13). However, to our surprise, it was found that ET-1 increased the activation of If at shallower potentials, i.e. between -74.7 and -84.7 mV; If was activated by less hyperpolarised potentials in the presence of ET-1 (Fig. 13).
Figure 13. Effect of ET-1 on the I–V relation of the steady-state activation of If recorded in spindle-shaped sinoatrial node cells of rabbit.
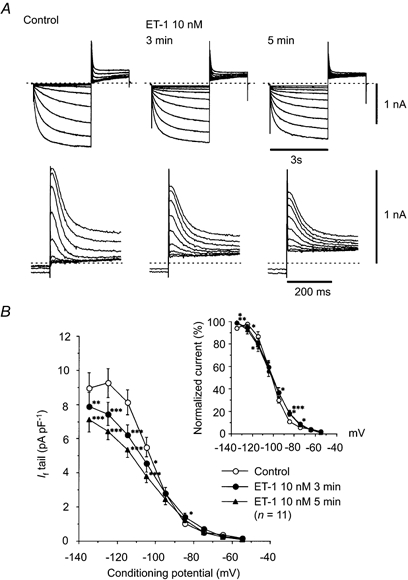
A, upper panel, typical superimposed recordings before (left, Control) and after 3 min (middle) and 5 min (right) of 10 nm ET-1 application. If was induced from the holding potential of -44.7 mV by hyperpolarising conditioning pulses (-54.7 to -134.7 mV, by -10 mV increments) for 3 s, followed by a depolarising test pulse to +5.3 mV for 2 s to record the tail current, at an interval of 10 s. A, lower panel, superimposed tail currents of If, each corresponding to the upper traces, with expanded time and current scales. Dashed lines indicate the absolute zero current level. B, I–V relation of the tail currents of If, measured at +5.3 mV. ○, control (before application of ET-1); • and ▴, 3 and 5 min, respectively, after application of 10 nm ET-1. Each symbol denotes the mean size of the tail current, obtained from eleven different experiments. The inset illustrates the I–V relation of the normalised tail current, assuming the maximum size of the If tail in each cell and in each treatment to be 100 %. *, ** and ***: significantly different (by paired t test) from control. Upper and lower symbols in two rows indicate 3 and 5 min in ET-1, respectively. Note that ET-1 significantly decreased the size of the If tail at potentials negative to -104.7 mV, whereas it significantly increased the size of the If tail at -84.7 mV.
The normalised current-voltage relation of the If tail was fitted by a curve calculated by a Boltzmann distribution function identical to eqn (1):
| (2) |
where q∞ is the dimensionless activation parameter;Vm is the membrane potential;Vh is the half-activation voltage corresponding to q∞= 0.5 and K (in mV) is the slope factor (Hagiwara & Irisawa, 1989). The results are summarised in Table 1. Whereas ET-1 did not affect Vh significantly, it appears that the steepness of the steady-state activation curve was significantly decreased by ET-1, as noted by the increase in the absolute value of K (Table 1). This change in the steady-state activation of If explains our observation that ET-1 significantly increased the If tail at less hyperpolarised potentials (Fig. 13), despite the strong inhibition of this current observed at more hyperpolarised potentials.
In order to further determine the changes in the kinetics of the activation of If by ET-1, the time course of the activation of If was analysed by fitting the current recording at each membrane potential. While the time course of the activation of the inward current of If has been reported to be better fitted by a sum of two exponentials (Frace et al. 1992; Maruoka et al. 1994; Liu et al. 1996), it can also be fitted reasonably well by a single exponential under our experimental conditions, at least in the voltage range positive to -114.7 mV (Fig. 14A, Hagiwara & Irisawa, 1989), with the following equation,
Figure 14. Effect of ET-1 (10 nm) on the time course of If activation in spindle-shaped rabbit sinoatrial node cells.
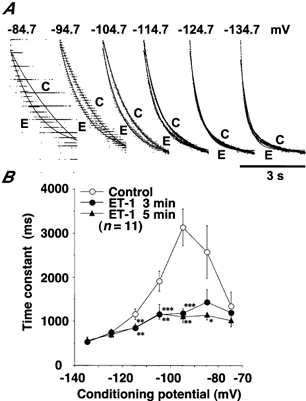
A, single-exponential curve fitting for the activation of If during the hyperpolarising conditioning pulses of 3 s duration in Fig. 13. Typical current traces, recorded between -84.7 and -134.7 mV, are shown by dots. Continuous curves show the results of single-exponential fitting. The current recordings and the fitted curves, obtained at each conditioning potential before (Control, C) and 3 min after 10 nm ET-1 (E), are superimposed with arbitrary vertical scales. The protocol for the voltage clamping is described in Fig. 13. B, the effect of ET-1 (10 nm) on the voltage dependence of the time constant for the activation of If. Each data point represents the mean values obtained from eleven different cells. *, ** and ***: significantly different (paired t test) from control. ET-1 significantly decreased the time constant for If activation between -84.7 and -114.7 mV.
| (3) |
where b is the asymptotic current value at infinite time and a is the size of the net inward If current. The time constant (τ) for the current activation exhibited a bell-shaped voltage dependence (Fig. 14B). ET-1 significantly accelerated the time course of the current activation at membrane potentials between -84.7 and -114.7 mV in a voltage-dependent manner; the acceleration of the current activation by ET-1 was more prominent at less negative membrane potentials than at more hyperpolarised potentials. This finding was consistent with our observation that the activation of If was increased in the presence of ET-1 at such a less negative potential range as that between -74.7 and -84.7 mV (Fig. 13).
DISCUSSION
Relation to previous studies
This report is the first to show electrophysiological evidence that ET-1 by itself exerts a negative chronotropic effect in the whole SAN by directly acting on this area. Our study is also the first to reveal the diversity of responses to ET-1 shown by different cell types. Reduction of the rate of spontaneous APs by ET-1 was first reported in isolated clusters of rabbit SAN cells (Tanaka et al. 1997) and the authors noted that this effect was inconsistent with the well-known positive chronotropic response to ET-1 in other species (Ishikawa et al. 1988b; Ono et al. 1995a). In our present comparative study we found that, under identical experimental conditions, rabbit SAN exhibits a negative chronotropic response to ET-1 at both tissue and single cell levels, whereas guinea-pig SAN exhibits both positive and negative chronotropic responses to ET-1; this agrees with our previous report on guinea-pig right atria (Ono et al. 1995a, 1998). Our data clearly show that the chronotropic effect of ET-1 reflects its direct action on the electrophysiological properties of SAN cells in both rabbit and guinea-pig hearts. Functional diversity between the types of SAN cells points to an important role for the overall physiological regulation of the SAN by ET-1.
We have previously discovered that ET-1 induces a negative chronotropic response in guinea-pig right atrium when the heart rate is elevated by stimulating β-adrenoceptors. This effect of ET-1 is mediated by stimulation of the ETA receptor that activates a pertussis toxin-sensitive Gi protein, resulting in the reduction of ICaL and the increase in IK(ACh) (Ono et al. 1994, 1995a). ETA receptor-mediated negative chronotropism, under the stimulation of the β-adrenoceptor, was confirmed recently in rabbit and canine right atrium (Zhu et al. 1997). Our present study revealed that, in contrast, ET-1 directly caused a negative chronotropic response in rabbit SAN whenever the heart rate was not pre-elevated by β-adrenoceptor activation. Antagonism of this response by the ETA receptor-selective antagonist BQ-123 (1 μm) and the expression of ETA receptor mRNA in rabbit SAN, as revealed by the RT-PCR analysis reported here, indicate that this response is mediated by ETA receptors.
Since ETB and ETA receptors play distinct roles in positive and negative chronotropic responses, respectively, in guinea-pig and rat right atria (Ono et al. 1998), the abundance of ETB receptor mRNA in this tissue may imply an as yet unknown physiological role for this receptor. However, we found in the present study that ET-1 did not exert a positive chronotropic action on the intact SAN in isolated rabbit right atrium, even in the presence of BQ-123. This suggests that the contribution of the ETB receptor to the positive chronotropic response is negligible in this tissue. Since ET receptors desensitise very easily (Cyr et al. 1993; Koshimizu et al. 1995) and, in fact, the positive chronotropic response induced by ET-1 develops intensive tachyphylaxis (Ishikawa et al. 1988b; Ono et al. 1998), desensitisation of the ETB receptor during the cumulative applications of ET-1 might possibly have masked a positive chronotropic component. However, this seems unlikely because, in our microelectrode study, even a single application of ET-1 at a high concentration induced only a profound negative chronotropic response in this preparation. The elucidation of the role of the ETB receptor in rabbit SAN awaits further study.
Heterogeneity of electrophysiological responses in different types of SAN cells
SAN cells are known to be heterogeneous both in their morphological appearances (Taylor et al. 1978; Taniguchi et al. 1981; Denyer & Brown, 1990; Verheijck et al. 1998) and in their electrophysiological properties (Honjo et al. 1996; Muramatsu et al. 1996; Kodama et al. 1997; Nikmaram et al. 1997). This heterogeneity could be important in the understanding of not only the overall electrophysiological properties of the SAN but also of its overall response to various endogenous modulators. The spontaneous cycle length of spindle-shaped cells (about 300 ms, Fig. 6) is in agreement with that reported for ‘spindle’ cells in Verheijck et al. (1998) and is much closer to that of the whole SAN (about 300 ms, Fig. 2) than is that of rod-shaped cells (about 705 ms, Fig. 6). This is consistent with the notion that spindle-shaped cells are more likely to be the leading pacemaker cells than rod-shaped cells. Our finding that rod-shaped cells, although they have clear striations and thus resemble atrial cells, were also spontaneously active contrasts with that of Verheijck et al. (1998) that atrial-type cells in rabbit SAN were quiescent. The presence of this type of spontaneously active cell may play a role in the overall activity of the SAN, as the more negative MDP in rod-shaped cells may electrotonically influence the overall MDP in SAN tissue.
Besides the quantitative differences in electrophysiological parameters, we found that these two types of SAN cells differed qualitatively, as revealed by differences in their responses to ET-1. Although both types of cells exhibited a negative chronotropic response to ET-1 with a reduced PMP slope, they responded differently to ET-1 in their MDP. ET-1 significantly hyperpolarised the MDP in rod-shaped cells at low concentrations whereas it did not in spindle-shaped cells even at a very high concentrations; this was consistent with the absence of activation of the time-independent inward-rectifying current by ET-1 in spindle-shaped cells. The depolarisation of MDP in spindle-shaped cells in the presence of ET-1 is unlikely to be a simple run down of the recording. The following observations support this notion. (1) In our fairly long and stable recording of APs made using the nystatin perforated patch recording, spindle-shaped cells showed a sudden depolarisation of MDP upon application of ET-1 which was reversed after washing out the peptide. (2) Rod-shaped cells invariably showed hyperpolarised MDP in response to ET-1, even under the ruptured patch recording conditions.
Our results contrast with the recent report on small clusters of rabbit SAN cells, in which it was found that ET-1 depolarised MDP at low concentrations but caused MDP to be hyperpolarised at relatively high concentrations, by activating IK(ACh) (Tanaka et al. 1997). The depolarisation and hyperpolarisation of MDP by ET-1 seems, however, to be quite consistent with our data obtained in spindle- and rod-shaped cells, respectively. Furthermore, the configuration of spontaneous APs in terms of, for example, MDP and V̇max seems to vary between clusters that did or did not hyperpolarise in response to ET-1 (Fig. 1 of Tanaka et al. 1997), although the authors did not refer to this fact. Besides, APs in the cell cluster that hyperpolarised in response to ET-1 displayed a distinct notch in the early hyperpolarising phase (Fig. 1B of Tanaka et al. 1997), which is characteristic of peripheral nodal cells (Bleeker et al. 1980; Kodama et al. 1997). Reports of hyperpolarisation of MDP by ET-1 in cell cluster preparations may, therefore, possibly reflect electrical activities in rod-shaped cells in which ET-1 increased a time-independent inward-rectifying current. Our data in spindle-shaped single cells probably represent the apparent overall response of the membrane potential in the rabbit SAN area to ET-1, as we revealed for the first time in the present study using a conventional microelectrode technique. The possible importance of the co-existence of different types of cells within the SAN area for its overall electrophysiological response to ET-1 is further discussed below.
Understanding the effects of ET-1 on the basis of modulation of individual ionic currents
Our voltage-clamp experiments revealed that the strong inhibitory actions of ET-1 on the basal ICaL and IK play important roles in its negative chronotropic effect in rabbit SAN. Phosphorylation of L-type calcium channels by protein kinase A (PKA) increases ICaL in cardiac myocytes (Kameyama et al. 1985; Walsh et al. 1989). Pharmacological agents that increase intracellular cAMP, such as isoprenaline, increase ICaL, causing a positive chronotropic response; those decreasing intracellular cAMP, such as acetylcholine (Hescheler et al. 1986), reduce ICaL even at its basal level, where basal activity of PKA partially stimulates the channel (Irisawa et al. 1993) causing a negative chronotropic response (Brown & Denyer, 1989). IK in cardiac myocytes is known to be stimulated by PKA, which shifts its voltage dependence of activation in the negative direction (Giles et al. 1989), and by protein kinase C (PKC), which does not change the voltage dependence (Tohse et al. 1987; Walsh & Kass, 1988; Walsh et al. 1989). ET-1 reduces intracellular cAMP content through stimulation of the ETA receptor and pertussis toxin-sensitive Gi protein (Hilal-Dandan et al. 1992; James et al. 1994; Ono et al. 1994, 1995a; Vogelsang et al. 1994; Zhu et al. 1997), even when the intracellular cAMP level was not pre-elevated (Ono et al. 1995a). Given the expression of ETA receptors in SAN, as our present RT-PCR study revealed, it is likely that ET-1 inhibits both ICaL and IK through stimulation of the ETA receptor and the consequent reduction in cAMP content in rabbit SAN cells. Measurement of cAMP in single SAN cells by optical methods would help further understanding of the role of cAMP in the effect of ETA receptor stimulation in particular cell types.
ICaL and the effect of ET-1
The importance of ICaL in pacemaking and its hormonal regulation have been extensively documented (Irisawa et al. 1993), owing particularly to its crucial role in contributing to both the first (Verheijck et al. 1999) and the second halves of the PMP (Brown et al. 1984; Hagiwara et al. 1988; Verheijck et al. 1999). ET-1 strongly reduced both the first and the second halves of the PMP (Fig. 1A, and Fig. 5A and B) and inhibited ICaL, without affecting its voltage dependence, both in spindle- and rod-shaped cells (Fig. 9). The recent finding by Tanaka et al. (1997) of inhibition by ET-1 of ICaL in isolated SAN cells is consistent with our present results.
We noted that V̇max in rod-shaped cells increased from about 3 V s−1 in control conditions to 8 V s−1 under the influence of ET-1 (Fig. 6). Meanwhile, ICaL, as measured in the same cells, was reduced to -5.5 ± 0.9 pA pF−1 during exposure to ET-1 from an initial value of -10.0 ± 0.4 pA pF−1 before ET-1 (n = 4, Fig. 9B), which should have caused a decrease in V̇max if ICaL was the sole inward current underlying the AP upstroke. Hyperpolarisation of the membrane potential probably causes recovery of sodium channels from the inactivated state, resulting in the increased contribution of INa to the upstroke of AP. The great increase in V̇max in rod-shaped cells could, therefore, be the consequence of the recruitment of sodium channels secondary to the ET-1-induced hyperpolarisation. In fact, TTX abolished the generation of AP after the hyperpolarisation of the MDP in the presence of ET-1 (Fig. 8). These considerations also suggest that rod-shaped cells, in which ET-1 caused hyperpolarisation of the MDP in the present study, mainly represent the activity that was previously described in the peripheral type of nodal cell (Bleeker et al. 1980; Kodama et al. 1997).
IK changes and the effect of ET-1
IK is known to play a crucial role in the repolarising phase of the AP in SAN. The decay in the conductance of IK contributes to the early phase of the PMP, provided that a satisfactory amount of background inward current exists (DiFrancesco, 1993; Irisawa et al. 1993). Our microelectrode study showed that ET-1 significantly slowed the repolarisation of AP in rabbit SAN tissue despite the strong inhibition of ICaL, an effect that would be consistent with a decrease in IK. Our voltage-clamp experiments clearly showed that ET-1 reduced IK in both spindle- and rod-shaped cells (Fig. 11) in the voltage range -34.7 to -14.7 mV, in agreement with the recent report of Tanaka et al. (1997). Moreover, we observed a significant change in Vh, in the positive direction, caused by ET-1. The resultant decrease in IK in the voltage range around the repolarisation phase could explain both the slowing of the repolarisation of AP and the positive (upward) shift in MDP, as observed both in SAN tissue and in spindle-shaped cells, since the outward IK contributes to set MDP to a potential more negative than the real ‘resting potential’ of the nodal cell (Irisawa et al. 1993). A computer-aided simulation using the Heart software (Oxsoft Ltd, Oxford, UK) confirmed this notion (not shown). It is presently unclear why the APD50 was greatly reduced in single rod-shaped cells while it was significantly increased in the whole SAN tissue.
Recent studies have disclosed that IK comprises two different types of currents, the rapid type IKr and the slow type IKs, the relative distribution of which in SAN varies between species. IKr dominates in rabbit SAN (Ito et al. 1995; Verheijck et al. 1995) whereas IKs is dominant in guinea-pig SAN (Anumonwo et al. 1992). The two currents are distinguished by their voltage dependence of activation and their sensitivity to selective inhibitors; IKr is activated at relatively hyperpolarised potentials and is sensitive to a specific inhibitor of the IKr current, E-4031, whereas IKs is activated at depolarised potentials and is insensitive to E-4031 (Anumonwo et al. 1992; Lei & Brown, 1996). The voltage range in which ET-1 strongly decreased IK in the present study was between -34.7 and -14.7 mV, where IKr is activated preferentially (Lei et al. 1996), whereas the inhibitory effect of ET-1 was relatively weak at more depolarised potentials (Fig. 11). In preliminary experiments (not shown), we noticed that E-4031 (3 μm) almost completely inhibited the activation of IK in rabbit SAN cells, as reported by Ito et al. (1995) and Verheijck et al. (1995). The small size of the remaining outward current did not allow dissection of the effect of ET-1 on IKs. This suggests that IKs contributes little if anything to the overall IK in rabbit SAN cells. Therefore, it is probable that ET-1 preferentially inhibits IKr in rabbit SAN cells, although the possible involvement of IKs, as another target of ET-1, cannot totally be excluded.
If changes and the effect of ET-1
If is increased in amplitude by a local elevation of intracellular calcium concentration, with a shift in its steady-state activation-voltage relation to more positive potentials and without a change in its slope factor (Hagiwara & Irisawa, 1989). Reduction of cAMP shifts the voltage dependence of the activation of If to more negative voltages (DiFrancesco & Tromba, 1988) and decreases the slope of the current-voltage relation of If (Hagiwara & Irisawa, 1989). Stimulation of either ETA or ETB receptors releases intracellularly stored calcium through a pertussis toxin-insensitive Gq protein (Hilal-Dandan et al. 1992; Vogelsang et al. 1994), whereas ETA receptor stimulation reduces intracellular cAMP (Ono et al. 1994, 1995a; Vogelsang et al. 1994). Our present finding that ET-1 decreased the slope of the I–V relation without changing Vh might be explained by these opposing actions of ET-1 on the voltage dependence of If activation. As a possible consequence, the increase in the activation of If in the potential range around the PMP, as we observed in the present study, would not contribute to the negative chronotropic effect of ET-1.
Why did single cells stop pacing in the presence of ET-1 whereas the whole tissue did not?
ET-1 activated a time-independent inward-rectifying current only in rod-shaped cells, which exclusively led to a strong hyperpolarisation, as we previously reported in atrial myocytes (Ono et al. 1994, 1995b). This resulted, together with the strong inhibition of ICaL, in the cessation of pacemaking in this type of cell. Spindle-shaped cells also stopped pacing in the presence of ET-1, with accompanying depolarisation of MDP. In contrast, ET-1 neither completely stopped the pacing nor hyperpolarised MDP in the whole SAN area of the rabbit. The SAN is known to be made up of heterogeneous types of cells (Bleeker et al. 1980; Verheijck, et al. 1998) of which the atrial type contributes more than 40 % even in the central pacemaking area (Verheijck et al. 1998). The hyperpolarising action of ET-1 on rod-shaped cells may influence the adjacent spindle-shaped cells through direct electrotonic coupling to activate their If, which would in turn contribute to depolarise the membrane to counteract the ET-1-induced hyperpolarisation in rod-shaped cells (Irisawa et al. 1993). This may be a very efficient mechanism to protect the SAN from arrest (Hagiwara & Irisawa, 1989). In this context, a slight but significant increase in activation of If by ET-1 in spindle-shaped cells at membrane potentials ranging from -74.7 to -84.7 mV might also be quite effective in counteracting hyperpolarisation by ET-1 of both rod-shaped SAN cells and the surrounding atrial myocytes. The coexistence and mutual interactions of such heterogeneous populations of cells within the SAN area might thus contribute to maintaining pacing under the influence of negative chronotropic agents. The potential contribution of the increase in the activation of If, caused by ET-1 at membrane potentials between -74.7 and -84.7 mV, to a positive chronotropic response would also be of interest. This needs further analysis, particularly in relation to the activation of ETB endothelin receptors, since we found that ETB receptors play a major role in the positive chronotropic effect of ET-1 (Ono et al. 1998).
Acknowledgments
The authors thank Professor D. Noble for reading the manuscript. K.O. thanks M. Satake for continuous encouragement. This work was supported in part by the Japan Human Science Foundation and by the Grants-in-Aid for Scientific Research from the Ministry of Education, Science, Sports and Culture of Japan.
References
- Agata N, Tanaka H, Shigenobu K. Developmental changes in action potential properties of the guinea-pig myocardium. Acta Physiologica Scandinavica. 1993;149:331–337. doi: 10.1111/j.1748-1716.1993.tb09628.x. [DOI] [PubMed] [Google Scholar]
- Anumonwo JMB, Freeman LC, Kwok WM, Kass RS. Delayed rectification in single cells isolated from guinea pig sinoatrial node. American Journal of Physiology. 1992;262:H921–925. doi: 10.1152/ajpheart.1992.262.3.H921. [DOI] [PubMed] [Google Scholar]
- Arai H, Hori S, Aramori I, Ohkubo H, Nakanishi S. Cloning and expression of a cDNA encoding an endothelin receptor. Nature. 1990;348:730–732. doi: 10.1038/348730a0. [DOI] [PubMed] [Google Scholar]
- Bleeker WK, Mackaay AJ, Masson-Pévet M, Bouman LN, Becker AE. Functional and morphological organization of the rabbit sinus node. Circulation Research. 1980;46:11–22. doi: 10.1161/01.res.46.1.11. [DOI] [PubMed] [Google Scholar]
- Brown HF, Denyer JC. Low-dose acetylcholine reduces calcium current in isolated sino-atrial node cells of rabbit. Journal of Physiology. 1989;410:65. P. [Google Scholar]
- Brown HF, Kimura J, Noble D, Noble SJ, Taupignon A. The slow inward current, isi, in the rabbit sino-atrial node investigated by voltage clamp and computer simulation. Proceedings of the Royal Society. 1984;222:305–328. doi: 10.1098/rspb.1984.0066. B. [DOI] [PubMed] [Google Scholar]
- Cyr CR, Rudy B, Kris RM. Prolonged desensitization of the human endothelin A receptor in Xenopus oocytes. Comparative studies with the human neurokinin A receptor. Journal of Biological Chemistry. 1993;268:26071–26074. [PubMed] [Google Scholar]
- Denyer JC, Brown HF. Rabbit sino-atrial node cells: isolation and electrophysiological properties. Journal of Physiology. 1990;428:405–424. doi: 10.1113/jphysiol.1990.sp018219. [DOI] [PMC free article] [PubMed] [Google Scholar]
- DiFrancesco D. Characterization of single pacemaker channels in cardiac sino-atrial cells. Nature. 1986;324:470–473. doi: 10.1038/324470a0. [DOI] [PubMed] [Google Scholar]
- DiFrancesco D. Pacemaker mechanisms in cardiac tissue. Annual Review of Physiology. 1993;55:455–472. doi: 10.1146/annurev.ph.55.030193.002323. [DOI] [PubMed] [Google Scholar]
- DiFrancesco D, Ferroni A, Mazzanti M, Tromba C. Properties of the hyperpolarization-activated current (if) in cells isolated from the rabbit sino-atrial node. Journal of Physiology. 1986;377:61–88. doi: 10.1113/jphysiol.1986.sp016177. [DOI] [PMC free article] [PubMed] [Google Scholar]
- DiFrancesco D, Mangoni M. Modulation of single hyperpolarization-activated channels (if) by cAMP in the rabbit sino-atrial node. Journal of Physiology. 1994;474:473–482. doi: 10.1113/jphysiol.1994.sp020038. [DOI] [PMC free article] [PubMed] [Google Scholar]
- DiFrancesco D, Tortora P. Direct activation of cardiac pacemaker channels by intracellular cyclic AMP. Nature. 1991;351:145–147. doi: 10.1038/351145a0. [DOI] [PubMed] [Google Scholar]
- DiFrancesco D, Tromba C. Inhibition of the hyperpolarization-activated current (if) induced by acetylcholine in rabbit sino-atrial node myocytes. Journal of Physiology. 1988;405:477–491. doi: 10.1113/jphysiol.1988.sp017343. [DOI] [PMC free article] [PubMed] [Google Scholar]
- Frace AM, Maruoka F, Noma A. Control of the hyperpolarization-activated cation current by external anions in rabbit sino-atrial node cells. Journal of Physiology. 1992;453:307–318. doi: 10.1113/jphysiol.1992.sp019230. [DOI] [PMC free article] [PubMed] [Google Scholar]
- Furukawa T, Ito H, Nitta J, Tsujino M, Adachi S, Hiroe M, Marumo F, Sawanobori T, Hiraoka M. Endothelin-1 enhances calcium entry through T-type calcium channels in cultured neonatal rat ventricular myocytes. Circulation Research. 1992;71:1242–1253. doi: 10.1161/01.res.71.5.1242. [DOI] [PubMed] [Google Scholar]
- Giles W, Nakajima T, Ono K, Shibata EF. Modulation of the delayed rectifier K+ current by isoprenaline in bull-frog atrial myocytes. Journal of Physiology. 1989;415:233–249. doi: 10.1113/jphysiol.1989.sp017720. [DOI] [PMC free article] [PubMed] [Google Scholar]
- Goto K, Hama H, Kasuya Y. Molecular pharmacology and pathophysiological significance of endothelin. Japanese Journal of Pharmacology. 1996;72:261–290. doi: 10.1254/jjp.72.261. [DOI] [PubMed] [Google Scholar]
- Guo J, Ono K, Noma A. A sustained inward current activated at the diastolic potential range in rabbit sino-atrial node cells. Journal of Physiology. 1995;483:1–13. doi: 10.1113/jphysiol.1995.sp020563. [DOI] [PMC free article] [PubMed] [Google Scholar]
- Hagiwara N, Irisawa H. Modulation by intracellular Ca2+ of the hyperpolarization-activated inward current in rabbit single sino-atrial node cells. Journal of Physiology. 1989;409:121–141. doi: 10.1113/jphysiol.1989.sp017488. [DOI] [PMC free article] [PubMed] [Google Scholar]
- Hagiwara N, Irisawa H, Kameyama M. Contribution of two types of calcium currents to the pacemaker potentials of rabbit sino-atrial node cells. Journal of Physiology. 1988;395:233–253. doi: 10.1113/jphysiol.1988.sp016916. [DOI] [PMC free article] [PubMed] [Google Scholar]
- Hagiwara N, Irisawa H, Kasanuki H, Hosoda S. Background current in sino-atrial node cells of the rabbit heart. Journal of Physiology. 1992;448:53–72. doi: 10.1113/jphysiol.1992.sp019029. [DOI] [PMC free article] [PubMed] [Google Scholar]
- Hescheler J, Kameyama M, Trautwein W. On the mechanism of muscarinic inhibition of the cardiac Ca current. Pflügers Archiv. 1986;407:182–189. doi: 10.1007/BF00580674. [DOI] [PubMed] [Google Scholar]
- Hilal-Dandan R, Urasawa K, Brunton LL. Endothelin inhibits adenylate cyclase and stimulates phosphoinositide hydrolysis in adult cardiac myocytes. Journal of Biological Chemistry. 1992;267:10620–10624. [PubMed] [Google Scholar]
- Honjo H, Boyett MR, Kodama I, Toyama J. Correlation between electrical activity and the size of rabbit sino-atrial node cells. Journal of Physiology. 1996;496:795–808. doi: 10.1113/jphysiol.1996.sp021728. [DOI] [PMC free article] [PubMed] [Google Scholar]
- Hosoda K, Nakao K, Arai H, Suga S, Ogawa Y, Mukoyama M, Shirakami G, Saito Y, Nakanishi S, Imura H. Cloning and expression of human endothelin-1 receptor cDNA. FEBS Letters. 1991;287:23–26. doi: 10.1016/0014-5793(91)80007-p. [DOI] [PubMed] [Google Scholar]
- Inoue A, Yanagisawa M, Kimura S, Kasuya Y, Miyauchi T, Goto K, Masaki T. The human endothelin family: Three structurally and pharmacologically distinct isopeptides predicted by three separate genes. Proceedings of the National Academy of Sciences of the USA. 1989;86:2863–2867. doi: 10.1073/pnas.86.8.2863. [DOI] [PMC free article] [PubMed] [Google Scholar]
- Irisawa H, Brown HF, Giles W. Cardiac pacemaking in the sinoatrial node. Physiological Reviews. 1993;73:197–227. doi: 10.1152/physrev.1993.73.1.197. [DOI] [PubMed] [Google Scholar]
- Ishikawa T, Yanagisawa M, Kimura S, Goto K, Masaki T. Positive inotropic action of novel vasoconstrictor peptide endothelin on guinea pig atria. American Journal of Physiology. 1988a;255:H970–973. doi: 10.1152/ajpheart.1988.255.4.H970. [DOI] [PubMed] [Google Scholar]
- Ishikawa T, Yanagisawa M, Kimura S, Goto K, Masaki T. Positive chronotropic effects of endothelin, a novel endothelium-derived vasoconstrictor peptide. Pflügers Archiv. 1988b;413:108–110. doi: 10.1007/BF00581239. [DOI] [PubMed] [Google Scholar]
- Ito H, Ono K. A rapidly activating delayed rectifier K+ channel in rabbit sinoatrial node cells. American Journal of Physiology. 1995;269:H443–452. doi: 10.1152/ajpheart.1995.269.2.H443. [DOI] [PubMed] [Google Scholar]
- James AF, Xie L-H, Fujitani Y, Hayashi S, Horie M. Inhibition of the cardiac protein kinase A-dependent chloride conductance by endothelin-1. Nature. 1994;370:297–300. doi: 10.1038/370297a0. [DOI] [PubMed] [Google Scholar]
- Kameyama M, Hofmann F, Trautwein W. On the mechanism of β-adrenergic regulation of the Ca channel in the guinea-pig heart. Pflügers Archiv. 1985;405:285–293. doi: 10.1007/BF00582573. [DOI] [PubMed] [Google Scholar]
- Kodama I, Nikmaram MR, Boyett MR, Suzuki R, Honjo H, Owen JM. Regional difference in the role of the Ca2+ and Na+ currents in pacemaker activity in the sinoatrial node. American Journal of Physiology. 1997;272:H2793–2806. doi: 10.1152/ajpheart.1997.272.6.H2793. [DOI] [PubMed] [Google Scholar]
- Koshimizu T, Tsujimoto G, Ono K, Masaki T, Sakamoto A. Truncation of the receptor carboxyl terminus impairs membrane signaling but not ligand binding of human ETB endothelin receptors. Biochemical and Biophysical Research Communications. 1995;217:354–362. doi: 10.1006/bbrc.1995.2784. [DOI] [PubMed] [Google Scholar]
- Lauer MR, Gunn MD, Clusin WT. Endothelin activates voltage-dependent Ca2+ current by a G protein-dependent mechanism in rabbit cardiac myocytes. Journal of Physiology. 1992;448:729–747. doi: 10.1113/jphysiol.1992.sp019067. [DOI] [PMC free article] [PubMed] [Google Scholar]
- Lei M, Brown HF. Two components of the delayed rectifier potassium current, IK, in rabbit sino-atrial node cells. Experimental Physiology. 1996;81:725–741. doi: 10.1113/expphysiol.1996.sp003972. [DOI] [PubMed] [Google Scholar]
- Lin HY, Kaji EH, Winkel GK, Ives HE, Lodish HF. Cloning and functional expression of a vascular smooth muscle endothelin-1 receptor. Proceedings of the National Academy of Sciences of the USA. 1991;88:3185–3189. doi: 10.1073/pnas.88.8.3185. [DOI] [PMC free article] [PubMed] [Google Scholar]
- Liu ZW, Zou AR, Demir SS, Clark JW, Nathan RD. Characterization of a hyperpolarization-activated inward current in cultured pacemaker cells from the sinoatrial node. Journal of Molecular and Cellular Cardiology. 1996;28:2523–2535. doi: 10.1006/jmcc.1996.0244. [DOI] [PubMed] [Google Scholar]
- Maruoka F, Nakashima Y, Takano M, Ono K, Noma A. Cation-dependent gating of the hyperpolarization-activated cation current in the rabbit sino-atrial node cells. Journal of Physiology. 1994;477:423–435. doi: 10.1113/jphysiol.1994.sp020204. [DOI] [PMC free article] [PubMed] [Google Scholar]
- Masaki T, Yanagisawa M, Goto K. Physiology and pharmacology of endothelins. Medicinal Research Reviews. 1992;12:391–421. doi: 10.1002/med.2610120405. [DOI] [PubMed] [Google Scholar]
- Muramatsu H, Zou A-R, Berkowitz GA, Nathan RD. Characterization of a TTX-sensitive Na+ current in pacemaker cells isolated from rabbit sinoatrial node. American Journal of Physiology. 1996;270:H2108–2119. doi: 10.1152/ajpheart.1996.270.6.H2108. [DOI] [PubMed] [Google Scholar]
- Nikmaram MR, Boyett MR, Kodama I, Suzuki R, Honjo H. Variation in effects of Cs+, UL-FS-49, and ZD-7288 within sinoatrial node. American Journal of Physiology. 1997;272:H2782–2792. doi: 10.1152/ajpheart.1997.272.6.H2782. [DOI] [PubMed] [Google Scholar]
- Ono K, Delay M, Nakajima T, Irisawa H, Giles W. Calcitonin gene-related peptide regulates calcium current in heart muscle. Nature. 1989;340:721–724. doi: 10.1038/340721a0. [DOI] [PubMed] [Google Scholar]
- Ono K, Eto K, Sakamoto A, Masaki T, Shibata K, Sada T, Hashimoto K, Tsujimoto G. Negative chronotropic effect of endothelin-1 mediated through ETA receptors in guinea pig atria. Circulation Research. 1995a;76:284–292. doi: 10.1161/01.res.76.2.284. [DOI] [PubMed] [Google Scholar]
- Ono K, Eto K, Sakamoto A, Masaki T, Tsujimoto G, Satake M. ETA receptor-mediated modulation of calcium and potassium currents in guinea-pig and rabbit atrial myocytes. Heart and Vessels. 1995b;9(suppl.):102–105. [Google Scholar]
- Ono K, Giles WR. Electrophysiological effects of calcitonin gene-related peptide in bull-frog and guinea-pig atrial myocytes. Journal of Physiology. 1991;436:195–217. doi: 10.1113/jphysiol.1991.sp018546. [DOI] [PMC free article] [PubMed] [Google Scholar]
- Ono K, Sakamoto A, Masaki T, Satake M. Desensitization of ETA endothelin receptor-mediated negative chronotropic response in right atria – species difference and intracellular mechanisms. British Journal of Pharmacology. 1998;125:787–797. doi: 10.1038/sj.bjp.0702125. [DOI] [PMC free article] [PubMed] [Google Scholar]
- Ono K, Tanaka H, Masumiya H, Shijuku T, Sakamoto A, Masaki T, Shigenobu K, Satake M. Electro-physiological effects of endothelins on isolated sinoatrial node cells of rabbit and guinea pig. Japanese Journal of Pharmacology. 1997;73(suppl. I):191P. [Google Scholar]
- Ono K, Tsujimoto G, Sakamoto A, Eto K, Masaki T, Ozaki Y, Satake M. Endothelin-A receptor mediates cardiac inhibition by regulating calcium and potassium currents. Nature. 1994;370:301–304. doi: 10.1038/370301a0. [DOI] [PubMed] [Google Scholar]
- Opthof T, de Jonge B, Mackaay AJC, Bleeker WK, Masson-Pevet M, Jongsma HJ, Bouman LN. Functional and morphological organization of the guinea-pig sinoatrial node compared with the rabbit sinoatrial node. Journal of Molecular and Cellular Cardiology. 1985;17:549–564. doi: 10.1016/s0022-2828(85)80024-9. [DOI] [PubMed] [Google Scholar]
- Sakamoto A, Yanagisawa M, Sakurai T, Takuwa Y, Yanagisawa H, Masaki T. Cloning and functional expression of human cDNA for the ETB endothelin receptor. Biochemical and Biophysical Research Communications. 1991;178:656–663. doi: 10.1016/0006-291x(91)90158-4. [DOI] [PubMed] [Google Scholar]
- Sakmann B, Noma A, Trautwein W. Acetylcholine activation of single muscarinic K+ channels in isolated pacemaker cells of the mammalian heart. Nature. 1983;303:250–253. doi: 10.1038/303250a0. [DOI] [PubMed] [Google Scholar]
- Sakurai T, Yanagisawa M, Takuwa Y, Miyazaki H, Kimura S, Goto K, Masaki T. Cloning of a cDNA encoding a non-isopeptide-selective subtype of the endothelin receptor. Nature. 1990;348:732–735. doi: 10.1038/348732a0. [DOI] [PubMed] [Google Scholar]
- Shinagawa Y, Satoh H, Noma A. The sustained inward current and inward rectifier K+ current in pacemaker cells dissociated from rat sinoatrial node. Journal of Physiology. 2000;523:593–605. doi: 10.1111/j.1469-7793.2000.t01-2-00593.x. [DOI] [PMC free article] [PubMed] [Google Scholar]
- Tanaka H, Habuchi Y, Yamamoto T, Nishio M, Morikawa J, Yoshimura M. Negative chronotropic actions of endothelin-1 on rabbit sinoatrial node pacemaker cells. British Journal of Pharmacology. 1997;122:321–329. doi: 10.1038/sj.bjp.0701370. [DOI] [PMC free article] [PubMed] [Google Scholar]
- Taniguchi J, Kokubun S, Noma A, Irisawa H. Spontaneously active cells isolated from the sino-atrial and atrio-ventricular nodes of the rabbit heart. Japanese Journal of Physiology. 1981;31:547–558. doi: 10.2170/jjphysiol.31.547. [DOI] [PubMed] [Google Scholar]
- Taylor, J J, D'Agrosa LS, Burns EM. The pacemaker cell of the sinoatrial node of the rabbit. American Journal of Physiology. 1978;235:H407–412. doi: 10.1152/ajpheart.1978.235.4.H407. [DOI] [PubMed] [Google Scholar]
- Tohse N, Hattori Y, Nakaya H, Endou M, Kanno M. Inability of endothelin to increase Ca2+ current in guinea-pig heart cells. British Journal of Pharmacology. 1990;99:437–438. doi: 10.1111/j.1476-5381.1990.tb12944.x. [DOI] [PMC free article] [PubMed] [Google Scholar]
- Tohse N, Kameyama M, Irisawa H. Intracellular Ca2+ and protein kinase C modulate K+ current in guinea pig heart cells. American Journal of Physiology. 1987;253:H1321–1324. doi: 10.1152/ajpheart.1987.253.5.H1321. [DOI] [PubMed] [Google Scholar]
- Verheijck EE, van Ginneken ACG, Bourier J, Bouman LN. Effects of delayed rectifier current blockade by E-4031 on impulse generation in single sinoatrial nodal myocytes of the rabbit. Circulation Research. 1995;76:607–615. doi: 10.1161/01.res.76.4.607. [DOI] [PubMed] [Google Scholar]
- Verheijck EE, van Ginneken ACG, Wilders R, Bouman LN. Contribution of L-type Ca2+ current to electrical activity in sinoatrial nodal myocytes of rabbits. American Journal of Physiology. 1999;276:H1064–1077. doi: 10.1152/ajpheart.1999.276.3.H1064. [DOI] [PubMed] [Google Scholar]
- Verheijck EE, Wessels A, van Ginneken ACG, Bourier J, Markman MWM, Vermeulen JLM, de Bakker JMT, Lamers WH, Opthof T, Bouman LN. Distribution of atrial and nodal cells within the rabbit sinoatrial node. Models of sinoatrial transition. Circulation. 1998;97:1623–1631. doi: 10.1161/01.cir.97.16.1623. [DOI] [PubMed] [Google Scholar]
- Vogelsang M, Broede-Sitz A, Schäfer E, Zerkowski H-R, Brodde O-E. Endothelin ETA-receptors couple to inositol phosphate formation and inhibition of adenylate cyclase in human right atrium. Journal of Cardiovascular Pharmacology. 1994;23:344–347. [PubMed] [Google Scholar]
- Walsh KB, Begenisich TB, Kass RS. β-Adrenergic modulation of cardiac ion channels. Differential temperature sensitivity of potassium and calcium currents. Journal of General Physiology. 1989;93:841–854. doi: 10.1085/jgp.93.5.841. [DOI] [PMC free article] [PubMed] [Google Scholar]
- Walsh KB, Kass RS. Regulation of a heart potassium channel by protein kinase A and C. Science. 1988;242:67–69. doi: 10.1126/science.2845575. [DOI] [PubMed] [Google Scholar]
- Yanagisawa M, Kurihara H, Kimura S, Tomobe Y, Kobayashi M, Mitsui Y, Yazaki Y, Goto K, Masaki T. A novel potent vasoconstrictor peptide produced by vascular endothelial cells. Nature. 1988;332:411–415. doi: 10.1038/332411a0. [DOI] [PubMed] [Google Scholar]
- Yawo H, Chuhma N. An improved method for perforated patch recordings using nystatin-fluorescein mixture. Japanese Journal of Physiology. 1993;43:267–273. doi: 10.2170/jjphysiol.43.267. [DOI] [PubMed] [Google Scholar]
- Zhu Y, Yang H-T, Endoh M. Negative chronotropic and inotropic effects of endothelin isopeptides in mammalian cardiac muscle. American Journal of Physiology. 1997;273:H119–127. doi: 10.1152/ajpheart.1997.273.1.H119. [DOI] [PubMed] [Google Scholar]