

Abstract
Repetitive electrical peripheral nerve or muscle stimulation can induce a lasting increase in the excitability of the corticomotor projection. By pairing peripheral stimulation with transcranial magnetic brain stimulation it is possible to shorten the duration of stimulation needed to induce this effect. This ability to induce excitability changes in the motor cortex may be of significance for the rehabilitation of brain-injured patients. The mechanisms responsible for the increases in excitability have not been investigated thoroughly.
Using two paired transcranial magnetic stimuli protocols we investigated the excitability of intracortical inhibitory and excitatory systems before and following a period of repetitive dual muscle and brain stimulation. The dual stimulation consisted of motor point stimulation of first dorsal interosseous (FDI; 10 Hz trains of 1 ms square waves for 500 ms) delivered at one train every 10 s, paired with single transcranial magnetic stimulation given 25 ms after the onset of the train.
Following 30 min of dual stimulation, motor-evoked potentials (MEPs) were significantly increased in amplitude. During this period of MEP facilitation there was no significant difference in the level of intracortical inhibition. There was, however, a significant increase in the intracortical facilitation demonstrated with paired magnetic stimuli. The increase in facilitation was seen only at short interstimulus intervals (0.8-2.0 ms). These intervals comprised a peak in the time course of facilitation, which is thought to reflect I wave interaction within the motor cortex.
The relevance of this finding to the MEP facilitation seen following dual peripheral and central stimulation is discussed.
Changes in afferent input are capable of inducing organisational change within the motor and sensory cortex. It has been known for some time that temporary deafferentation of a limb results in a rapid increase in the excitability of the cortical projection to muscles proximal to the block, as evidenced by larger motor-evoked potentials (MEPs) following transcranial magnetic stimulation (TCMS) (Brasil-Neto et al. 1992; Ridding & Rothwell, 1995). The exact mechanisms responsible for the increase in MEP size are not fully understood but evidence exists to implicate the rapid removal of GABA-related cortical inhibition and short-term changes in synaptic efficacy dependent on Na+ or Ca2+ channels (Ziemann et al. 1998b). Repetitive TCMS used in conjunction with ischaemic block enhances the increase in MEP size. It is suggested that as NMDA receptors are involved, long-term potentiation-like mechanisms are responsible (Ziemann et al. 1998b).
Changing afferent input by peripheral stimulation can also influence motor cortical organisation. The excitability of the cortical projection to hand muscles innervated by the stimulated nerve can be increased (Ridding et al. 2000). By combining peripheral nerve stimulation with TCMS it is possible to shorten the time required to induce robust excitability increases (Stefan et al. 2000). Little is known about the mechanisms responsible for the increases in excitability seen following peripheral, or dual peripheral and central, stimulation. However, given the nature of the changes induced with these different protocols it would seem plausible that similar mechanisms may be responsible. From the time course of effects, parallels have been drawn with the changes associated with long-term potentiation reported in the animal literature (Stefan et al. 2000). Whether the mechanisms responsible for the changes seen following peripheral stimulation are similar to those responsible for changes induced in muscles proximal to ischaemic block is unknown.
Using paired TCMS it is possible to test the excitability of intracortical inhibitory and excitatory elements. Kujirai and colleagues (Kujirai et al. 1993) developed a technique, employing a subthreshold conditioning stimulus and a suprathreshold test stimulus, to investigate intracortical inhibitory actions. It is likely that the inhibition seen with this technique is due to local GABAergic neurones within the motor cortex (Kujirai et al. 1993). A decrease in intracortical inhibition has been reported to accompany MEP facilitation following ischaemic block with accompanying TCMS (Ziemann et al. 1998b). Using a similar protocol it is also possible to test the excitability of facilitatory elements within the motor cortex. Tokimura and colleagues (Tokimura et al. 1996) demonstrated that when using two threshold magnetic stimuli, with an interval between the stimuli of around 1.0-1.5, 2.5-3.0 or 4.5 ms or longer, the size of the response to the pair of stimuli was much greater than the algebraic sum of the response to each stimulus alone. The authors suggested that these periods of facilitation probably reflected interactions between circuits normally responsible for the production of I waves. A modification of this technique has also been employed to investigate facilitatory effects within the motor cortex. Using a suprathreshold first stimulus (S1) and a subthreshold second stimulus (S2), at a number of interstimulus intervals (ISIs) the response to S1 and S2 is larger than the response to S1 alone. These facilitatory effects occur at ISIs of approximately 1.1-1.5, 2.3-2.9 and 4.1-4.5 ms. It is thought that at least the first of these facilitations represents facilitatory I wave interaction in the motor cortex (Ziemann et al. 1998c). In the present study we employed these double pulse magnetic stimulation techniques to investigate changes in intracortical excitation/inhibition following a period of dual peripheral and central stimulation.
METHODS
A total of 16 healthy normal subjects participated in the experiments. Written informed consent was obtained from all subjects, and procedures were approved by the University of Adelaide Human Ethics Committee and conformed with the Declaration of Helsinki. Of the 16 subjects, 12 (mean age = 29.8 ± 5.9 years, range 23-41 years; 6 males, 6 females) demonstrated significant MEP facilitation following the dual stimulation period. Subjects not demonstrating significant facilitation of MEPs were excluded from further testing.
Electromyography
Subjects were seated in a comfortable chair for all recordings. Surface EMG was recorded, using Ag-AgCl disposable electrodes, from the right first dorsal interosseous (FDI), and right flexor carpi ulnaris (FCU). For FDI, the active electrode was placed over the muscle belly and the inactive electrode positioned over the second metacarpophalangeal joint. For FCU, the active electrode was placed over the muscle belly and the inactive electrode approximately 3 cm distal to this. The signal was amplified (typically ×1000) and filtered with high- and low-pass filtering at 20 Hz and 1 kHz, respectively. EMG signals were digitised at 5 kHz with a laboratory interface (CED 1401, Cambridge, UK) and fed to a personal computer. MEP waveforms were analysed off-line with custom-made software.
Transcranial magnetic stimulation
Transcranial magnetic stimuli were applied using a Magstim 200 stimulator (The Magstim Co., Dyfed, UK) and a figure-of-eight focal coil (external diameter of wings, 9 cm). All magnetic stimuli, in all protocols, were delivered through a Bistim module (The Magstim Co.), which results in a reduction in stimulus intensity of about one-third over that displayed on the individual magnetic stimulators. The coil was held at approximately 45 deg to the mid-line with the handle pointing posteriorly. With this coil orientation the induced current in the brain would flow in a posterior to anterior direction and approximately perpendicular to the central sulcus. This orientation is optimal for activating the hand region of the motor cortex. The optimal scalp site for evoking responses in FDI was established and then resting motor threshold was determined. Motor threshold was defined as the minimal stimulus intensity at which 5 out of 10 consecutive stimuli evoked an MEP with an amplitude of at least 50 μV in the relaxed FDI muscle at the optimal scalp site. Active motor threshold was also determined while subjects maintained a voluntary isometric contraction of 100 g force. Active motor threshold was defined as the minimal stimulus intensity that evoked a mean MEP amplitude of 100 μV in 10 successive trials. The approach used to determine threshold intensities (both active and rest) was to apply stimuli at a clearly suprathreshold level and then adjust the stimulator output downwards in 1 % (of stimulator output) steps until clearly below threshold. This process was repeated several times until a reproducible threshold value was obtained.
Paired magnetic stimuli (intracortical inhibition and facilitation experiments) were delivered by connecting two Magstim 200 stimulators to a Bistim module. This allows pairs of stimuli to be delivered through the same stimulating coil.
Dual stimulation protocol
To induce plastic changes in the motor cortex, electrical stimulation of the motor point of FDI was paired with TCMS over the contralateral, lowest threshold FDI scalp site throughout a 30 min period. This technique is a modified version of the technique reported by Stefan et al. (2000), who used median nerve stimulation paired with TCMS. Here we employed FDI motor point stimulation in an attempt to focus induced changes to the target muscle (FDI). The motor point stimulation consisted of a 10 Hz train of 1 ms square waves for 500 ms. The intensity was adjusted to be slightly above motor threshold and resulted in a just visible contraction in FDI. This stimulation intensity was not considered painful by any of the subjects. A magnetic stimulus was given 25 ms after the onset of the train to coincide with the arrival of the afferent volley at the cortex (Stefan et al. 2000). Magnetic stimuli were delivered with the figure-of-eight coil over the lowest threshold FDI site at an intensity just above motor threshold, which resulted in a just visible twitch in FDI. The combined motor point and magnetic cortical stimulation is referred to as ‘dual’ stimulation. Dual stimulation was repeated every 10 s for one period of 30 min in each subject. Subjects were instructed to ‘pay attention’ to the stimulus and were reminded of this at regular intervals throughout the period of stimulation.
The following measurements were made prior to, and then following, the period of dual peripheral and central stimulation.
MEP amplitudes
To assess the effect of the dual stimulation intervention, sets of 15 MEPs were recorded prior to and at various times following the dual stimulation period. TCMS was applied at the optimal scalp site for evoking responses in the right FDI muscle. The interval between successive stimuli was approximately 4.5 s and the intensity of the magnetic stimulation was adjusted to evoke an MEP of 0.5-1 mV in the relaxed FDI prior to the dual stimulation. This stimulus intensity was then used at various times throughout the experiment to evoke MEPs, which were compared to those recorded prior to dual stimulation. Measurements were made on the peak-to-peak amplitudes of the MEPs.
Intracortical inhibition
Six subjects participated in this series of experiments. Intracortical inhibition was recorded using a slightly modified version of the methods described previously (Kujirai et al. 1993). Briefly, paired transcranial magnetic stimuli were applied over the optimal scalp site for evoking responses in the right FDI muscle. The first stimulus (conditioning) was set at an intensity 5 % below active motor threshold (Ziemann et al. 1996b). The intensity of the second (test) stimulus was then adjusted until it evoked an MEP of 0.5-1 mV in the relaxed FDI muscle. A range of ISIs were investigated (2, 3, 5, 6, 10 and 15 ms). Each data block consisted of four conditions; three different ISI conditions and a test condition. Each block of data consisted of 48 trials (12 per condition) and the order of presentation of the conditions was pseudo-random. This order of presentation was designed so that long series of the same condition were not presented to the subjects. For analysis, the amplitude of the response evoked during each of the different ISI conditions was expressed as a percentage of that seen with the test stimulus alone. The intensity of the test stimulus was adjusted following the dual stimulation period to ensure that the test MEPs were matched in amplitude to the test MEPs recorded prior to the dual stimulation period.
Intracortical facilitation
Six subjects participated in the intracortical facilitation studies. Intracortical facilitation was recorded using techniques as previously described (Ziemann et al. 1998c). Briefly, paired magnetic stimuli were applied at the optimal scalp site for eliciting responses in FDI. The intensity of the first stimulus (S1) was adjusted to evoke an MEP of approximately 0.5 mV in the relaxed FDI muscle. The intensity of the second stimulus (S2) was set at 10 % (of threshold) below resting motor threshold. The following ISIs were investigated: 0.8, 1.2, 1.7, 2.0, 2.3, 2.7, 3.0, 3.3, 3.6, 4.1, 4.5 and 5.2 ms. Again, data blocks consisted of four conditions; three different ISI conditions and a condition in which S1 was given alone. Each block of data consisted of 40 trials (10 per condition) and the order of presentation of the conditions was pseudo-random. For analysis, the amplitude of the response evoked at each of the different ISI conditions was expressed as a percentage of that seen with the S1 stimulus alone. The intensity of the S1 stimulus was adjusted following the dual stimulation period to ensure that the amplitude of the MEP was matched to that evoked by S1 prior to the dual stimulation period.
Recruitment curves
Recruitment curves were recorded in eight subjects in the relaxed condition and six subjects in the active condition. Stimuli were applied at the optimal scalp site for evoking responses in FDI. In the relaxed condition five stimuli were applied at an intensity between 5 and 10 % below resting threshold. The stimulus intensity was then increased by 5 % and another five stimuli applied. This process was repeated until the amplitude of the MEPs increased no further or maximal stimulator output was reached. In the active condition subjects maintained a 100 g isometric contraction and the process described for the relaxed condition was repeated except this time the initial stimulus intensity was set at a value below active motor threshold. This process was repeated following the dual stimulation period.
Silent period
Silent period studies were performed in six subjects. Subjects maintained a 100 g isometric contraction against a force transducer using index finger abduction. The intensity of the magnetic stimulus was adjusted so as to produce a silent period of approximately 150 ms duration. Ten trials were recorded with an inter-trial interval of approximately 5 s. For analysis, the duration of the silent period was defined as the time from stimulus to the return of voluntary EMG activity. Measurements were made on single unrectified trials and the average of these 10 values calculated for each subject. These measurements were repeated following the dual stimulation period, with the stimulus intensity being kept constant throughout.
Data analysis
To determine whether cortical excitability was altered in individual subjects, the amplitudes of MEPs elicited before and after the period of dual stimulation were compared using Student's t tests. A paired t test of mean amplitudes compared the group data. Silent periods were also compared using a paired t test. To identify any change in recruitment curves, MEP amplitudes for each subject were normalised to the largest mean amplitude of MEPs evoked either in the relaxed muscle (for curves in the relaxed condition) or in the contracting muscle (for curves in the active condition). Normalised MEP amplitudes from before and after the dual stimulation were compared using two-way repeated measures ANOVA (intensity of stimulation, before or after dual stimulation). For the paired-pulse studies (intracortical inhibition and facilitation), the amplitude of the conditioned MEPs was expressed as a percentage of the mean amplitude of the test (non-conditioned) MEPs elicited in the same set of trials. The effects of dual stimulation were sought using two-way repeated measures ANOVA (interstimulus interval, before or after dual stimulation) on these data. In a further analysis of the changes in intracortical facilitation, data were grouped into three sets of four successive interstimulus intervals. Mean facilitation for each set of interstimulus intervals was calculated for each subject and data were tested using a two-way repeated measures ANOVA (set, before or after dual stimulation). Post hoc comparison of means was carried out using Student-Newman-Keuls test. Significance was set at P < 0.05 for all tests. Data are expressed as means ±s.d. in the text and are illustrated as means ±s.e.m.
RESULTS
For the group of 16 subjects there was a significant facilitation of the MEP in the relaxed FDI immediately following the dual stimulation period (pre 0.93 ± 0.38 mV, post 2.00 ± 1.09 mV; Student's paired t test, P < 0.05. However, the range in magnitude of facilitation was large. The increase in amplitude was significant (unpaired t tests, P < 0.05) in 12 out of the 16 subjects studied. MEP amplitude was checked at various times throughout the study. Some subjects maintained an increase in MEP amplitude for more than 45 min (Fig. 1A) but in others, MEPs returned to control amplitude more quickly. Other testing was only carried out while MEP amplitude remained increased. Thus, subjects who did not demonstrate an initial significant increase were excluded from all further testing and analysis, whereas subjects whose MEPs returned more quickly to control amplitude took part in only one or two sections of the study. Subjects who took part in each section of the study are listed. In those subjects in whom dual stimulation was effective (subjects 1-12), the mean amplitude of the MEP in FDI increased significantly (P < 0.001; Student's paired t test) from 0.79 ± 0.3 mV to 2.2 ± 1.1 mV (means ±s.d.; Fig. 1B) immediately following the end of the dual stimulation period. This was a mean increase in amplitude of 200 ± 153 %. At the same time the MEP in flexor carpi radialis (FCR), which was not targeted by the peripheral stimulation or by TCMS, showed a mean increase of 128 ± 132 % (from 0.28 ± 0.3 mV to 0.39 ± 0.2 mV). In one subject (subject 6), no MEP was evoked in FCR prior to the dual stimulation and results from this subject are not included.
Figure 1. Effect of dual stimulation on MEPs in FDI and FCR.
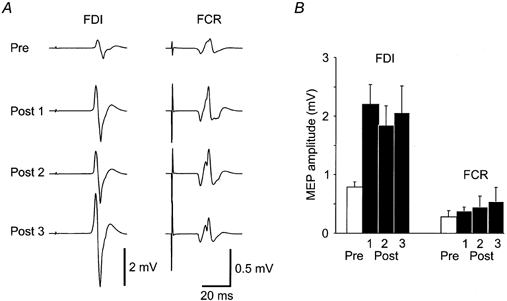
A, EMG traces in one subject recorded from first dorsal interosseous (FDI) and flexor carpi radialis (FCR) prior to and at three times following the dual stimulation intervention. Post 1 is immediately following the dual stimulation period, Post 2 is approximately 20 min and Post 3 is approximately 40 min following the dual stimulation period. Each trace is the average of 10 MEPs. In FDI there is a large facilitation of the MEP amplitude at all times post-intervention. There is a smaller facilitation of MEP amplitude in FCR. B, group data (means ±s.e.m.; n = 12 for Pre and Post 1, 2; n = 10 for Post 3) for the amplitudes of MEPs in FDI and FCR for baseline and post-intervention.
Intracortical inhibition
Six subjects were tested (subjects 1, 2 and 4-7). Immediately prior to these measurements baseline MEPs were facilitated by 309 ± 199 %. The session of dual stimulation had no significant effect on the intracortical inhibition (ANOVA, F1,25= 0.0452, P = 0.830), which can be demonstrated with paired-pulse testing (Fig. 2). Prior to the dual stimulation, the MEP evoked by the test stimulus (1.4 ± 1.0 mV) was inhibited when preceded by 2, 3 or 5 ms by a subthreshold conditioning stimulus. MEPs were reduced, respectively, to 19 ± 10, 12 ± 4 and 66 ± 32 % of the unconditioned amplitude. MEPs were not inhibited with longer ISIs (6, 10 and 15 ms). After the dual stimulation, the intensity of the test stimulus was reduced to produce an MEP of 1.2 ± 0.6 mV (approximately the same as that evoked by the test stimulus alone prior to dual stimulation). The effect of the conditioning stimulus was not changed for any ISI, with ISIs of 2, 3 and 5 ms reducing the MEP to 23 ± 23, 15 ± 8 and 61 ± 45 %, respectively, of its unconditioned amplitude.
Figure 2. Effect of dual stimulation on intracortical inhibition.

A, intracortical inhibition in one representative subject, before (Pre) and after (Post) dual stimulation. Each trace is an average of 12 MEPs recorded from FDI. Interstimulus intervals of 2, 3 and 5 ms are shown. The test MEP (dotted line) is strongly inhibited when a subthreshold conditioning stimulus is given 2 or 3 ms earlier (continuous line). Unconditioned test MEP amplitudes were matched in the two conditions. B, group intracortical inhibition data (means ±s.e.m.) in six subjects. Pre-dual stimulation values are shown as open circles and post-dual stimulation values as filled squares. The time course of inhibition is unaltered by the period of dual stimulation.
Intracortical facilitation
Immediately prior to these measurements baseline MEPs were facilitated by 291 ± 186 %. The session of dual stimulation increased intracortical facilitation at short interstimulus intervals in the six subjects tested (subjects 7-12). When a suprathreshold magnetic cortical stimulus (S1) is followed by a subthreshold stimulus (S2), the MEPs are increased in size in comparison to those elicited by S1 alone. This facilitation occurs with some ISIs between 0.8 and 5.2 ms but not with others (Ziemann et al. 1998a). A typical pattern of enhancement with three peaks of increased size is shown in Fig. 3. However, the exact timing and shape of these peaks varied between subjects. Prior to the session of dual stimulation, the MEP evoked by S1 had a mean amplitude of 0.6 ± 0.4 mV. The maximal increase in MEP size in each subject at any ISI ranged from 81 to 436 %. After the dual stimulation, stimulus intensity was adjusted to evoke MEPs of mean amplitude 0.6 ± 0.4 mV and the maximal increases in MEP size ranged from 126 to 264 %. Although there was no overall change in MEP facilitation, all subjects showed increased facilitation at two or more ISIs within the first peak. The subject illustrated in Fig. 3 shows increases at ISIs of 1.2 and 1.7 ms, and the group data (n = 6) show this trend for ISIs of 0.8, 1.2 and 1.7 ms (Fig. 4A). Changes in facilitation were not significant at any single ISI. However, when ISIs were grouped into those resulting in each of the three peaks of facilitation (peak 1, 0.8-2 ms; peak 2, 2.3-3.3 ms; peak 3, 3.6-5.2 ms), a two-way repeated measures ANOVA comparing the peaks before and after dual stimulation showed a significant interaction (F2,10= 4.817, P < 0.05). Mean facilitation during peak 1 was significantly greater after the session of dual stimulation than before it (P < 0.05, post hoc Student-Newman-Keuls test; Fig. 4B). In contrast, peaks 2 and 3 were not significantly altered (P = 0.52 and P = 0.40, respectively).
Figure 3. Influence of dual stimulation on intracortical facilitation in one subject.
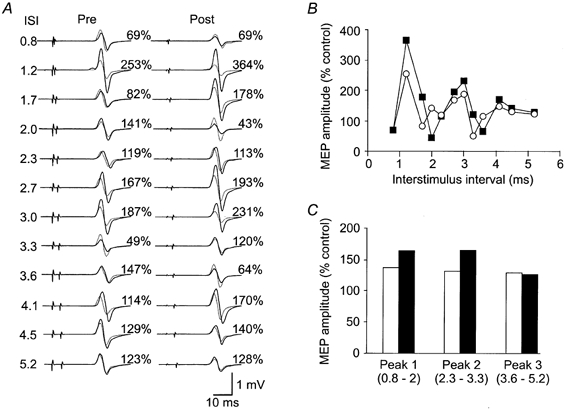
A, EMG traces for the intracortical facilitation experiment in one subject. Each trace is an average of 10 MEPs recorded from FDI. Interstimulus intervals from 0.8 to 5.2 ms are shown before (Pre) and following (Post) a period of dual stimulation. Unconditioned test responses are shown as dotted lines and conditioned responses as continuous lines. At short ISIs (1.2 and 1.7 ms) there is more facilitation following the dual stimulation. B, time course of intracortical facilitation data for the same subject as in A. There is greater facilitation of the first peak in the time course (0.8-1.7 ms) following the period of dual stimulation (filled squares) than in the pre-stimulation period (open circles). This is representative of all subjects. C, data for the same subject with grouping of data across the three peaks of facilitation. Pre-dual stimulation data are shown as open bars and post-dual stimulation data as filled bars.
Figure 4. Group data for intracortical facilitation experiments.
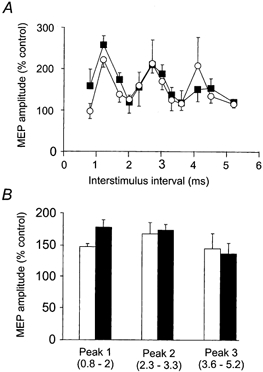
A, data are expressed as a percentage of the unconditioned test response. In both pre- (open circles) and post-dual stimulation (filled squares) conditions the test response amplitudes were matched. Each data point represents the mean (±s.e.m.) of six subjects. There is more facilitation at short interstimulus intervals (0.8-1.7 ms) following the dual stimulation period. B, data for the six subjects grouped for the three peaks of facilitation. Peak 1 (ISIs of 0.8-2.0 ms) is significantly larger following dual stimulation (filled bar). There was no significant difference in peaks 2 or 3 when comparing pre- (open bars) and post-dual stimulation (filled bars) data.
Recruitment curves
The amplitude of MEPs with increasing intensities of stimulation was measured in the relaxed FDI in eight subjects (subjects 2, 3, 5, 7, 8, 9, 11 and 12) and in the contracting FDI in six subjects (6, 7, 8, 9, 11 and 12) before and after the session of dual stimulation. Figure 5 shows that, as expected, the threshold for eliciting an MEP was lower in the contracting muscle than in the relaxed muscle, and that at higher intensities of stimulation MEPs were larger during voluntary contraction than in the relaxed muscle. When MEPs in relaxed FDI were normalised for each subject to the largest MEP recorded in the relaxed muscle, amplitudes overall were greater after the session of dual stimulation (F1,111= 5.559, P < 0.05; two-way ANOVA). However, the mean maximal MEP size recorded in each subject did not increase (4.7 ± 2.6 mV before compared with 6.1 ± 3.6 mV after dual stimulation). In contrast, MEPs evoked during voluntary contraction were not different after the session of dual stimulation (F1,80= 0.689, P = 0.41; two-way ANOVA; Fig. 5) and the mean maximal MEP amplitude was unchanged (from 10.5 ± 4.9 mV to 10.1 ± 7.1 mV).
Figure 5. Effect of dual stimulation on stimulus-response curves.

Data for FDI in the relaxed condition (8 subjects) and active condition (six subjects). Stimulus intensity is shown relative to relaxed threshold and MEP size as peak-to-peak amplitude (mV). The two lower curves (dotted lines) show data (means ±s.e.m.) when subjects were relaxed either prior to dual stimulation (open circles) or following dual stimulation (filled squares). The two upper curves (continuous lines) show data collected during a small voluntary contraction of FDI either prior to (open circles) or following dual stimulation (filled squares). In the relaxed condition MEP amplitudes are significantly larger following the dual stimulation period.
Silent period
The session of dual stimulation did not affect the duration of the silent period evoked by TCMS during a weak voluntary contraction of FDI. Prior to the session of dual stimulation, the stimulus intensity of the magnetic cortical stimulus was adjusted to elicit a silent period of about 150 ms in each subject (subjects 2, 3, 5, 8, 11 and 12). The mean duration of the silent period was unaltered after the dual stimulation (pre-stimulation 146 ± 7 ms, post-stimulation 145 ± 22 ms; paired sample t test, P > 0.05).
DISCUSSION
These studies have confirmed previous reports that a period of dual (peripheral and central) stimulation can lead to significant facilitation of MEPs in hand muscles (Stefan et al. 2000). The major new finding reported here is that the facilitation of MEPs is accompanied by an increase in the amount of intracortical facilitation as measured using a paired TCMS protocol. This increase in facilitation was seen in the first peak of facilitation at ISIs of between 0.8 and 2.0 ms.
MEP amplitude increases
The results from this study confirm previous reports showing that a period of peripheral and central stimulation is capable of producing a lasting increase in corticospinal excitability as indicated by an increase in MEP amplitude (Stefan et al. 2000). A number of pieces of evidence suggest that these changes originate within the motor cortex. First, F waves, which give an indication of global changes in spinal motoneurone excitability, are not altered following a period of peripheral (Ridding et al. 2000) or dual peripheral and central stimulation (Stefan et al. 2000). Second, in the presence of facilitated cortically evoked MEPs, responses evoked using electrical stimulation to activate the descending tracts at the level of the foramen magnum are not facilitated (Stefan et al. 2000). Taken together these findings provide strong evidence that the increase in excitability is due to changes within the motor cortex. The mechanism responsible for the increase in excitability seen with this and similar interventions is unknown but its features suggest a form of associative long-term potentiation may be responsible (Stefan et al. 2000).
Despite the increase in MEP size in the relaxed muscle after the period of dual stimulation, MEPs were not facilitated during voluntary contraction (see Fig. 5). It may be that mechanisms responsible for MEP facilitation in relaxed muscles are masked in some way during voluntary contraction. This is similar to previously reported findings that during ischaemic block MEPs in muscles proximal to the block are facilitated when recorded during relaxation but not during a voluntary contraction (Ridding & Rothwell, 1995, 1997). Voluntary contraction also counteracts the decrease in the motor cortical representation of muscles that have been immobilised for some weeks (Liepert et al. 1995). In general, MEPs are increased in size in the contracting compared to the relaxed muscle. While some of this increase occurs through an increased excitability of the motoneurone pool, there are also changes in cortical responsiveness (Kaneko et al. 1996; Di Lazzaro et al. 1998) and in the operation of intracortical circuits (Ridding et al. 1995). These cortical changes may conceal or override the changes due to dual stimulation. However, it should be noted that the changes due to dual stimulation are not abolished by voluntary contraction. When the muscle is again relaxed, the increase in MEP size reappears.
Intracortical inhibition
The inhibitory neurotransmitter GABA is widespread throughout the cortex and it may well be the actions of inhibitory neurones that control excitability and maintain organisation within the motor cortex (Jacobs & Donoghue, 1991; Sanes & Donoghue, 2000). Our study describes tests of cortical function that may be influenced by GABA activity. Both the paired-pulse testing of intracortical inhibition and the later part of the silent period are thought to depend on the actions of GABAergic neurones within the cortex (Kujirai et al. 1993; Ziemann et al. 1996a,b).
With the apparent cortical reorganisation that follows limb amputation or ischaemic block, the excitability of the muscles proximal to the amputation is increased as shown by an increase in the amplitude of MEPs evoked in those muscles (Brasil-Neto et al. 1992; Ridding & Rothwell, 1995; Chen et al. 1998). Following amputation of a lower limb or of a forearm the increased excitability is accompanied by a reduction in paired-pulse intracortical inhibition, although the duration of the silent period is unaffected (Chen et al. 1998; Schwenkreis et al. 2000). Following amputation of the upper arm, paired-pulse intracortical inhibition is not reduced but the facilitation seen with longer interstimulus intervals in the same protocol is enhanced, suggesting a change in the balance between inhibitory and excitatory intracortical circuits. With the acute deafferentation or ischaemic block, intracortical inhibition is reduced if low frequency TCMS is used to enhance the cortical changes (Ziemann et al. 1998a). It is thought that the reduction in inhibition may have a role to play in the MEP facilitation observed (Ziemann et al. 1998a). Intracortical inhibition has not previously been studied following the plasticity-inducing (dual stimulation) protocol described in the present paper. Here we found no significant difference in the level of intracortical inhibition (nor in facilitation with longer interstimulus intervals) during the period when MEPs were clearly facilitated. Neither the paired-pulse inhibition nor the silent period was altered. Therefore, it would appear unlikely that a change in GABAergic inhibitory activity (Ziemann et al. 1996a; Werhahn et al. 1999) is solely responsible for the MEP amplitude increases reported here. This finding also suggests that the mechanisms responsible for the MEP facilitation seen with dual stimulation are different to those responsible for the facilitation seen after the loss of afferent input from a neighbouring body segment.
Intracortical facilitation
Stimulation of the motor cortex in cats and monkeys results in a series of descending volleys (Patton & Amassian, 1954). The first wave in the volley is due to direct excitation of the corticospinal neurones, and the later waves are due to indirect trans-synaptic activation of the corticospinal neurones. These authors initiated the use of the terms D (direct) and I (indirect) waves to describe the volley. In human subjects it is also possible to record D and I waves following transcranial electric or magnetic stimulation. TCMS preferentially produces I waves at low and moderate stimulus intensities (Day et al. 1987, 1989). The paired-pulse protocol employed (suprathreshold first, subthreshold second stimulus) in the present study has been used as a non-invasive means of investigating I wave interactions in the motor cortex (Ziemann et al. 1998c,d). Using this technique it is possible to record a series of peaks of facilitation at interstimulus intervals of approximately 1.3, 2.7 and 4.2 ms. The first of these peaks is probably due to facilitatory I wave interaction within the motor cortex (Ziemann et al. 1998c). Here we report that following a period of dual peripheral and central stimulation the first peak of facilitation (0.8-2.0 ms) is significantly larger than that seen prior to the dual stimulation. This finding suggests that there may be an increase in I wave interaction within the motor cortex. What this actually means is unclear. However, the most likely explanation (see Ziemann et al. 1998c,d) is as follows. In response to a large stimulus (S1) the corticospinal neurone discharges repeatedly due to its membrane properties. If corticocortical input produced by the second stimulus (S2) arrives at the corticospinal neurone during a period of increased firing probability, S2 will have a significant effect on the size of the MEP. Our finding of an increase in the size of this first peak suggests that there is an increase in excitability of the structures involved in its generation, i.e. the excitatory interneurones or the post-synaptic cell (corticospinal neurone) (Ziemann et al. 1998c, d). The mechanisms by which the increase in excitability are brought about are unknown. It is known that drugs which enhance the actions of GABA in the cortex can suppress the facilitatory interaction and it might be supposed that an increase in facilitation might come from a decrease in GABA activity. However, the lack of change in either paired-pulse inhibition or the silent period argues against this. In terms of a single magnetic stimulus, the increase in the size of the first peak in the response curve is likely to be reflected by more or larger I waves being generated. Increasing the size or number of I waves should result in a larger MEP being evoked. Therefore, it may be that stronger I wave interaction is at least in part responsible for the observed MEP facilitation, which is taken as a sign of cortical plasticity.
In conclusion, we have confirmed that a period of dual stimulation is capable of inducing a lasting increase in excitability of the corticospinal projection to hand muscles. The site of this increase in excitability is likely to lie within the cortex (Stefan et al. 2000). The increased excitability, evidenced by an increase in MEP amplitude, is accompanied by an increase in the size of the first peak of the intracortical facilitation response curve. This first peak of facilitation is thought to reflect I wave interaction within the motor cortex (Ziemann et al. 1998c), and is likely to be at least in part responsible for the MEP facilitation. The mechanisms by which the I wave interactions are increased are unknown. Although intracortical facilitation can be influenced by GABA activity, other tests of the activity of GABAergic neurones were not altered. Further investigation of these circuits may yield potentially important information regarding the mechanisms of cortical plasticity.
Acknowledgments
M.C.R. holds a Royal Adelaide Hospital Florey Fellowship. J.L.T. holds a Research Fellowship from the National Health and Medical Research Council of Australia. This work was supported by the Australian Research Council.
References
- Brasil-Neto JP, Cohen LG, Pascual-Leone A, Jabir FK, Wall RT, Hallett M. Rapid reversible modulation of human motor outputs after transient deafferentation of the forearm: a study with transcranial magnetic stimulation. Neurology. 1992;42:1302–1306. doi: 10.1212/wnl.42.7.1302. [DOI] [PubMed] [Google Scholar]
- Chen R, Corwell B, Yaseen Z, Hallett M, Cohen LG. Mechanisms of cortical reorganization in lower-limb amputees. Journal of Neuroscience. 1998;18:3443–3450. doi: 10.1523/JNEUROSCI.18-09-03443.1998. [DOI] [PMC free article] [PubMed] [Google Scholar]
- Day BL, Dressler D, Maertens De Noordhout A, Marsden CD, Nakashima K, Rothwell JC, Thompson PD. Electric and magnetic stimulation of human motor cortex: surface EMG and single motor unit responses. Journal of Physiology. 1989;412:449–473. doi: 10.1113/jphysiol.1989.sp017626. [DOI] [PMC free article] [PubMed] [Google Scholar]
- Day BL, Rothwell JC, Thompson PD, Dick JP, Cowan JM, Berardellii A, Marsden CD. Motor cortex stimulation in intact man. 2. Multiple descending volleys. Brain. 1987;110:1191–1209. doi: 10.1093/brain/110.5.1191. [DOI] [PubMed] [Google Scholar]
- Di Lazzaro V, Restuccia D, Oliviero A, Profice P, Ferrara L, Insola A, Mazzone P, Tonali P, Rothwell JC. Effects of voluntary contraction on descending volleys evoked by transcranial stimulation in conscious humans. Journal of Physiology. 1998;508:625–633. doi: 10.1111/j.1469-7793.1998.625bq.x. [DOI] [PMC free article] [PubMed] [Google Scholar]
- Jacobs KM, Donoghue JP. Reshaping the cortical motor map by unmasking latent intracortical connections. Science. 1991;251:944–947. doi: 10.1126/science.2000496. [DOI] [PubMed] [Google Scholar]
- Kaneko K, Kawai S, Fuchigami Y, Shiraishi G, Ito T. Effect of stimulus intensity and voluntary contraction on corticospinal potentials following transcranial magnetic stimulation. Journal of Neurological Sciences. 1996;139:131–136. [PubMed] [Google Scholar]
- Kujirai T, Caramia MD, Rothwell JC, Day BL, Thompson PD, Ferbert A, Wroe S, Asselman P, Marsden CD. Corticocortical inhibition in human motor cortex. Journal of Physiology. 1993;471:501–519. doi: 10.1113/jphysiol.1993.sp019912. [DOI] [PMC free article] [PubMed] [Google Scholar]
- Liepert J, Tegenthoff M, Malin J-P. Changes of cortical motor area size during immobilization. Electroencephalography and Clinical Neurophysiology. 1995;97:382–386. doi: 10.1016/0924-980x(95)00194-p. [DOI] [PubMed] [Google Scholar]
- Patton HD, Amassian VE. Single- and multiple-unit analysis of cortical stage of pyramidal tract activation. Journal of Neurophysiology. 1954;17:345–363. doi: 10.1152/jn.1954.17.4.345. [DOI] [PubMed] [Google Scholar]
- Ridding MC, Brouwer B, Miles TS, Pitcher JB, Thompson PD. Changes in muscle responses to stimulation of the motor cortex induced by peripheral nerve stimulation in human subjects. Experimental Brain Research. 2000;131:135–143. doi: 10.1007/s002219900269. [DOI] [PubMed] [Google Scholar]
- Ridding MC, Rothwell JC. Reorganisation in human motor cortex. Canadian Journal of Physiology and Pharmacology. 1995;73:218–222. doi: 10.1139/y95-032. [DOI] [PubMed] [Google Scholar]
- Ridding MC, Rothwell JC. Stimulus/response curves as a method of measuring motor cortical excitability in man. Electroencephalography and Clinical Neurophysiology. 1997;105:340–344. doi: 10.1016/s0924-980x(97)00041-6. [DOI] [PubMed] [Google Scholar]
- Ridding MC, Taylor JL, Rothwell JC. The effect of voluntary contraction on cortico-cortical inhibition in human motor cortex. Journal of Physiology. 1995;487:541–548. doi: 10.1113/jphysiol.1995.sp020898. [DOI] [PMC free article] [PubMed] [Google Scholar]
- Sanes JN, Donoghue JP. Plasticity and primary motor cortex. Annual Review of Neuroscience. 2000;23:393–415. doi: 10.1146/annurev.neuro.23.1.393. [DOI] [PubMed] [Google Scholar]
- Schwenkreis P, Witscher K, Janssen F, Dertwinkel R, Zenz M, Malin J-P, Tegenthoff M. Changes of cortical excitability in patients with upper limb amputation. Neuroscience Letters. 2000;293:143–146. doi: 10.1016/s0304-3940(00)01517-2. [DOI] [PubMed] [Google Scholar]
- Stefan K, Kunesch E, Cohen LG, Beneke R, Classen J. Induction of plasticity in the human motor cortex by paired associative stimulation. Brain. 2000;123:572–584. doi: 10.1093/brain/123.3.572. [DOI] [PubMed] [Google Scholar]
- Tokimura H, Ridding MC, Tokimura Y, Amassian VE, Rothwell JC. Short latency facilitation between pairs of threshold magnetic stimuli applied to human motor cortex. Electroencephalography and Clinical Neurophysiology. 1996;101:263–272. doi: 10.1016/0924-980x(96)95664-7. [DOI] [PubMed] [Google Scholar]
- Werhahn KJ, Kunesch E, Noachtar S, Beneke R, Classen J. Differential effects on motorcortical inhibition induced by blockade of GABA uptake in humans. Journal of Physiology. 1999;517:591–597. doi: 10.1111/j.1469-7793.1999.0591t.x. [DOI] [PMC free article] [PubMed] [Google Scholar]
- Ziemann U, Corwell B, Cohen LG. Modulation of plasticity in human motor cortex after forearm ischemic nerve block. Journal of Neuroscience. 1998a;18:1115–1123. doi: 10.1523/JNEUROSCI.18-03-01115.1998. [DOI] [PMC free article] [PubMed] [Google Scholar]
- Ziemann U, Hallett M, Cohen LG. Mechanisms of deafferentation-induced plasticity in human motor cortex. Journal of Neuroscience. 1998b;18:7000–7007. doi: 10.1523/JNEUROSCI.18-17-07000.1998. [DOI] [PMC free article] [PubMed] [Google Scholar]
- Ziemann U, Lonnecker S, Steinhoff BJ, Paulus W. Effects of antiepileptic drugs on motor cortex excitability in humans: a transcranial magnetic stimulation study. Annals of Neurology. 1996a;40:367–378. doi: 10.1002/ana.410400306. [DOI] [PubMed] [Google Scholar]
- Ziemann U, Rothwell JC, Ridding MC. Interaction between intracortical inhibition and facilitation in human motor cortex. Journal of Physiology. 1996b;496:873–881. doi: 10.1113/jphysiol.1996.sp021734. [DOI] [PMC free article] [PubMed] [Google Scholar]
- Ziemann U, Tergau F, Wassermann EM, Wischer S, Hildebrandt J, Paulus W. Demonstration of facilitatory I wave interaction in the human motor cortex by paired transcranial magnetic stimulation. Journal of Physiology. 1998c;511:181–190. doi: 10.1111/j.1469-7793.1998.181bi.x. [DOI] [PMC free article] [PubMed] [Google Scholar]
- Ziemann U, Tergau F, Wischer S, Hildebrandt J, Paulus W. Pharmacological control of facilitatory I-wave interaction in the human motor cortex. A paired transcranial magnetic stimulation study. Electroencephalography and Clinical Neurophysiology. 1998d;109:321–330. doi: 10.1016/s0924-980x(98)00023-x. [DOI] [PubMed] [Google Scholar]