

Abstract
The properties of the slow inward ‘tail currents’ (Itail) that followed depolarizing steps in voltage-clamped, isolated mouse ventricular myocytes were examined. Depolarizing steps that produced large outward K+ currents in these myocytes were followed by a slowly decaying inward Itail on repolarization to the holding potential. These currents were produced only by depolarizations: inwardly rectifying K+ currents, IK1, produced by steps to potentials negative to the holding potential, were not followed by Itail.
For depolarizations of equal duration, the magnitude of Itail increased as the magnitude of outward current at the end of the depolarizing step increased. The apparent reversal potential of Itail was dependent upon the duration of the depolarizing step, and the reversal potential shifted to more depolarized potentials as the duration of the depolarization was increased.
Removal of external Na+ and Ca2+ had no significant effect on the magnitude or time course of Itail. BaCl2 (0.25 mm), which had no effect on the magnitude of outward currents, abolished Itail and IK1 simultaneously.
Accordingly, Itail in mouse ventricular myocytes probably results from K+ accumulation in a restricted extracellular space such as the transverse tubule system (t-tubules). The efflux of K+ into the t-tubules during outward currents produced by depolarization shifts the K+ Nernst potential (EK) from its ‘resting’ value (close to −80 mV) to more depolarized potentials. This suggests that Itail is produced by IK1 in the t-tubules and is inward because of the transiently elevated K+ concentration and depolarized value of EK in the t-tubules.
Additional evidence for the localization of IK1 channels in the t-tubules was provided by confocal microscopy using a specific antibody against Kir2.1 in mouse ventricular myocytes.
The complex structure of cardiac muscle has made interpretation of the results of early electrophysiological studies of the membrane currents in multicellular tissue difficult. One of the most important problems in multicellular tissue is the accumulation of K+ in the intercellular clefts, which are only 20-30 nm wide. These changes in the extracellular K+ concentration can distort the magnitude and time course of K+ currents (Almers, 1972; Attwell & Cohen, 1977; Attwell et al. 1979; Cohen & Kline, 1982). Many of these problems have been greatly reduced by the use of enzymatically isolated single cardiac cells. However, single myocytes have numerous invaginations of the sarcolemmal membrane that could act as restricted spaces in which ions might accumulate during activation of transmembrane currents. For example, adult mouse ventricular myocytes have an extensive transverse tubule (t-tubule) system whose surface area makes up approximately 50 % of the total sarcolemmal membrane of the cells (Forbes et al. 1984). These tubules are small, about 50-100 nm in diameter (Forbes et al. 1984), and hence the tubule lumen could readily accumulate ions during current flow across the t-tubule membrane.
During the course of a voltage-clamp study of the K+ currents in single adult mouse ventricular myocytes (Fiset et al. 1997), it was noted that outward currents produced by depolarizing voltage-clamp steps were followed by a transient inward ‘tail current’ (Itail) when the ventricular cell was repolarized to a holding potential near the cell's resting membrane potential (-80 mV). In contrast, no inward Itail were observed following depolarizing steps in adult mouse atrial myocytes. The present study was undertaken to investigate the properties and the origin of Itail in adult mouse ventricular myocytes. The results of this study show that Itail is due to K+ accumulation within the t-tubule system of mouse ventricular myocytes and subsequent activation of inwardly rectifying K+ (IK1) channels.
METHODS
Isolation of adult mouse ventricular myocytes and electrophysiological methods
Ventricular myocytes were isolated from adult male Swiss-Webster or CD-1 mice (6-9 weeks of age) by enzymatic dissociation, as described previously (Fiset et al. 1997). The animals were heparinized, anaesthetized by inhalation of methoxyflurane and then killed by cervical dislocation. After perfusion of the heart with enzyme solutions, the ventricular tissue was triturated gently with a Pasteur pipette for 10-15 min. Rod-shaped single myocytes were then collected and stored in Kraft-Brühe (KB) solution at 4 °C until use 2-6 h later. During cell isolation solutions were maintained at 37 ± 1 °C and were equilibrated with 100 % O2. Isolated cells were placed into a recording chamber (volume ∼ 200 μl) on the stage of an inverted microscope (Diaphot; Nikon, Tokyo, Japan) and superfused with a Hepes-buffered Tyrode solution at 1-2 ml min−1. All experiments were carried out at a room temperature (RT) of 20-22 °C. Whole-cell voltage-clamp recordings were made with a patch-clamp amplifier (EPC-7; List-Medical Electronics, Darmstadt, Germany). Patch pipettes had resistances in the range 1.5-4 MΩ when filled with pipette solution. Series resistance in the whole-cell mode was in the range 4-8 MΩ; 80-90 % series resistance compensation was always used. Voltage-clamp currents were low-pass filtered at 1-3 kHz (four-pole Bessel), digitized at 4-10 kHz with a 12 bit analog-to-digital converter (DT2821; Data Translation, Marlborough, MA, USA), and stored in a microcomputer using Cellsoft software (D. Bergman, University of Calgary). The same software controlled the programmable stimulator that generated the voltage-clamp protocols.
Membrane currents were normalized to cell capacitance (pA pF−1) when required. Capacitive currents were produced by a 5 mV depolarization from a holding potential of -80 mV and integrated to determine the cell capacitance.
Immunofluorescence analysis and confocal microscopy
Ventricular myocytes were freshly isolated from 6- to 9-week-old male mice and plated on laminin-coated coverslips (15 μg ml−1) for 1 h at 37 °C, 5 % CO2. Cells were fixed (2 % paraformaldehyde, pH 7.4, 10 min, 4 °C) and subsequently permeabilized (0.1 % Triton X-100, 10 min, RT). Three washes with phosphate-buffered saline (PBS) followed each step. To prevent non-specific binding, cells were blocked with 10 % normal donkey serum (NDS) for 1 h at RT. After overnight incubation with a rabbit polyclonal primary anti-Kir2.1 antibody (1:200; Alomone Laboratories, Jerusalem, Israel), cells were washed with PBS and incubated for 1 h at RT with a tetramethylrhodamine-isothiocyanate-conjugated donkey anti-rabbit antibody (1:500; Jackson ImmunoResearch, West Grove, PA, USA). In control experiments, the primary antibody was omitted. Cells were then washed three times with PBS and incubated for 30 min at RT with wheat germ agglutinin (WGA) conjugated to Oregon Green 488 (1:10; Molecular Probes) (Sedarat et al. 2000; Takeuchi et al. 2000). After washing the cells with PBS, coverslips were mounted on slides using 1 mg ml−1p-phenylenediamine diluted with 75 % glycerol and examined using a Zeiss Axiovert 100M microscope coupled to a Zeiss LSM 510 laser scanning confocal system.
Solutions and drugs
The Hepes-buffered Tyrode solution contained (mm): 140 NaCl, 5.4 KCl, 1 CaCl2, 1 MgCl2, 10 Hepes, 5.5 glucose (pH adjusted to 7.4 at RT with NaOH). BaCl2 was added to the solution at the concentrations indicated. Where indicated, NaCl was replaced by an isomolar amount of N-methyl-d-glucamine, and CaCl2 was replaced by MgCl2; the pH of this ‘Na+-/Ca2+-free’ solution was adjusted to 7.4 with HCl. The patch pipette solution contained (mm): 110 potassium aspartate, 20 KCl, 8 NaCl, 1 MgCl2, 1 CaCl2, 10 EGTA, 4 K2ATP, 10 Hepes (pH adjusted to 7.2 with KOH). Solutions were continuously gassed with 100 % O2.
Statisticl analysis
All results are presented as means ±s.e.m. Statistical significance was determined by Student's t test for paired or unpaired observations, or ANOVA, where appropriate. Statistical analyses were performed using Origin 5.0 software. A probability of P < 0.05 was considered significant.
RESULTS
Slow Itail follow depolarization of voltage-clamped mouse ventricular myocytes
Figure 1A illustrates a representative example of a family of membrane currents recorded from a voltage-clamped mouse ventricular myocyte, produced by 750 ms voltage steps over the range of membrane potentials from -120 to +50 mV, from a holding potential of -80 mV. Several features of these currents are of note.
Figure 1. Slow, inward ‘tail currents’, Itail, follow the depolarization of voltage-clamped, adult mouse ventricular myocytes.
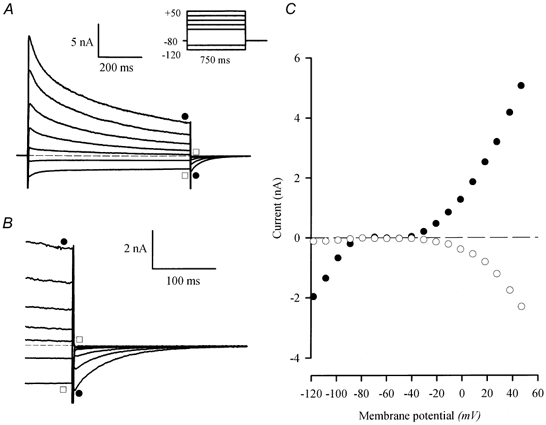
A, family of currents from a voltage-clamped, isolated mouse ventricular myocyte. The voltage-clamp protocol is shown in the inset; the holding potential was -80 mV; 0.75 s steps to potentials between -120 and 50 mV (-120, -100, -30, -10, 10, 30 and 50 mV) were applied at 0.1 Hz. Slowly decaying, inward currents followed the depolarizing (•), but not the hyperpolarizing (□), voltage-clamp steps. The dashed line indicates zero current in this, and all subsequent figures. B, currents at the end of the depolarizing steps and after repolarization to -80 mV are shown on expanded time and current scales. Note that the magnitude of the inward Itail increased as the magnitude of the outward current at the end of the step increased (•). No Itail followed hyperpolarizing steps (□). C, current-voltage relationship for currents obtained at the end of the voltage-clamp steps (•), and peak Itail (○).
(1) The outward membrane currents in adult mouse ventricular myocytes, which are carried primarily by K+ (Fiset et al. 1997), are very large. For the cell shown in Fig. 1, the peak current produced by the step to +50 mV corresponded to a current density of about 90 pA pF−1.
(2) Outward currents declined in two distinct phases during the depolarizing steps. It has previously been shown that there are at least two different transient components of the outward K+ current in mouse ventricular myocytes (Fiset et al. 1997; Nerbonne, 2000; Trépanier-Boulay et al. 2001).
(3) Outward currents were followed by slow, transient Itail on repolarization to the holding potential. This is illustrated more clearly in Fig. 1B, which shows the family of currents at the end of the depolarizing steps and after repolarization to the holding potential, on expanded time and current scales. Note that Itail followed only the depolarizing voltage steps; no ‘tail currents’ were associated with the inward currents produced by hyperpolarizing steps.
Figure 1C shows the current-voltage relationships for the inward and outward currents, and for Itail. As shown in Fig. 1A and B, Itail was not produced by steps to potentials that generated inward currents; this was true even at potentials where the magnitude of the inward and outward currents was equal. For example, the currents produced by steps to -120 and +10 mV were of approximately equal magnitude at the end of the steps, but Itail was associated only with the +10 mV step. Figure 1C shows that the magnitude of Itail increased as the magnitude of the outward current at the end of the depolarizing step increased.
Figure 2 summarizes the main properties of Itail, averaged from nine different ventricular myocytes. Figure 2A shows the relationship between the current at the end of the depolarizing step (Iend) and Itail. The ratio Itail/Iend varied considerably from cell to cell; for example, for 1 s steps to +30 mV, this ratio ranged from 0.2 to 1.07. The average value of this ratio was independent of membrane potential over the range -20 to +40 mV. Figure 2B summarizes the kinetic properties of Itail. The time course of decay of Itail (at -80 mV) was described approximately by a single exponential function. The time constant varied from cell to cell over about a threefold range (e.g. from 29.7 to 77 ms) for the same nine myocytes as above (for Itail following +30 mV depolarizing steps). The average time constant was not significantly dependent upon membrane potential over the range -30 to +40 mV. The time constant was also independent of the magnitude of Itail; Fig. 2C shows a plot of the relative amplitude of Itail (normalized to Itail following a +40 mV step) as a function of membrane potential from -30 mV to +40 mV. Note that although Itail increased in magnitude by about 10-fold over this range of potentials, the time constant of decay did not change significantly.
Figure 2. Summary of the properties of Itail.
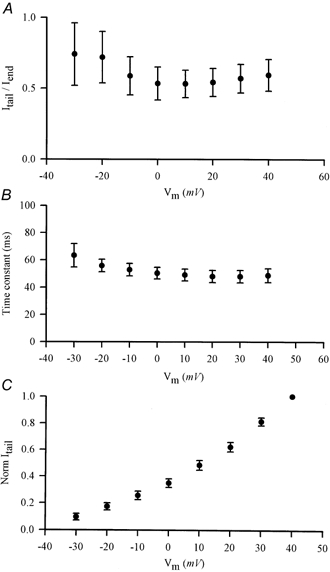
A, plot of the ratio of magnitude of Itail to current at the end of the depolarizing step (Iend) as a function of the step potential. Data (means ±s.e.m.) were averaged from nine different ventricular myocytes. Slow Itail were measured at a holding potential of -80 mV. B, plot of the time constant of decay of Itail as a function of depolarizing step potential. Itail was fitted to single exponential functions. Data (means ±s.e.m.) were averaged from nine cells (same as in A). C, normalized magnitude of Itail, as a function of depolarizing step potential. Current magnitudes were normalized to Itail at +40 mV. Data (means ±s.e.m.) were averaged from nine cells (same as above).
It is unlikely that channel deactivation is the mechanism that is responsible for generating Itail in mouse ventricular myocytes. The major part of the outward current in these cells is carried by K+; hence, current tails produced by deactivation would be expected to have their reversal potential near the K+ Nernst potential (EK), which is about -83 mV in the recording conditions used in these experiments (see Methods). Consequently, large inward Itail would not be expected to occur at a holding potential of -80 mV (i.e. near EK). The data shown in Fig. 3 provide further evidence that channel deactivation is not responsible for Itail. In these experiments, ventricular cells were repeatedly voltage clamped to the same potential (+20 mV), but the duration of the depolarizing step was progressively increased. Figure 3A shows that the magnitude of Itail first increased, reached a maximum, and then decreased slightly as the depolarizing step was increased over the range from 10 to 285 ms. However, the magnitude of the outward current at the end of the depolarizing step decreased continually as the duration of the step increased. This is shown more clearly in the plots in Fig. 3B, in which the magnitudes of the outward current at the end of the step and Itail are compared for each pulse duration. Itail was small during depolarizing steps of brief duration (e.g. < 50 ms) where the outward current was largest. The magnitude of Itail increased in parallel with step duration up to a limit of 100-150 ms, and then declined slightly for longer steps. This relationship between outward current and Itail magnitudes cannot be explained by a simple channel deactivation mechanism.
Figure 3. Effect of duration of depolarization on the magnitude of Itail.
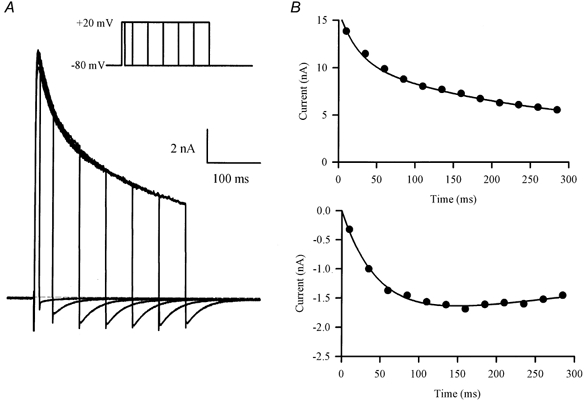
A, family of currents produced by a series of voltage-clamp steps (20 mV) of increasing duration (10-285 ms; inset). Note that Itail increased in magnitude with increasing step duration, while the outward current at the end of each step decreased. B, plots of outward current at the end of the depolarizing step (upper graph) and Itail magnitude (lower graph), as a function of depolarizing step duration.
Na+-Ca2+ exchange does not generate Itail
Slow inward Itail can be generated in ventricular myocytes by the electrogenic Na+-Ca2+ exchanger (Egan et al. 1989; Bouchard et al. 1993). The rise in [Ca2+]i produced during depolarization, due to the influx of Ca2+ through L-type Ca2+ channels and/or Ca2+-induced release from sarcoplasmic reticulum stores, activates the Na+-Ca2+ antiporter. The voltage dependence of Na+-Ca2+ exchange results in an inward current when the membrane is repolarized near -80 mV (Bouchard et al. 1993). However, this is not likely to underlie Itail. The intracellular solution contains a high concentration of EGTA (10 mm) as a Ca2+ buffer, so it is unlikely that intracellular free Ca2+ concentration increases during depolarizing steps. Figure 4 shows data that make it clear that Na+-Ca2+ exchange does not generate Itail. In these experiments, currents produced by a depolarizing step (20 mV, 1 s) were recorded in control conditions and then in Na+ and Ca2+-free Hepes-buffered Tyrode solution (see Methods). The depolarizing step in both control and Na+ and Ca2+-free solutions produced Itail of equal magnitude and duration upon repolarization to the holding potential of -80 mV. Since Na+-Ca2+exchange is completely blocked in Na+ and Ca2+-free solution (Bers et al. 1990), the lack of effect of Na+ and Ca2+-free solution on Itail makes it improbable that Na+-Ca2+ exchange was responsible for generating the slow Itail.
Figure 4. Itail is not generated by Na+-Ca2+ exchange.
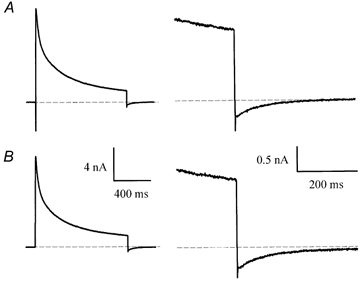
A, current produced by a 20 mV, 1 s voltage-clamp step in control Hepes-buffered solution. Right panel: current is shown on expanded time and current scales. B, current in the same cell, after removing external Na+ and Ca2+ (see Methods). Note that Itail was unaffected by the removal of Na+ and Ca2+.
Blocking IK1 abolishes Itail
Barium, at concentrations less than 1 mm, is a specific blocker of the inwardly rectifying K+ current, IK1, in mouse ventricular myocytes. Figure 5 shows that 0.25 mm BaCl2 blocks both IK1 and Itail in mouse ventricular myocytes. In the experiment shown, a depolarizing step (+20 mV, 50-200 ms duration) that produced a large outward current, and Itail on repolarization, was followed by a hyperpolarizing step (-120 mV, 100 ms) that activated inward IK1. Application of BaCl2 completely blocked both IK1 and Itail, but had no effect on the outward currents. In addition, the time courses of block of IK1 and Itail as the BaCl2 solution was washed into the recording chamber were identical (data not shown). These data provide strong evidence that Itail is generated by K+ flux through IK1 channels. As the holding potential (-80 mV) was close to the nominal EK under these recording conditions (see Methods), only very small IK1 would be expected to occur. The large, inward Itail implies that the K+ gradient is transiently reduced by the depolarizing voltage-clamp steps, resulting in a depolarizing shift of EK.
Figure 5. Ba2+ blocks Itail and the inwardly rectifying K+ current, IK1, in mouse ventricular myocytes.
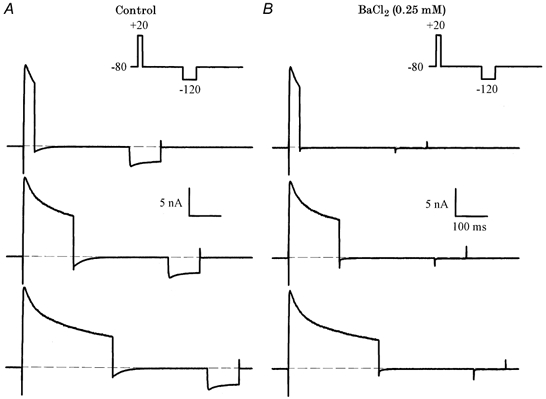
A, voltage-clamp currents recorded in control solution. The voltage-clamp protocol (inset) consisted of a depolarizing step to 20 mV (35, 160, 285 ms), and a hyperpolarizing step to -120 mV (100 ms). The inward current produced by the hyperpolarizing step is IK1. B, currents after the addition of 0.25 mm BaCl2. Note that both Itail and IK1 were abolished, but there was no significant effect on the outward currents.
The ‘reversal potential’ of Itail is time dependent
Figure 6A illustrates experiments designed to measure the reversal potential of Itail. A depolarizing step (200 ms, +10 mV) was followed by 1 s steps to membrane potentials between -30 and -90 mV. The Itail appeared to reverse at potentials between approximately -50 and -70 mV. Figure 6A shows currents recorded from the same myocyte before and after the addition of 0.25 mm BaCl2. The main effect of this concentration of BaCl2 was to block inward Itail: this is particularly evident for the steps to -80 and -90 mV. In contrast, outward tail currents, especially those produced by the most positive steps in this protocol (i.e. -30 and -40 mV), were not changed significantly by BaCl2. Figure 6B shows the BaCl2-sensitive difference currents that were obtained by subtracting currents before and after the addition of BaCl2. These difference currents, measured ‘immediately’ (2 ms) following the depolarizing steps, showed very pronounced inward rectification; their reversal potential was about -60 mV. The outward currents produced by steps positive to -60 mV were very small compared with the inward currents produced by the steps negative to -60 mV. This rectification is clearly apparent from an inspection of the difference currents plotted on an expanded time scale in Fig. 6B. It is also apparent from the records in Fig. 6B that the reversal potential of the difference currents changed with time; the current at -70 mV reversed direction from inward to outward about 50 ms after the end of the depolarizing step, while the current at -80 mV reversed about 100 ms after the depolarizing step. Figure 6C compares peak current- voltage relationships for difference Itail, measured ‘immediately’ (2 ms) after the end of the depolarizing step and 1 s after the end of the step. The current-voltage relationship measured 2 ms after the end of the depolarizing step reversed at -62.9 mV and had strong inward rectification, while the currents measured at 1 s reversed at -86.0 mV, and had a negative slope conductance at membrane potentials positive to about -70 mV. Figure 6C also shows the current-voltage relationship measured at 75 ms after the depolarizing step; the reversal potential was -74.5 mV. In experiments with seven different myocytes (including that in Fig. 6), the mean reversal potential of BaCl2-sensitive Itail measured within 2 ms after the depolarizing step was -60.3 ± 1 mV, while the reversal potential measured at 1 s was -84.5 ± 0.8 mV. The latter value is very close to EK under the recording conditions used in these experiments. We repeated a similar experiment measuring the reversal potential of Itail using a higher extracellular K+ concentration. Figure 6D shows a representative current-voltage relationship measured at 2 ms, 75 ms and 1 s after the depolarizing step in the presence of 20 mm external K+. For all three measurements, the current reversed at values very close to the nominal EK (e.g. -49.5 mV with the present recording conditions). Data averaged from four different ventricular myocytes indicate that the currents reversed at -47.3 ± 2.5, -50.0 ± 1.3 and -50.9 ± 1.1 mV, when measured at 2 ms, 75 ms and 1 s, respectively. These data show clearly that in the higher external K+, the change in extracellular K+ concentration, and the time-dependent change in the apparent reversal potential of Itail due to K+ efflux were minor.
Figure 6. Reversal potential of BaCl2-sensitive Itail.
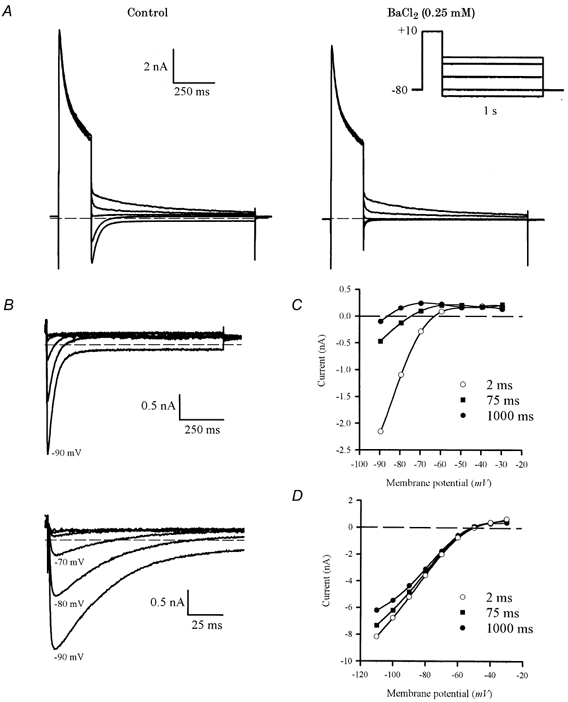
A, voltage-clamp currents produced by a two-step protocol (right, inset), consisting of a 200 ms depolarizing step to +10 mV, followed by a series of 1 s steps to -30, -40, -60, -80 and -90 mV. In control conditions (left panel), the tail currents reversed near -60 mV. Large, inward currents were produced by steps to -80 and -90 mV. After the addition of 0.25 mm BaCl2 (right panel), the large inward Itail were almost completely abolished, but there was relatively little effect on the outward Itail. B, BaCl2-sensitive Itail, obtained by subtracting currents in BaCl2 from control currents. Voltage steps were from -30 to -90 mV, in 10 mV increments (-50 and -70 mV steps are not shown in A). The lower panel shows the initial parts of Itail on an expanded time scale. Note that the currents for -70 and -80 mV are initially inward, but become net outward within about 100 ms after the end of the depolarizing step. C, current-voltage relationship for BaCl2-sensitive Itail measured 2 ms (○), 75 ms (▪) and 1 s (•) after the end of the depolarizing step. D, current-voltage relationship for Itail measured at 2 ms (○), 75 ms (▪) and 1 s (•) after the end of the depolarizing step in an extracellular solution containing 20 mm K+. Smooth curves through each set of points are fifth-order polynomial regressions: reversal potentials for each set of points were obtained from these polynomials by interpolation (see text for values).
Decay time course of Itail depends upon presence of IK1
The data in Fig. 5 and 6 suggest strongly that Itail is generated by IK1. These data can be explained by assuming that K+ accumulates in an extracellular space in which there is relatively restricted diffusion between this space and the ‘bulk’ external solution, and Itail is produced by current flow through IK1 channels in the membranes of the restricted space. The decay of Itail reflects the ‘clearing’ of this space of excess K+ by both the processes of diffusion, and transport of K+ into the cell cytosol through IK1 channels. This implies that if either of these major transport processes were impeded, the decline of K+ concentration in the restricted space would be slowed. Figure 7 shows the results of an experiment that tests this idea by ‘blocking’IK1 by repolarizing to a membrane potential where Itail is always very small. In this experiment, the potential was -60 mV; as shown in Fig. 6, at this membrane potential Itail was always a small, outward current. The amount of excess K+ remaining at selected times after the end of a depolarizing step was measured using a brief (10 ms) ‘test’ step from -60 to -80 mV; this step activated a measurable Itail at each time (Fig. 7A). The currents produced by this series of test steps were compared with Itail produced by repolarization to the holding potential of -80 mV. Figure 7B compares the time course of Itail at -80 mV with the time course of 10 ms test-step current amplitudes, applied between 0 and 480 ms after the end of a 300 ms depolarizing step of +10 mV. The decay of Itail, and therefore the decline of accumulated K+, was very much slower when IK1 was inhibited by repolarizing to -60 mV. The best-fit, single-exponential function fitted to Itail at -80 mV had a time constant of about 46 ms; the best-fit, single-exponential for the test-step currents had a time constant of 161 ms. A two-exponential function gave a better fit to the test current time course, with fast and slow time constants of 112.4 and 329.3 ms, respectively (Fig. 7B). Single exponential functions were fitted to both Itail at -80 mV and test step currents from a potential of -60 mV. For each cell, the time constant of Itail at -80 mV (50.7 ± 4.1 ms) was considerably smaller than of the test step (75.2 ± 3.2 ms P < 0.001; Table 1).
Figure 7. Time course of decay of Itail depends upon current flow.
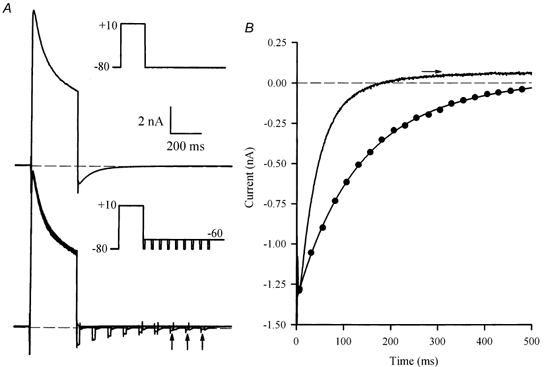
A, upper panel, voltage-clamp currents produced by a 300 ms, +10 mV step, from a holding potential of -80 mV (inset). A large inward Itail was produced on repolarization to -80 mV. Lower panel, series of superimposed currents produced by the same depolarizing step, but followed at different times by a 10 ms ‘test’ step to -80 mV, from a potential of -60 mV. Currents shown were produced by test steps that were applied between 0 and 400 ms after the end of the depolarizing step, in 50 ms increments (see inset). Vertical arrows indicate currents from test steps at 300, 350 and 400 ms. Time and current scales are the same for both panels. B, comparison of the time course of Itail recorded at a membrane potential of -80 mV (continuous line), and the magnitude of the test step currents as a function of time after the end of the depolarizing step (•). The dotted line through the test currents is a best-fit, double-exponential function, with time constants of 112.4 and 329.3 ms. The amplitudes of the fast and slow components were -1.03 and -0.38 nA, respectively. The horizontal arrow indicates the level of Itail (at -80 mV) at 1 s after the repolarizing step; the double-exponential function was constrained to fit to this level.
Table 1.
Comparison of the time course of current decay at test pulses of -80 and -120 mV
| −80 mV | −120 mV | |||
|---|---|---|---|---|
| τ (ms) | n | τ (ms) | n | |
| Itail | 50.7 ± 4.1 | 13 | 37.9 ± 3.5* | 9 |
| Train of pulses | 75.2 ± 3.2 †‡ | 15 | 62.9 ± 4.7 *‡ | 14 |
| Single pulse at various times | 120.5 ± 11.4 †‡ | 15 | 87.7 ± 7.7 *‡ | 9 |
Time constants obtained from a single exponential function for the decline of the tail current (Itail) and of the currents obtained with the train of pulses or with a single pulse applied at various times. Data are given as means ±s.e.m.
P = 0.03 vs. corresponding parameter at -80 mV
P < 0.001 vs. Itail
P < 0.01 vs. pulse.
To confirm the importance of the inward K+ flux, we repeated the protocol presented in Fig. 7, comparing two different test potentials (e.g. -80 and -120 mV). The decline of the Itail proceeded faster at the more hyperpolarized potential (37.9 ± 3.5 ms at -120 mV compared to 50.7 ± 4.1 ms at -80 mV, P = 0.03). According to the idea that the slow Itail results from the slow clearing of accumulated K+ by simple diffusion and inward transport of K+ through IK1 channels, the decay of the currents produced by this series of test steps was faster for the test pulse that produced the larger inward current (62.9 ± 4.7 ms at -120 mV compared to 75.2 ± 3.2 ms at -80 mV, P = 0.03), hence carrying away more K+ per test pulse.
We then evaluated the contribution of a simple diffusion by using the following protocol. After a depolarizing pulse, the cells were held at -60 mV for various lengths of time, and we then applied one hyperpolarizing test pulse (at -80 mV or -120 mV) to estimate the amplitude of Itail. Single exponential functions fitted to the currents produced with this protocol were compared to those obtained with the current elicited by the train of pulses (Table 1). For the hyperpolarizing steps of -80 mV, the time constant of the current decay obtained with the train of pulses (75.2 ± 3.2 ms) was considerably smaller than that of the current decay obtained with the single pulse applied at various times (120.5 ± 11.4 ms, P = 0.004). Similarly, at -120 mV, the time constant of current decline was also faster with the train of pulses (62.9 ± 4.7 ms) compared to that obtained with the single pulse applied at various times (87.7 ± 7.7 ms, P = 0.004). The single-pulse protocol shows that clearing of K+ from the restricted space is slowed when inward flux is reduced, leaving simple diffusion as the major clearing mechanism. In addition, the decay of the test-pulse current amplitude obtained with the single pulse applied at various times was significantly faster at -120 mV (Table 1) compared to -80 mV. Again, this confirms the importance of the inward flux for the clearing of the K+ in the restricted space.
Immunolocalization of Kir2.1 in mouse ventricular myocytes
There is evidence that IK1 consists of different members of the Kir2 family. For instance, Kir2.1, Kir2.2 and Kir2.3 have all been found in guinea-pig cardiomyocytes (Liu et al. 2001) and Kir2.1 and Kir2.2 are both present in mouse and rat heart (Kubo et al. 1993; Ishihara & Hiraoka, 1994; Takahashi et al. 1994; Fiset et al. 1998; Nakamura et al. 1998; Leonoudakis et al. 2001; Zaritsky et al. 2001). However, in mammalian ventricles where IK1 is present, Kir2.1 has the highest level of transcript when compared to Kir2.2 or Kir2.3 (Brahmajothi et al. 1996; Liu et al. 2001). A recent study by Zaritsky et al. (2001) has provided clear evidence that the Kir2.1 gene is essential for IK1 in mouse ventricular myocytes. They demonstrated that ventricular myocytes isolated from the Kir2.1 knockout mouse lack a detectable IK1, indicating that Kir2.1 is the major component of IK1 in mouse. In addition, Nakamura et al. (1998) have reported that antisense oligonucleotides against Kir2.1 partially suppress IK1 in rat ventricular myocytes, also demonstrating that Kir2.1 has an essential role in IK1 in rat ventricle.
The data presented so far suggest strongly that Itail is generated by IK1, and is probably due to K+ accumulation within the t-tubule system of isolated mouse ventricular myocytes. To provide additional evidence in support of this hypothesis, we investigated the localization of Kir2.1, which is the major component of IK1 in mouse heart (Kubo et al. 1993; Ishihara & Hiraoka, 1994; Fiset et al. 1998; Zaritsky et al. 2001). Immunofluorescent localization of Kir2.1 established clearly that IK1 is preferentially localized in the t-tubule system of the mouse ventricular myocytes. Figure 8A shows that Kir2.1 immunoreactivity was predominantly in a regularly spaced arrangement of transversely oriented bands along the entire length of the cell. Double labelling was performed with anti-Kir2.1 and WGA to confirm that Kir2.1 labelling was localized to the plasma membrane. WGA was used to visualize sarcolemmal and t-tubule membranes since it binds selectively to N-acetylglucosamine and sialic acid residues of the glycocalyx (Peters et al. 1979; Wright, 1984; Takeuchi et al. 2000; Sedarat et al. 2000). Figure 8B shows that WGA clearly stained the peripheral sarcolemma, the t-tubules and the intercalated disks. Superimposition of Kir2.1 and WGA staining showed important co-localization (as visualized by the yellow coloration; Fig. 8C). Pixels with a yellow coloration were observed on the t-tubule membranes, confirming the presence of Kir2.1 in these membrane structures.
Figure 8. Immunofluorescent labelling of Kir2.1 and colocalization with wheat germ agglutinin (WGA) in mouse ventricular myocytes.
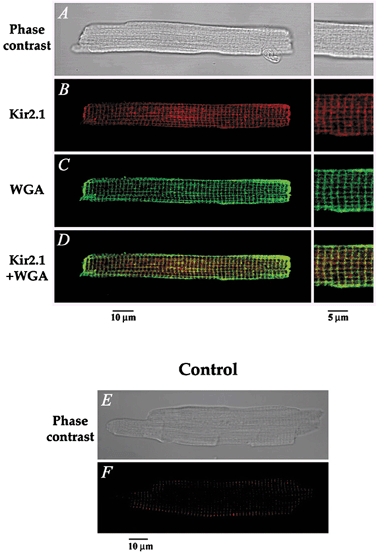
A, phase-contrast image of a mouse ventricular cell, also presented in B–D, using immunofluorescence detection. B, the red fluorescent staining indicates the presence of Kir2.1. C, the green coloration corresponds to WGA staining of the cell membrane. D, superimposition of both images shows significant colocalization (yellow) of Kir2.1 and WGA in the transverse striations, further confirming the t-tubular localization of Kir2.1. The panels on the right in A–D show a higher magnification of the cell seen on the left. E–F, negative controls showing that no staining was apparent when the primary antibody was omitted. E, phase contrast image, and F, immunofluorescence detection of the same cell.
Absence of Itail in mouse atrial myocytes
Labelling of single atrial myocytes with a Kir2.1-specific antibody revealed immunofluorescence staining at the peripheral plasma membrane (Fig. 9A) without organized fluorescence in the cell interior. The WGA labelling in mouse atrial myocytes showed no well defined t-tubule system in these cells. In fact, small invaginations from the surface corresponding to the t-tubules were observed with WGA (Fig. 9B). Those striations were not significantly labelled with the anti-Kir2.1 antibody. The localization of Kir2.1 in atrial cells was confirmed by the pattern of distribution of co-localized Kir2.1 and WGA staining, which revealed significant co-localization only at the cell periphery (Fig. 9C). Consistent with these observations were the electrophysiological data that showed that no slowly decaying, inward currents followed the depolarizing voltage-clamp steps in isolated mouse atrial myocytes (Fig. 9G).
Figure 9. No significant t-tubule localization of Kir2.1 in mouse atrial myocytes, consistent with the absence of Itail in these cells.
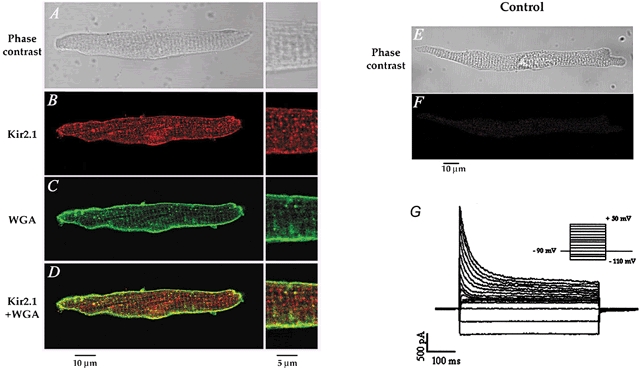
A, phase-contrast image of a mouse atrial cell. B–C, same cell as in A showing the immunofluorescence detection of Kir2.1 (B) and WGA (C). D, superimposition of the images presented in B and C, revealing little or no overlap (yellow) between Kir2.1 and WGA labelling in the t-tubules. E, phase-contrast image of the control atrial cell presented in F, showing that no immunofluorescence staining was observed when the primary antibody was omitted. G, family of currents from a voltage clamped, isolated mouse atrial myocyte. The voltage-clamp protocol is shown in the inset; the holding potential was -90 mV; 500 ms steps to potentials between -110 and +50 mV in 10 mV increments applied at 0.1 Hz.
DISCUSSION
This study provides an explanation for the slow inward Itail that follows membrane depolarization of voltage-clamped mouse ventricular myocytes. The properties of Itail suggest strongly that these currents result from the accumulation of K+ in a restricted extracellular space associated with the ventricular myocytes. K+ accumulation occurs during outward current flow through IK channels in the restricted compartment; on repolarization to more negative potentials (-80 mV), current through the K+ channels is augmented because of the elevated extracellular concentration of K+ and the shift of EK to depolarized values. The decay of Itail reflects the decline of the elevated K+ back to its resting value and results from a combination of the passive diffusion of K+ out of the restricted space plus the influx of K+ into the cytosol through IK channels.
All of the properties of Itail can be accounted for by the following model:
(1) The increase in Itail magnitude with increases in outward current measured at the end of the depolarizing step (Fig. 1 and 2). Increased Itail magnitude reflects an increased K+ accumulation, which would result from a larger outward current.
(2) The non-monotonic relationship between depolarizing step duration and Itail magnitude (Fig. 3). The K+ concentration at the end of the depolarizing step depends on a balance between influx of K+ into the restricted space through delayed rectifier channels and K+ efflux via passive diffusion. Because of the time-dependent decline in outward K+ current during a depolarizing step, due to inactivation, accumulated K+ would initially increase, then decline or possibly reach a steady state as the duration of the depolarizing voltage-clamp step is increased.
(3) Lack of effect of external Na+ and Ca2+ on Itail (Fig. 4). Neither of these ions have significant effects on IK1.
(4) Simultaneous block of Itail and IK1 by BaCl2 (Fig. 5). Since Itail is postulated to be generated by K+ influx through IK1 channels in the restricted space membranes, both of these currents must be blocked identically.
(5) The time-dependent change in the apparent reversal potential of Itail (Fig. 6). This arises because the concentration of accumulated K+ in the restricted extracellular space, and hence EK, declines with time after the end of the depolarizing voltage-clamp step.
(6) Slowed time course of decline of K+ concentrations when IK1 is removed (Fig. 7). Clearance of the restricted space occurs mainly via two processes: passive diffusion out of the space and inward current flow through IK1 channels within the space. Voltage clamping to a membrane potential where IK1 is small removes this contribution due to current flow, and only passive diffusion remains.
The accumulation phenomenon for K+ occurs in part because the outward currents in mouse myocytes are very large. However, a similar phenomenon may occur in other rodent myocytes (e.g. rat). For example, there are slow, inward Itail apparent in current records obtained in rat ventricular myocytes (Shimoni et al. 1995; Ward et al. 1995). It is likely that ‘accumulation tail currents’ would be small in myocytes from the hearts of bigger mammals, where the major outward current is due to the rapid component of the delayed rectifier (IKr), rather than large Ca2+-independent transient outward K+ current (Ito) and delayed rectifier currents, as in mouse and rat.
The most likely structures in adult mouse ventricular myocytes that could act as restricted extracellular spaces for K+ accumulation are the sarcolemmal caveolae and the t-tubule system. Adult mouse ventricular myocytes have many surface caveolae and a particularly extensive and complex t-tubule system (Forbes & Sperelakis, 1973; Forbes et al. 1984). The t-tubule system of the adult mouse ventricle comprises about 3.2 % of the volume of the myocytes. The surface density of the t-tubule system membrane of adult mouse ventricular myocytes is about 0.5 μm2μm−3: this implies that roughly 50 % of the total membrane area of adult mouse ventricular myocytes is made up of t-tubule membranes.
Using a specific antibody against Kir2.1, we have provided molecular evidence that IK1 is predominantly localized in the t-tubule system of mouse ventricular myocytes. Moreover, in adult mouse atrial cells where the t-tubule membrane system is very limited, Itail was not observed on repolarization to the holding potential. Results of immunofluorescence microscopy performed on mouse atrial myocytes, where the immunolocalization of Kir2.1 showed mainly staining to the cell periphery, are consistent with the electrophysiological data obtained in these cells. In combination, these observations provide evidence that Itail is likely to result from K+ accumulation in the t-tubule system in mouse ventricular myocytes. This is the first report of localization of IK1 (Kir2.1) in the t-tubules of mouse ventricular myocytes. Taken together, the results of this study suggest strongly that Itail in mouse ventricular myocytes is produced by the activation of inward IK1 in the t-tubules, resulting from K+ accumulation in these membrane structures.
Reports by other groups strongly support our findings. Recently, a study by Leonoudakis et al. (2001) showed that Kir2.2 is also localized in striated bands corresponding to t-tubules in rat ventricular myocytes. This finding is interesting considering that Zaritsky et al. (2001) have demonstrated that by removing the gene encoding Kir2.2, there was a 50 % reduction in IK1, suggesting that Kir2.2 can also contribute to IK1. Previous studies have shown that changes in IK1 magnitude closely correlate with the density of t-tubules in cardiomyocytes. Primary cultures of ventricular myocytes have been associated with a reduction of IK1 (Wahler, 1992; Schackow et al. 1995; Christé, 1999) and a parallel reduction in the density of t-tubules (Delcarpio et al. 1989). Christé has reported recently that cultured rabbit ventricular myocytes lose a large portion of IK1 and ATP-sensitive K+ current (IK-ATP) conductance in parallel with a decay in cell membrane capacitance (Christé, 1999). These data suggest that a major part of IK1 and IK-ATP are located in the t-tubules of rabbit ventricular myocytes, since a reduction in membrane capacitance has been attributed mainly to the disappearance of the t-tubules (Lipp et al. 1996; Mitcheson et al. 1996). In addition, using immunofluorescence and immunoelectron microscopy, Takeuchi et al. (2000) have demonstrated that Kv4.2, which generates much Ito in cardiomyocytes, is expressed mainly in the t-tubules in rat ventricular myocytes. Other studies have shown a preferential localization of ion channels to the t-tubule membrane. For instance, during the postnatal development of rabbit ventricular myocytes, it has been reported that there is a close temporal correlation between formation of the t-tubules and expression of dihydropyridine receptors (Sedarat et al. 2000). T-tubule membrane systems are well developed in mammalian ventricular myocytes and several previous studies have indicated that ion accumulation can occur within the t-tubular system in the isolated ventricular myocytes of other species. Yasui et al. (1993) recorded inward Itail in single guinea-pig ventricular myocytes after treatment of the cells with nicorandil, an activator of IK-ATP, which induced large outward currents in these myocytes. Yasui et al. interpreted their results using a similar model to that presented above; outward IK-ATP during a depolarizing step resulted in K+ accumulation in t-tubules, and the inward Itail produced on repolarization due to IK1 in the t-tubule membranes. Guinea-pig ventricular myocytes have an extensive t-tubule system, with a volume fraction of 2.5-3.2 % and a surface area density of about 0.4 μm2μm−3 (Forbes & Van Niel, 1988), similar to the mouse ventricular myocytes. Shepherd & McDonough (1998) also demonstrated slow diffusion in the t-tubules of guinea-pig ventricular myocytes. They rapidly increased [Ca2+]o around guinea-pig ventricular myocytes while measuring the time course of the increase in the amplitude of voltage-dependent Ca2+ currents (ICa). ICa increased in two phases: 30-40 % of the current change occurred with a time constant of about 20 ms, while the remainder of the change occurred 10-fold more slowly. These authors suggested that the slow component reflected the slow equilibration of [Ca2+] between the bulk solution and the lumen of the t-tubules. Yao et al. (1997) performed similar rapid solution-change experiments using adult rabbit and rat ventricular myocytes. Following a rapid (4 ms) removal of external Ca2+, ICa declined slowly in both rabbit and rat ventricular myocytes, although the rate of decline of the current in rat myocytes (t90= 910 ms, the time required for 90 % decline) was considerably slower than that in rabbit ventricular myocytes (t90= 241 ms). Changes in K+ concentration appeared to equilibrate much more rapidly with both types of cell. The time to reach a stable membrane potential after a rapid change in external K+ occurred with a t90 of 64 ms for rabbit cells and 137 ms in rat myocytes. Yao et al. (1997) suggested that sarcolemmal structures like t-tubules, surface caveolae and negatively charged proteins all contribute to the slowed diffusion of cations in myocardial cells.
In conclusion, our data, along with data from other investigators, suggest that K+ channels are localized preferentially in the t-tubules. Considering that cardiac K+ channels play very important roles in regulating both action potential duration and excitation-contraction coupling and since the t-tubule is the major site of excitation-contraction coupling in ventricular cells, this t-tubule localization is not totally unexpected. Additional studies exploring the physiological consequence of the t-tubule localization of K+ channels are required and may provide important insights into the functional role of cardiac K+ channels under physiological and pathological conditions.
Acknowledgments
This study was supported by operating grants from the Canadian Institutes of Health Research and the Heart and Stroke Foundation of Canada to R.B.C., W.R.G. and C.F., and the Fonds de la Recherche en Santé du Québec (C.F.). W.R.G. is a Medical Scientist of the Alberta Heritage Fund for Medical Research (AHMFR). C.F. and B.G.A. are Research Scholars of the Heart and Stroke Foundation of Canada. The authors are thankful to Véronique Trépanier-Boulay, Louis-Robert Villeneuve and Judith Brouillette for their expert assistance.
References
- Almers W. The decline of potassium permeablity during extreme hyperpolarization in frog skeletal muscle. Journal of Physiology. 1972;225:57–83. doi: 10.1113/jphysiol.1972.sp009929. [DOI] [PMC free article] [PubMed] [Google Scholar]
- Attwell DE, Cohen IS. The voltage clamp of multicellular preparations. Progress in Biophysics and Molecular Biology. 1977;31:201–245. doi: 10.1016/0079-6107(78)90009-3. [DOI] [PubMed] [Google Scholar]
- Attwell DE, Eisner DA, Cohen IS. Voltage clamp and tracer flux data: effects of a restricted extracellular space. Quarterly Review of Biophysics. 1979;12:213–263. doi: 10.1017/s0033583500005448. [DOI] [PubMed] [Google Scholar]
- Bers DM, Lederer WJ, Berlin JR. Intracellular Ca transients in rat cardiac myocytes: role of Na-Ca exchange in excitation-contraction coupling. American Journal of Physiology. 1990;258:C944–954. doi: 10.1152/ajpcell.1990.258.5.C944. [DOI] [PubMed] [Google Scholar]
- Bouchard RA, Clark RB, Giles WR. Role of sodium-calcium exchange in activation of contraction in rat ventricle. Journal of Physiology. 1993;472:391–413. doi: 10.1113/jphysiol.1993.sp019953. [DOI] [PMC free article] [PubMed] [Google Scholar]
- Brahmajothi MV, Morales MJ, Liu S, Rasmusson RL, Campbell DL, Strauss HC. In situ hybridization reveals extensive diversity of K+ channel mRNA in isolated ferret cardiac myocytes. Circulation Research. 1996;78:1083–1089. doi: 10.1161/01.res.78.6.1083. [DOI] [PubMed] [Google Scholar]
- Christé G. Localization of K+ channels in the t-tubules of cardiomyocytes as suggested by the parallel decay of membrane capacitance, IK1, and IKATP during culture and by delayed IK1 response to barium. Journal of Molecular and Cellular Cardiology. 1999;31:2207–2213. doi: 10.1006/jmcc.1999.1034. [DOI] [PubMed] [Google Scholar]
- Cohen IS, Kline RP. K+ fluctuations in the extracellular spaces of cardiac muscles. Circulation Research. 1982;50:1–16. [PubMed] [Google Scholar]
- Delcarpio JB, Claycomb WC, Moses RL. Ultrastructural morphometric analysis of cultured neonatal and adult rat ventricular cardiac muscle cells. American Journal of Anatomy. 1989;186:335–345. doi: 10.1002/aja.1001860403. [DOI] [PubMed] [Google Scholar]
- Egan TM, Noble D, Noble SJ, Powell T, Spindler AJ, Twist VW. Sodium-calcium exchange during the action potential in guinea-pig ventricular cells. Journal of Physiology. 1989;411:639–661. doi: 10.1113/jphysiol.1989.sp017596. [DOI] [PMC free article] [PubMed] [Google Scholar]
- Fiset C, Clark RB, Janzen KM, Winkfein R, Giles WR. Molecular identity of K+ currents in adult mouse atrium and ventricle (abstract) Biophysical Journal. 1998;74:A207. [Google Scholar]
- Fiset C, Clark RB, Larsen TS, Giles WR. A rapidly activating sustained K+ current modulates repolarization and excitation-contraction coupling in adult mouse ventricle. Journal of Physiology. 1997;504:557–563. doi: 10.1111/j.1469-7793.1997.557bd.x. [DOI] [PMC free article] [PubMed] [Google Scholar]
- Forbes MS, Hawkey LA, Sperelakis N. The transverse-axial tubular system (TATS) of mouse myocardium: its morphology in the developing and adult animal. American Journal of Anatomy. 1984;170:143–162. doi: 10.1002/aja.1001700203. [DOI] [PubMed] [Google Scholar]
- Forbes MS, Sperelakis N. A labyrinthine structure formed from a transverse tubule of mouse ventricular myocardium. Journal of Cell Biology. 1973;56:865–869. doi: 10.1083/jcb.56.3.865. [DOI] [PMC free article] [PubMed] [Google Scholar]
- Forbes MS, Van Niel EE. Membrane systems of guinea pig myocardium: ultrastructure and morphometric studies. Anatomical Record. 1988;222:362–379. doi: 10.1002/ar.1092220409. [DOI] [PubMed] [Google Scholar]
- Ishihara K, Hiraoka M. Gating mechanism of the cloned inward rectifier potassium channel from mouse heart. Journal of Membrane Biology. 1994;142:55–64. doi: 10.1007/BF00233383. [DOI] [PubMed] [Google Scholar]
- Kubo Y, Baldwin TJ, Jan YN, Jan LY. Primary structure and functional expression of a mouse inward rectifier potassium channel. Nature. 1993;362:127–133. doi: 10.1038/362127a0. [DOI] [PubMed] [Google Scholar]
- Leonoudakis D, Mailliard W, Wingerd K, Clegg D, Vandenberg C. Inward rectifier potassium channel Kir2. 2 is associated with synapse-associated protein SAP97. Journal of Cell Science. 2001;114:987–998. doi: 10.1242/jcs.114.5.987. [DOI] [PubMed] [Google Scholar]
- Lipp P, Hüser J, Pott L, Niggli E. Spatially non-uniform Ca2+ signals induced by the reduction of tansverse tubules in citrate-loaded guinea-pig ventricular myocytes in culture. Journal of Physiology. 1996;497:589–597. doi: 10.1113/jphysiol.1996.sp021792. [DOI] [PMC free article] [PubMed] [Google Scholar]
- Liu GX, Derst C, Schlichthorl G, Heinen S, Seebohm G, Bruggemann A, Kummer W, Veh RW, Daut J, Preisig-Muller R. Comparison of cloned Kir2 channels with native inward rectifier K+ channels from guinea-pig cardiomyocytes. Journal of Physiology. 2001;532:115–126. doi: 10.1111/j.1469-7793.2001.0115g.x. [DOI] [PMC free article] [PubMed] [Google Scholar]
- Mitcheson JS, Hancox JC, Levi AJ. Action potentials, ion channel currents and transverse tubule density in adult rabbit ventricular myocytes maintained for 6 days in cell cultures. Pflügers Archiv. 1996;431:814–827. doi: 10.1007/s004240050073. [DOI] [PubMed] [Google Scholar]
- Nakamura TY, Artman M, Rudy B, Coetzee WA. Inhibition of rat ventricular IK1 with antisense oligonucleotides targeted to Kir2. 1 mRNA. American Journal of Physiology. 1998;274:H892–900. doi: 10.1152/ajpheart.1998.274.3.H892. [DOI] [PubMed] [Google Scholar]
- Nerbonne JM. Molecular basis of functional voltage-gated K+ channel diversity in the mammalian myocardium. Journal of Physiology. 2000;525:285–298. doi: 10.1111/j.1469-7793.2000.t01-1-00285.x. [DOI] [PMC free article] [PubMed] [Google Scholar]
- Peters BP, Ebisu S, Goldstein IJ, Flashner M. Interaction of wheat germ agglutinin with sialic acid. Biochemistry. 1979;18:5505–5511. doi: 10.1021/bi00591a038. [DOI] [PubMed] [Google Scholar]
- Schackow TE, Decker RS, Ten Eick RE. Electrophysiology of adult cat cardiac ventricular myocytes: changes during primary culture. American Journal of Physiology. 1995;268:C1002–C1017. doi: 10.1152/ajpcell.1995.268.4.C1002. [DOI] [PubMed] [Google Scholar]
- Sedarat F, Xu L, Moore EDW, Tibbits GF. Colocalization of dihydropyridine and ryanodine receptors in neonate rabbit heart using confocal microscopy. American Journal of Physiology - Heart and Circulation Physiology. 2000;279:H202–209. doi: 10.1152/ajpheart.2000.279.1.H202. [DOI] [PubMed] [Google Scholar]
- Shepherd N, McDonough HB. Ionic diffusion in transverse tubules of cardiac ventricular myocytes. American Journal of Physiology. 1998;275:H852–860. doi: 10.1152/ajpheart.1998.275.3.H852. [DOI] [PubMed] [Google Scholar]
- Shimoni Y, Severson D, Giles WR. Thyroid status and diabetes modulate regional differences in potassium currents in rat ventricle. Journal of Physiology. 1995;488:673–688. doi: 10.1113/jphysiol.1995.sp020999. [DOI] [PMC free article] [PubMed] [Google Scholar]
- Takahashi N, Morishige K, Jahangir A, Yamada M, Findlay I, Koyama H, Kurachi Y. Molecular cloning and functional expression of cDNA encoding a second class of inward rectifier potassium channels in the mouse brain. Journal of Biological Chemistry. 1994;269:23274–23279. [PubMed] [Google Scholar]
- Takeuchi S, Takagishi Y, Yasui K, Murata Y, Toyama J, Kodama I. Voltage-gated K+ channel, Kv4.2, localizes predominantly to the transverse-axial tubular system of the rat myocyte. Journal of Molecular and Cellular Cardiology. 2000;32:1361–1369. doi: 10.1006/jmcc.2000.1172. [DOI] [PubMed] [Google Scholar]
- Trépanier-Boulay V, St-Michel C, Tremblay A, Fiset C. Gender-based differences in cardiac repolarization in mouse ventricle. Circulation Research. 2001;89:437–444. doi: 10.1161/hh1701.095644. [DOI] [PubMed] [Google Scholar]
- Wahler GM. Developmental increases in the inwardly rectifying potassium current of rat ventricular myocytes. American Journal of Physiology. 1992;262:C1266–1272. doi: 10.1152/ajpcell.1992.262.5.C1266. [DOI] [PubMed] [Google Scholar]
- Ward CA, Ma Z, Lee SS, Giles WR. Potassium currents in atrial and ventricular myocytes from a rat model of cirrhosis. American Journal of Physiology. 1995;273:G537–544. doi: 10.1152/ajpgi.1997.273.2.G537. [DOI] [PubMed] [Google Scholar]
- Wright CS. Structural comparison of the two distinct sugar binding sites in wheat germ agglutinin isolectin II. Journal of Membrane Biology. 1984;178:91–104. doi: 10.1016/0022-2836(84)90232-8. [DOI] [PubMed] [Google Scholar]
- Yao A, Spitzer KW, Ito N, Zaniboni M, Lorell BH, Barry WH. The restriction of diffusion of cations at the external surface of cardiac myocytes varies between species. Cell Calcium. 1997;22:431–436. doi: 10.1016/s0143-4160(97)90070-1. [DOI] [PubMed] [Google Scholar]
- Yasui K, Anno T, Kamiya K, Boyett MR, Kodama I, Toyama J. Contribution of potassium accumulation in narrow extracellular spaces to the genesis of nicorandil-induced large inward tail current in guinea-pig ventricular cells. Pflügers Archiv. 1993;422:371–379. doi: 10.1007/BF00374293. [DOI] [PubMed] [Google Scholar]
- Zaritsky JJ, Redell JB, Tempel BL, Schwarz TL. The consequences of disrupting cardiac inwardly rectifying K+ current (IK1) as revealed by the targeted deletion of the murine Kir2. 1 and Kir2.2 genes. Journal of Physiology. 2001;533:697–710. doi: 10.1111/j.1469-7793.2001.t01-1-00697.x. [DOI] [PMC free article] [PubMed] [Google Scholar]