

Abstract
This study was carried out to test the hypothesis that the greater fat oxidation observed during exercise after adaptation to a high-fat diet is due to an increased uptake of fat originating from the bloodstream.
Of 13 male untrained subjects, seven consumed a fat-rich diet (62% fat, 21% carbohydrate) and six consumed a carbohydrate-rich diet (20% fat, 65% carbohydrate). After 7 weeks of training and diet, 60 min of bicycle exercise was performed at 68 ± 1% of maximum oxygen uptake. During exercise [1-13C]palmitate was infused, arterial and venous femoral blood samples were collected, and blood flow was determined by the thermodilution technique. Muscle biopsy samples were taken from the vastus lateralis muscle before and after exercise.
During exercise, the respiratory exchange ratio was significantly lower in subjects consuming the fat-rich diet (0.86 ± 0.01, mean ±s.e.m.) than in those consuming the carbohydrate-rich diet (0.93 ± 0.02). The leg fatty acid (FA) uptake (183 ± 37 vs. 105 ± 28 μmol min−1) and very low density lipoprotein-triacylglycerol (VLDL-TG) uptake (132 ± 26 vs. 16 ± 21 μmol min−1) were both higher (each P < 0.05) in the subjects consuming the fat-rich diet. Whole-body plasma FA oxidation (determined by comparison of 13CO2 production and blood palmitate labelling) was 55-65% of total lipid oxidation, and was higher after the fat-rich diet than after the carbohydrate-rich diet (13.5 ± 1.2 vs. 8.9 ± 1.1 μmol min−1 kg−1; P < 0.05). Muscle glycogen breakdown was significantly lower in the subjects taking the fat-rich diet than those taking the carbohydrate-rich diet (2.6 ± 0.5 vs. 4.8 ± 0.5 mmol (kg dry weight)−1 min−1, respectively; P < 0.05), whereas leg glucose uptake was similar (1.07 ± 0.13 vs. 1.15 ± 0.13 mmol min−1).
In conclusion, plasma VLDL-TG appears to be an important substrate source during aerobic exercise, and in combination with the higher plasma FA uptake it accounts for the increased fat oxidation observed during exercise after fat diet adaptation. The decreased carbohydrate oxidation was apparently due to muscle glycogen sparing and not to diminished plasma glucose uptake.
Consumption of a fat-rich diet over both the short term (Krogh & Lindhard, 1920; Christensen & Hansen, 1939) and longer term (Phinney et al. 1983; Helge et al. 1996) will lead to an increase in fat oxidation during exercise. This change is facilitated by both an increase in lipolysis, thus a higher plasma fatty acid (FA) response during exercise (Phinney et al. 1983), and concurrent decreases in the glycogen stores in muscle (Phinney et al. 1983) and liver (Hultman & Nilsson, 1971). In addition, longer-term adaptation to a fat-rich diet also leads to measurable changes in the capacity to recruit, transport and oxidize fat (Fisher et al. 1983; Kiens et al. 1987; Helge & Kiens, 1997). In a recent study, Schrauwen and colleagues (Schrauwen et al. 2000b) applied a stable isotope tracer technique to investigate the substrate utilization after 7 days adaptation to either a fat- or a carbohydrate-rich diet. In their study, plasma FA oxidation was similar between diets; it was therefore concluded that the higher fat oxidation (190 %) observed during exercise at 50 % maximum power output (Wmax) after the fat-rich diet was derived from muscle and/or plasma triacylglycerol. However, the importance of the contribution from muscle triacylglycerol during exercise remains controversial. In several studies it was not possible to demonstrate directly muscle triacylglycerol utilization during exercise (Standl et al. 1980; Kiens et al. 1993; Kiens & Richter, 1998), whereas in others a significant breakdown of approximately 20-35 % was reported (Carlson et al. 1971; Essen et al. 1977; Phillips et al. 1996). Nevertheless, muscle triacylglycerol storage can be increased by long-term consumption of a high-fat diet (Kiens et al. 1987; Helge et al. 1998) and decreased by a low-fat diet (Starling et al. 1997; Coyle et al. 2001). These findings might imply that muscle triacylglycerol plays a role in the increased fat oxidation observed after consuming a fat-rich diet. However, Kiens & Richter (1998) only observed a significant muscle triacylglycerol breakdown during recovery from exercise, with no breakdown occurring during the exercise itself. These results suggest that a more important role for muscle triacylglycerol is delivery of substrate during recovery from exercise, rather than during exercise per se. This would imply that during exercise, the utilization of plasma-derived triacylglycerol, but not muscle triacylglycerol, is increased after adaptation to a fat-rich diet, which is consistent both with our previously observed increase in lipoprotein lipone activity during a fat-rich diet (Kiens et al. 1987) and the utilization of very low density lipoprotein-triacylglycerol (VLDL-TG) across a trained leg during one-leg exercise (Kiens et al. 1993).
The aim of the study presented here was to investigate substrate metabolism during exercise in the whole body and across the exercising leg in two situations in which the pattern of fuel utilization was markedly different. The hypothesis was that the increased fat oxidation that occurs during exercise after adaptation to a fat-rich diet would be due primarily to a higher uptake of fat from the blood, and only to a minor extent to an increase in muscle triacylglycerol utilization.
METHODS
Subjects
Thirteen untrained healthy male subjects, mean age 27 years (range 22-32 years), height 182 cm (171-196 cm), weight 87 kg (76-108 kg) and maximal oxygen uptake 3.9 l O2 min−1 (3.5-4.8 l O2 min−1) participated in the study. The fibre-type composition in the vastus lateralis muscle was 55 ± 3 % type I, 34 ± 2 % type IIA and 11 ± 2 % type IIX fibres (type IIB in old nomenclature). Subjects were fully informed of the nature and the possible risks associated with the study and gave their written consent to participate. The study was approved by the Copenhagen Ethics Committee.
Design
Initially, subjects were assigned randomly to one of two groups. Over a period of 7 weeks, the two groups followed an identical training program (see below) but consumed either a fat-rich diet (n = 7) or a carbohydrate-rich diet (n = 6). After 7 weeks of diet plus training, substrate kinetics and metabolism were investigated over 60 min of exercise performed at 68 % of maximal oxygen uptake on a modified Krogh bicycle ergometer. Over the experimental period, maximal oxygen uptake was determined before, and after 3.5 and 6.5 weeks of the diet-exercise regime.
Experimental diets
To establish the daily energy intake and composition of the subjects’ habitual diet, 4 day diet records were kept by all subjects (3 weekdays and 1 weekend day). Food and beverage intakes were weighed and recorded, and the composition and energy intake of the diets were calculated using a database (Dankost 2000, Danish Catering Centre, Copenhagen, Denmark). In addition, individual energy intakes were determined from the World Health Organization's equation for the calculation of energy needs (World Health Organization, 1985). Two experimental diets were designed, one rich in fat and the other rich in carbohydrate (Table 1). The average energy composition of the fat-rich diet was 21 % carbohydrate, 17 % protein and 62 % fat. The energy composition of the carbohydrate-rich diet was 65 % carbohydrate, 15 % protein and 20 % fat (Table 1). The two diets were designed to be markedly different in fat and carbohydrate content, and as similar as possible in protein content and the ratio of polyunsaturated to saturated FAs (P:S ratio, Table 1). Isocaloric, 7 day cycle menus were designed for each subject's individual energy utilization, and the day-to-day variation was kept as low as possible. On the training days the calculated energy expenditure was added to the daily energy intake. The intake during the dietary periods was well controlled, and food items (e.g. maize-derived carbohydrates and drinks containing maize sugar) containing a high ratio of 13C:12C were avoided. All food and beverages were weighed to within 1 g. The diets were prepared by the subjects and all meals were consumed at home. The subjects were asked to register all food intake and any omissions from the prescribed food intake. Every 2nd day, subjects returned their dietary consumption records and then responded to a few questions, which were addressed to secure the best possible dietary control. The subjects weighed themselves every morning and their individual calculated energy intake was adjusted according to any change in body weight.
Table 1.
The dietary content of the prescribed diets and the daily habitual and experimental dietary energy and nutrient intake
| Habitual diet | Experimental diet | |||
|---|---|---|---|---|
| FAT | CHO | FAT | CHO | |
| Energy (MJ) | 13.3 ± 0.8 | 13.9 ± 0.9 | 14.7 ± 0.6* | 15.2 ± 0.8* |
| Protein (E %) | 14.0 ± 0.4 | 13.0 ± 0.7 | 16.9 ± 0.2* | 14.5 ± 0.4* |
| Protein (g) | 109 ± 7 | 105 ± 7 | 144 ± 5*† | 131 ± 7* |
| Carbohydrate (E %) | 54.2 ± 3.5 | 52.4 ± 3.7 | 21.6 ± 0.2*† | 65.0 ± 0.4* |
| Carbohydrate (g) | 424 ± 35 | 426 ± 33 | 185 ± 7*† | 581 ± 32* |
| Fat (E %) | 29.1 ± 3.0 | 29.9 ± 3.0 | 61.7 ± 0.2*† | 20.0 ± 0.1* |
| Fat (g) | 102 ± 12 | 111 ± 15 | 240 ± 9*† | 80 ± 4* |
| P:S ratio | 0.50 ± 0.12 | 0.34 ± 0.07 | 0.61 ± 0.01*† | 0.53 ± 0.02* |
E % is the content of nutrient in relation to the total energy in the diet. Values are means ±s.e.m. The subjects' daily habitual diet was calculated from a 4 day dietary record, and their daily experimental diet intake was calculated from 7 week dietary diaries. FAT, fat-rich diet; CHO, carbohydrate-rich diet; P:S ratio, ratio between polyunsaturated and saturated fatty acids.
P < 0.05, experimental diet vs. habitual diet
P < 0.05, FAT vs. CHO.
Materials
[1-13C]Palmitate (99 % enriched) and NaH13CO3 (99 % enriched) were purchased from Tracer Technologies (Newton, MA, USA). The palmitic acid tracer in solution was added to methanolic potassium hydroxide to form the potassium salt, dried under nitrogen, redissolved in sterile water, passed through a 0.22 μm sterile filter and added, and thereby complexed, to sterile 20 % (w/v) human albumin (State Serum Institute, Copenhagen, Denmark).
Experimental protocol
Subjects refrained from physical activity for 2 days before the studies. The subjects reported to the laboratory in the morning after a 12 h fast. After 30 min rest in a supine position, a needle biopsy sample was taken (using the suction technique) from the vastus lateralis muscle, using 1 % lidocaine to provide local anaesthesia (Bergström, 1962). After this, the training and diet regimen was begun. Over 7 weeks, the two dietary groups followed an identical, supervised training programme. During the whole period, bicycle training was performed four times a week and each training session lasted 60-75 min. The weekly program was repeated seven times and consisted of four different sessions, always initiated with a 10 min warm up and ending with a 5-10 min cooling down period. In the main part of each exercise session, set periods of exercise of varying duration and intensity (from 65-85 % of maximal oxygen uptake) were performed, interspersed with breaks of active recovery at 50 % of maximal oxygen uptake. The training intensity was adjusted to match measured changes in maximal oxygen uptake after 3.5 weeks of training. At every training session, heart rate was monitored, pulmonary oxygen uptake was measured frequently, and thus the training intensity adjusted accordingly.
After 7 weeks subjects again reported to the laboratory, following an overnight fast, having not trained for 2 days. After 30 min of rest in the supine position, Teflon catheters were placed into the femoral artery and vein under local anaesthesia by aseptic technique, and the tips were advanced to ∼2 cm below and above the inguinal ligament, respectively. A thermistor probe (Edslab Probe 94-030-2.5-F, Baxter Healthcare) for measuring venous blood temperature was advanced 8 cm proximal to the catheter tip. A catheter was also inserted into an antecubital vein for the infusion of stable isotope tracer. The catheters were flushed with sterile sodium citrate at a concentration of ∼3.6 mmol l−1. A needle biopsy sample was obtained from the vastus lateralis muscle, as described above. Subjects were then taken to the experimental room and placed in a semi-supine resting position, where they rested for 0.5 h. Thereafter, blood was sampled simultaneously from the femoral artery and vein; femoral venous blood flow was measured using the thermodilution method by administering a bolus injection of 3 ml ice-cold saline (Andersen & Saltin, 1985); the average of three sequential determinations was used. In this period, resting oxygen uptake was measured and samples of breath were collected for measurement of background enrichment. At this point, the bicarbonate pool was primed with a bolus of NaH13CO3 (0.1 mg kg−1), and a continuous infusion of [1-13C]palmitate was started at a rate of 0.06 μmol kg−1 min−1 using a calibrated syringe pump (Vial Medical SE 200B, Simonsen & Weel, Copenhagen, Denmark). Blood sampling was performed after 50, 55 and 60 min. Subjects were then positioned on the Krogh cycle ergometer, and exercise was begun, without a prior warm-up, at 68 % of maximal oxygen uptake. During the 60 min of exercise arterial and venous blood samples were taken at 15, 30, 45 and 60 min. Blood was transferred into EDTA-containing tubes, EGTA-containing tubes or dry tubes depending on the analysis to be performed. Prior to each blood sampling, venous blood flow was measured via continuous infusions of ice-cold saline, according to the thermodilution principle (Andersen & Saltin, 1985). At the same time, expired air was sampled into Douglas bags and small aliquots were collected subsequently into evacuated glass tubes (Vacutainer, Becton Dickinson, Meylan, Cedex, France) for the analysis of 13CO2 enrichment. During exercise, heart rate was recorded continuously with a PE 3000 Sports Tester (Polar Electro, Finland). Throughout exercise, water intake was standardized with subjects drinking 200 ml of water every 20 min. Immediately after exercise, a biopsy sample was taken from the vastus lateralis muscle.
Analyses
FAs were extracted from the plasma, isolated by thin-layer chromatography and converted to their methyl esters. The arterial and venous isotopic enrichment of plasma [1-13C]palmitate was determined by gas chromatography-mass spectrometry (GC-MS, INCOS XL, Finnigan Mat, Hemel Hempstead, UK) by selected-ion-monitoring of ions at a mass:charge ratio (m:z) of 270 and 271. Heptadecanoate (C17) was used as an internal standard for the quantification of total palmitate. The enrichment of 13CO2 in expired air was analysed by isotope ratio-mass spectrometry (IRMS; Europa Scientific 2020 IRMS), as described previously by Scrimgeour & Rennie (1988). The concentration of isotope in the infusate was determined so that the exact infusion rate could be calculated.
Blood glucose and lactate concentrations were measured on a glucose and lactate analyser, respectively (Yellow Springs Instruments, Yellow Springs, OH, USA). Plasma glycerol was analysed enzymatically, as described by Wieland (1974). Plasma FA was measured fluorometrically (Kiens et al. 1993). Serum VLDL-TG (density 1.006 g cm−3) was isolated by ultracentrifugation and then analysed as described by Kiens & Lithell (1989). Levels of the arterial plasma marker were determined using a radio immunoassay kit (Insulin RIA100, Pharmacia, Sweden); catecholamines in arterial plasma were determined by a radioenzymatic procedure (Christensen et al. 1980). Blood oxygen saturation was measured on an OSM-3 hemoximeter (Radiometer, Copenhagen, Denmark). Haemoglobin was determined spectrophotometrically on the hemoximeter by the cyan-methaemoglobin method (Drabkin & Austin, 1935). PCO2, PO2 and pH were measured by the Astrup technique (ABL 30, Radiometer). Haematocrit was determined in triplicate from microcapillary tubes.
The biopsy samples were frozen in liquid nitrogen within 10-15 s of sampling. Before freezing, a section of the samples was cut off, mounted in embedding medium and frozen in isopentane that had been cooled in liquid nitrogen. Both parts of the biopsy sample were stored at -80 °C until further analysis. Before biochemical analysis, muscle biopsy samples were freeze-dried and dissected free of connective tissue, visible fat and blood using a stereomicroscope. Muscle glycogen content was determined as glucose residues after hydrolysis of the muscle sample in 1 m HCl at 100 °C for 2 h (Lowry & Passonneau, 1972). Muscle triacylglycerol content was determined as described previously (Kiens & Richter, 1996). To identify fibre types, serial transverse muscle sections were stained for myofibrillar ATPase (Brooke & Kaiser, 1970).
Pulmonary oxygen uptake and carbon dioxide excretions at rest and during exercise were determined by collection of expired air in Douglas bags. The volume of air was measured in a Collins bell-spirometer (Tissot principle, Collins, Braintree, MA, USA) and the fractions of oxygen and carbon dioxide were determined with paramagnetic (Servomex) and infrared (Beckmann LB-2) systems, respectively. Gases of known composition were used to calibrate each system regularly.
Calculations
The uptake and release of substrates and metabolites across the leg were calculated from femoral arterial and venous differences multiplied by plasma or blood flow, according to Fick's principle. The oxygen and carbon dioxide content in the blood was calculated (Siggaard-Andersen et al. 1988), and from this the respiratory quotient (RQ) across the leg was calculated. Indirect calorimetry calculations were performed according to the stoichiometric equations given by Frayn (1983). To assess the protein oxidation, a nitrogen excretion rate was set at 135 μg kg−1 min−1, as described by Romijn et al. (1993). Total FA oxidation was calculated by converting the rate of triacylglycerol oxidation (g kg−1 min−1) to its molar equivalent, assuming the average molecular weight of triacylglycerol to be 860 g mol−1 (Frayn, 1983).
Calculations of the whole-body rate of appearance (Ra), and when appropriate the rate of disappearance (Rd), were performed using Steele's non-steady-state equations (Steele, 1959) modified for the use of stable isotope tracer infusion, as described previously (Romijn et al. 1993; Coyle et al. 1997). The Ra of FAs was determined as the product between the fractional contribution of palmitate to the total FA concentration and the Ra of palmitate. The percentage of the tracer infused that was oxidized was calculated as:
where F13CO2 is the content of 13CO2 in the breath (ECO2×VCO2, where ECO2 is the enrichment of 13CO2 andVCO2 is the excretion of CO2 in breath), and C is the correction factor (C = 0.9) reported by Sidossis et al. (1995). The correction factor was included to account for the loss of 13CO2 label in the breath due to fixation at any step between the entrance of labelled acetyl-CoA into the tricarboxylic acid cycle and recovery in the breath. Due to practical concerns we chose not to do an acetate-recovery experiment or a natural background study, since this would involve waiting until the training and diet effects had subsided and then repeating the 7 weeks of training and diet intervention.
The natural background for 13C for persons consuming a Western European diet is very low (Lacroix et al. 1973; Schoeller et al. 1980). Furthermore, as exercise did not lead to an increase in the 13CO2 background enrichment in two groups of subjects from similar Western European populations (Wagenmakers et al. 1993; Tanis et al. 2000), the lack of a background correction study is of minor concern.
To circumvent the lack of an acetate trial to determine the individual acetate-13CO2 recovery factors (Schrauwen et al. 2000a), an average acetate correction factor derived from the literature was applied. This of course cannot account for the individual differences in acetate recovery, but to the best of our knowledge variations in individual acetate recovery become of lesser importance when exercise at moderate and high intensity is performed compared to exercise at low intensity or rest (Van Hall, 1999). Furthermore, Schrauwen et al. (1999) demonstrated similar acetate recovery values during 1 h of exercise at 50 % maximal oxygen uptake after short-term adaptation to a fat-rich or carbohydrate-rich diet. This indicates that diet hardly affects the acetate recovery factor, and we feel that our data and interpretations are therefore likely to be robust.
The plasma FA oxidation was determined as:
The estimated oxidation of FAs originating from sources other than plasma FAs was calculated as:
FA kinetics across the exercising leg:
where Cpalm,art and Cpalm,vein are the concentrations of palmitate, and Epalm,art and Epalm,vein are the enrichments of [1-13C]palmitate in the plasma of the femoral artery and vein, respectively. The calculated tracer-derived fractional extraction was used to calculate actual tracer-determined FA uptake across the leg:
Subsequently, leg FA release was calculated:
Statistics
Results are given as means ±s.e.m., unless stated otherwise. Two-way ANOVA with repeated measures for the time factor was performed to test for changes due to diet and/or time. In the case of significant main effects or interactions, Student-Newman-Keuls post hoc test was performed to discern statistical differences. However, whole-body stable isotope calculations (Table 2) were compared by Student's t test. In all cases, a probability (P) value of 0.05 was taken as the level of statistical significance.
Table 2.
Whole-body stable isotope calculations
| Time | Group | R | Total fat oxidation (μ mol min−1 kg−1) | Ra,FA (μmol min−1 kg−1) | Rd,FA (μmol min−1 kg−1) | Plasma FA oxidation (μmol min−1 kg−1) | Oxidation of FA non-plasma FA (μmol min−1 kg−1) | FA oxidized (%) |
|---|---|---|---|---|---|---|---|---|
| 30–45 min | FAT | 0.86 ± 0.01* | 25.8 ± 2.4* | 18.1 ± 2.5* | 20.2 ± 2.5* | 13.8 ± 1.2* | 11.3 ± 2.7* | 70 ± 4 |
| CHO | 0.93 ± 0.02 | 13.7 ± 2.9 | 11.3 ± 2.3 | 13.3 ± 2.5 | 8.9 ± 1.2 | 4.8 ± 3.2 | 70 ± 7 | |
| 45–60 min | FAT | 0.86 ± 0.01* | 25.7 ± 3.3* | 20.4 ± 2.1* | 19.3 ± 1.0* | 13.1 ± 1.2* | 12.5 ± 3.8* | 69 ± 6 |
| CHO | 0.93 ± 0.02 | 13.9 ± 2.8 | 12.8 ± 2.1 | 12.5 ± 3.4 | 9.0 ± 0.8 | 4.9 ± 3.3 | 73 ± 7 |
All variables represent data averaged over 30–45 min or 45–60 min of exercise, and values are means ±s.e.m. FA, fatty acid; Ra,FA, whole-body rate of appearance of FA; Rd,FA, whole-body rate of disappearance of FA; R, respiratory exchange ratio. Ra,FA and Rd,FA were calculated according to Steele's non-steady-state equations (see Methods).
P < 0.05, FAT vs. CHO.
RESULTS
The habitual dietary energy and nutrient intake was similar in the two groups (Table 1). Over the experimental period, energy intakes were also similar in the two groups, and 10% higher than the habitual daily energy intake (P < 0.05). The subjects adhered to the prescribed dietary intake (Table 1). Over the experimental period, the daily intake of carbohydrates was equivalent to 43 and 136% of the subjects’ habitual intake during consumption of the fat-rich and the carbohydrate-rich diets, respectively. The daily intake of fat was 135% higher in the fat-rich diet and 29% lower in the carbohydrate-rich diet compared to the habitual diet (P < 0.05). In the fat-rich and the carbohydrate-rich diets, the daily protein intake was increased by 32% and 25%, respectively, above the habitual dietary intake (P < 0.05). Over the experimental period, body weight decreased to a similar extent in the two groups (from 87.4 ± 2.9 to 86.3 ± 2.9 kg; P < 0.05).
On average, the subjects trained 28 ± 1 times. Before the experimental period, maximal oxygen uptake was similar in the two groups (3.8 ± 0.1 and 4.1 ± 0.2 l O2 min−1), and after training it was increased to a similar extent in each group (4.1 ± 0.1 and 4.4 ± 0.2 l O2 min−1).
After 7 weeks, the subjects exercised at an oxygen uptake level of 2.9 ± 0.1 l min−1, which was equivalent to a workload of 69 ± 3 and 67 ± 2% of maximal oxygen uptake in the fat- and carbohydrate-fed groups, respectively. Over the first 15 min of exercise, heart rate increased from resting levels to 148 ± 7 and 146 ± 2 beats min−1, whereafter a progressive increase to 174 ± 5 and 160 ± 4 beats min−1 was observed in the fat-fed and the carbohydrate-fed groups, respectively (P < 0.05). Throughout exercise, heart rate was significantly higher after fat feeding than after carbohydrate feeding (P < 0.05). During exercise, respiratory exchange ratio (R) values remained constant and were significantly lower in the fat-fed (0.86 ± 0.01) than in the carbohydrate-fed subjects (0.93 ± 0.02; Table 2).
Metabolites in blood
Prior to the exercise, resting leg blood flow was similar in the two groups after the fat-rich and the carbohydrate-rich diets (0.29 ± 0.04 and 0.36 ± 0.04 l min−1, respectively). Blood flow increased to the same extent during the first 15 min of exercise (to 6.0 ± 0.2 l min−1 after the fat-rich diet and 6.3 ± 0.3 l min−1 after the carbohydrate-rich diet; P < 0.05). Thereafter, no further increases were observed. During exercise, the leg RQ was lower after the fat-rich diet than after the carbohydrate-rich diet (Table 3).
Table 3.
FA uptake, extraction and arterial concentration measured by traditional arterio-venous balance or stable isotope methodology
| FAT | CHO | |
|---|---|---|
| Leg RQ | 0.87 ± 0.02* | 0.91 ± 0.03 |
| Net leg FA uptake (μmol min−1) | 183 ± 37* | 105 ± 28 |
| Tracer-derived leg FA uptake (μmol min−1) | 368 ± 74 | 292 ± 44 |
| FA release (μmol min−1) | 185 ± 49 | 186 ± 35 |
| Net leg FA extraction (%) | 11 ± 3 | 8 ± 3 |
| Tracer-calculated fractional extraction (%) | 20 ± 10 | 24 ± 7 |
Tracer data are averaged over the last 30 min of exercise. Values are means ±s.e.m. RQ: respiratory quotient.
P < 0.05, FAT vs. CHO.
After the fat-rich diet, arterial blood glucose concentration increased progressively and continuously up to 60 min of exercise (P < 0.05), whereas after the carbohydrate-rich diet it remained similar to the resting value throughout the entire exercise period (Fig. 1). Glucose uptake across the leg increased similarly and progressively in the two groups from rest to the end of exercise (Fig. 1, P < 0.05). Arterial blood lactate concentration increased to the same extent from rest to 15 min of exercise in the two groups, but did not change thereafter (Table 4). Lactate release during exercise was hardly different in the fat- and carbohydrate-fed groups; nevertheless, the time-diet interaction approached significance (P = 0.08, two-way ANOVA), indicating a higher lactate release after carbohydrate feeding over the first 30 min of exercise.
Figure 1. Effects of training and diet on arterial blood glucose concentration and glucose uptake across the leg.
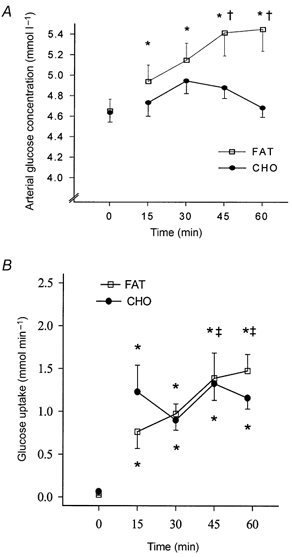
Arterial blood glucose concentration (A) and glucose uptake (B) across the leg at rest (time = 0 min) and during 60 min of exercise after 7 weeks of training and adaptation to either a fat-rich diet (FAT, □) or a carbohydrate-rich diet (CHO, •). Values are means ±s.e.m. *P < 0.05 compared to resting values; †P < 0.05 compared to CHO; ‡P < 0.05 compared to 30 min values.
Table 4.
A rterial substrate and metabolite concentrations and uptake/release at rest and during bicycle exercise
| Rest (0 min) | 15 min | 30 min | 45 min | 60 min | ||||||
|---|---|---|---|---|---|---|---|---|---|---|
| FAT | CHO | FAT | CHO | FAT | CHO | FAT | CHO | FAT | CHO | |
| Blood lactate | ||||||||||
| Arterial | 0.4 ± 0.1 | 0.6 ± 0.1 | 1.9 ± 0.3* | 2.0 ± 0.4* | 1.7 ± 0.2* | 1.8 ± 0.3* | 2.2 ± 0.3* | 1.9 ± 0.4* | 2.6 ± 0.5* | 1.8 ± 0.3* |
| A-V release | 19 ± 7 | 6 ± 12 | 432 ± 170* | 938 ± 253* | 119 ± 193 | 876 ± 285 | −49 ± 232 | −62 ± 250 | −136 ± 265 | −261 ± 234 |
| Plasma glycerol | ||||||||||
| Arterial | 56 ± 7† | 40 ± 7 | 147 ± 23*† | 65 ± 6 | 221 ± 21*† | 94 ± 14* | na | na | 288 ± 18*† | 116 ± 20* |
| A-V release | 11 ± 7 | 4 ± 2 | 46 ± 26* | 10 ± 7* | 38 ± 30* | 17 ± 32* | na | na | 41 ± 23* | 31 ± 23* |
| VLDL-TG | ||||||||||
| Arterial | 0.36 ± 0.09 | 0.70 ± 0.21 | na | na | 0.48 ± 0.10* | 0.75 ± 0.22 | na | na | 0.32 ± 0.08 | 0.70 ± 0.20 |
| A-V uptake | 13 ± 8† | 3 ± 3 | na | na | 330 ± 75*† | 57 ± 58* | na | na | 54 ± 58† | −11 ± 56 |
Leg uptake and release were calculated by Fick's principle from the arterio-venous (A-V) difference multiplied by the blood or plasma flow, respectively. Data are presented as means ±s.e.m. (Arterial, mmol l−1; A-V release, μmol min−1). na, not analysed; VLDL-TG, very low density lipoprotein-triacylglycerol.
P < 0.05, values different from Rest;
P < 0.05, values different from other diet.
At rest and throughout exercise, arterial plasma FA concentration was significantly higher after the fat-rich than after the carbohydrate-rich diet (P < 0.05, Fig. 2). The arterial plasma FA concentration was lowest after 15 min of exercise in both groups, after which time it increased to a plateau at 30 min in the fat-fed group (P < 0.05), where it remained until the end of the exercise bout. In contrast, the arterial plasma FA in the carbohydrate-fed group increased continuously from 15 min until the end of exercise (Fig. 2). At rest and after 15 min of exercise, plasma net FA uptake across the leg was similar in the two groups. After 30 min of exercise, plasma net FA uptake was significantly increased after the fat-rich diet, and the FA uptake was higher than after the carbohydrate-rich diet (P < 0.05, Fig. 2). Plasma net FA uptake did not increase further in the fat-fed group, whereas a significant increase was present after 60 min of exercise compared to that observed after 30 min of exercise in the carbohydrate-fed group (Fig. 2). Over the exercise period, mean net plasma FA uptake across the leg was significantly higher in the fat-fed (183 ± 37 μmol min−1) than in the carbohydrate-fed subjects (105 ± 28 μmol min−1; P < 0.05). In total, the mean net leg extraction of FAs was 11.3 ± 2.9 and 8.1 ± 2.9 % after the fat-rich and the carbohydrate-rich diets, respectively.
Figure 2. Effects of training and diet on arterial fatty acid (FA) concentration and net FA uptake across the leg.
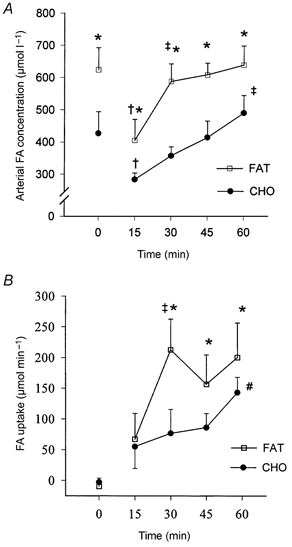
Arterial plasma FA concentration (A) and net FA uptake across the leg (B) at rest and during exercise after 7 weeks of training and adaptation to either a FAT (□) or a CHO (•) diet. Values are means ±s.e.m. *P < 0.05 compared to CHO; †P < 0.05 compared to rest; ‡P < 0.05 compared to 15 min values; #P < 0.05 compared to 30 min values.
The arterial plasma glycerol concentration increased continuously from rest until 60 min of exercise in the fat-fed subjects (P < 0.05), and was at all times higher in the fat-fed than in the carbohydrate-fed group (Table 4; P < 0.05). Arterial plasma glycerol concentration was only significantly increased after 30 min of exercise in the carbohydrate-fed group, and no further increases were observed. The plasma glycerol release across the leg was significantly increased after 15 min of exercise, and this rate was maintained throughout the exercise bout (Table 4). We could find no significant differences in glycerol release across the leg between the two groups.
The arterial serum VLDL-TG concentration was significantly increased after 30 min of exercise in the fat-fed subjects, whereas it remained unchanged throughout the exercise in the carbohydrate-fed subjects (Table 4). No differences were observed in arterial serum VLDL-TG concentration between the groups (P = 0.11, two-way ANOVA). The VLDL-TG uptake across the leg was significantly higher after the fat-rich than after the carbohydrate-rich diet, and for both groups it was increased after 30 min of exercise (P < 0.05). After 60 min of exercise, VLDL-TG uptake across the leg was not different from the value measured at rest.
The arterial adrenaline concentration was similarly and significantly increased after 15 min of exercise, and again after 60 min (Table 5). There were no significant differences between groups. However, a closer inspection of the statistical evaluation revealed that the difference between groups was borderline significant (P = 0.06, two-way ANOVA and P = 0.065, two-way ANOVA, diet-time interaction). This suggests that the tendency is for a progressively increasing higher concentration of adrenaline during exercise after fat feeding than after carbohydrate feeding. The arterial noradrenaline concentration was similarly and significantly increased after 15 min of exercise, and again after 60 min of exercise in both groups (Table 5). There were no significant differences between groups, although a closer inspection of the data revealed that a diet-time interaction for plasma noradrenaline was borderline significant (P = 0.064), indicating that the arterial plasma noradrenaline increased more towards the end of exercise after the fat-rich diet (P = 0.082 for the 60 min sample). The arterial plasma insulin concentration decreased progressively and similarly during exercise in the two groups (P < 0.05, Table 5), and a trend was observed towards a higher plasma insulin concentration after the fat-rich than the carbohydrate-rich diet (P = 0.097, two-way ANOVA).
Table 5.
Hormonal response at rest and during bicycle exercise
| Rest (0 min) | 15 min | 30 min | 60 min | |||||
|---|---|---|---|---|---|---|---|---|
| FAT | CHO | FAT | CHO | FAT | CHO | FAT | CHO | |
| Adrenaline (nmol l−1) | 0.53 ± 0.06 | 0.44 ± 0.10 | 1.27 ± 0.14* | 1.03 ± 0.11* | 1.56 ± 0.24 | 1.07 ± 0.09 | 1.85 ± 0.26* | 1.77 ± 0.61* |
| Noradrenaline (nmol l−1) | 2.28 ± 0.27 | 3.78 ± 2.0 | 10.9 ± 1.2* | 11.3 ± 0.3* | 12.2 ± 1.5 | 11.4 ± 1.2 | 16.8 ± 1.5* | 13.1 ± 1.9* |
| Insulin (μU ml−1) | 7.8 ± 1.0 | 6.2 ± 0.7 | 5.8 ± 0.7* | 4.0 ± 0.6* | 5.7 ± 0.8 | 4.3 ± 0.5 | 4.8 ± 0.8* | 3.1 ± 0.4* |
Values are means ±s.e.m.
P < 0.05, values different from previous sample.
Stable isotopes and substrate kinetics
The labelling of breath 13CO2 decreased from rest to exercise, after which it remained constant across the exercise in both groups (P < 0.05). The tracer/tracee ratio for plasma [1-13C]palmitate decreased between rest and 15 min of exercise (P < 0.05), after which a steady plateau was maintained until the end of exercise (Fig. 3B). The arterial palmitate enrichment was significantly lower after the fat-rich than the carbohydrate-rich diet throughout the exercise period (Fig. 3A). During the last 30 min of exercise the mean fractional extraction across the leg was calculated to be 20 ± 10 and 24 ± 7 % in the fat-fed and the carbohydrate-fed groups, respectively (Table 3). The tracer-derived total leg FA uptake during the last 30 min of exercise was not significantly different between groups (Table 3); however, the absolute difference between groups was almost identical to the difference in net leg FA uptake. The FA release across the leg was identical in the two groups during exercise (Table 3). The Ra of palmitate and thus FA in the whole-body approach was stable over the last 30 min of exercise in both groups. A significantly higher Ra of palmitate and FAs occurred in the fat-fed than in the carbohydrate-fed subjects throughout the exercise (Fig. 3C). The fluxes of free FAs were significantly higher in the fat-fed than in the carbohydrate-fed group, and both were stable over the second half of the exercise period (Table 2). Throughout the exercise, levels of plasma FA oxidation were significantly higher after the fat-rich than after the carbohydrate-rich diet (Table 2). The proportions of FAs oxidized were similar in the two groups throughout the later part of the exercise. The estimated oxidation of lipid sources other than plasma FA was significantly different during exercise (Table 2, Fig. 4)
Figure 3. Effects of training and diet on arterial [1-13C]palmitate enrichment, breath 13CO2 enrichment and the rate of appearance of FAs.
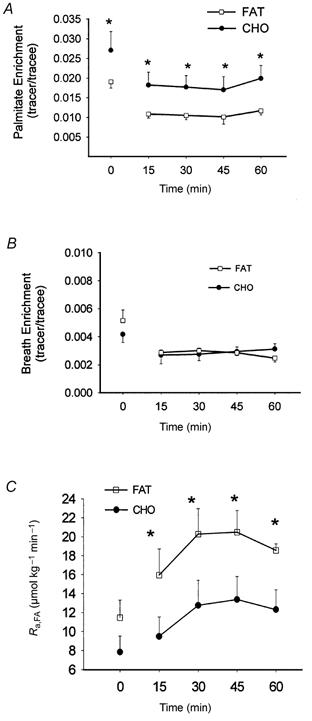
Arterial [1-13C]palmitate enrichment (A), breath 13CO2 enrichment (B) and rate of appearance of FAs (Ra,FA, C) at rest and during exercise after 7 weeks of training and adaptation to either a FAT (□) or a CHO (•) diet. Ra,FA was calculated according to Steele's non-steady-state equations (see Methods for details). Values are means ±s.e.m. *P < 0.05, FAT vs. CHO.
Figure 4. Effects of training and diet on whole-body and leg substrate partitioning.
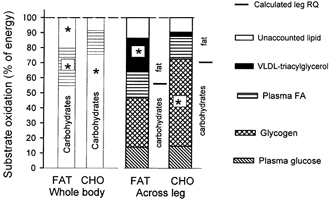
Whole-body substrate oxidation, assessed by indirect calorimetry and stable isotope tracer methodology during exercise (left side), and the contribution of blood- and muscle-derived substrates to total fuel oxidation in the leg during exercise (right side) in the fasted state after 7 weeks of training and adaptation to either a FAT or a CHO diet. The substrate contribution from glycogen was determined as net breakdown multiplied by the estimated active muscle mass of the leg (4 kg). The partition between non-protein fat-carbohydrate oxidation calculated from leg RQ is indicated to the right of each dietary treatment. Values are presented as means. *P < 0.05, FAT vs. CHO.
Muscle metabolites
Muscle glycogen content before training was similar in the two groups (Table 6). After 7 weeks, the glycogen content was unchanged after adaptation to the fat-rich diet and was significantly lower than after the carbohydrate-rich diet, whereas after carbohydrate adaptation the glycogen content was increased by 46 % when compared to the initial values (P < 0.05, Table 6). Over the 60 min of exercise, muscle glycogen breakdown was significantly lower after the fat than after the carbohydrate diet adaptation (Table 6, Fig. 4). Muscle triacylglycerol content was similar prior to the training-diet period, but after 7 weeks were significantly increased after the fat diet adaptation, although unchanged after the carbohydrate diet adaptation (Table 6). After exercise, muscle triacylglycerol content was still significantly higher in the fat-fed than the carbohydrate-fed group. There was no significant observable breakdown of muscle triacylglycerol in either group.
Table 6.
Muscle substrate storage and utilization
| Biopsy at rest | Pre-exercise | 60 min exercise | ΔBreakdown (m mol (kg dry weight)−1 min−1) | |||||
|---|---|---|---|---|---|---|---|---|
| FAT | CHO | FAT | CHO | FAT | CHO | FAT | CHO | |
| Muscle glycogen(mmol (kg dry weight)−1) | 518 ± 74 | 467 ± 37 | 480 ± 29 | 683 ± 46*† | 326 ± 47‡ | 397 ± 32‡ | 2.6 ± 0.5 | 4.8 ± 0.5† |
| Muscle triacylglycerol(mmol (kg dry weight)−1) | 44 ± 6 | 36 ± 7 | 69 ± 8*† | 40 ± 6 | 62 ± 4† | 40 ± 5 | — | — |
Needle biopsy samples were taken before training (rest), and pre-exercise and after 60 min of exercise following 7 weeks of training. Values are means ±s.e.m.
P < 0.05, values higher than before training
P < 0.05, values higher after this diet than the other diet
P < 0.05, values lower than Pre-exercise.
In order to quantify substrate utilization across the leg (Fig. 4, right) it is necessary to know the muscle mass actively involved during exercise, but (in contrast to the one-leg extension model) it is not simple to estimate active muscle mass during bicycle exercise. However, based on the assumption that the measured arterio-venous glucose uptake is completely oxidized, leg muscle glycogen breakdown can be estimated as total leg carbohydrate oxidation (as determined by indirect calorimetry) minus leg glucose uptake plus the lactate release from the leg. With this approach, the metabolically estimated leg glycogen breakdown amounted to 4.71 and 2.99 mmol min−1 in the carbohydrate- and fat-fed subjects, respectively. The active muscle mass was estimated to be 4 kg per leg based on a calculation of the actual biochemically measured glycogen breakdown rate, which amounted to 4.75 and 2.51 mmol min−1 in carbohydrate-fed and fat-fed subjects, respectively, under the assumption that glycogen breakdown was uniform in the active muscle mass (muscle water content was 75 %, data not shown).
DISCUSSION
One approach to the study of fuel utilization during exercise is the application of whole-body stable isotope tracer methodology in combination with indirect calorimetry. A complementary approach is to measure arterio-venous differences in substrates, and blood flow across a working limb, and to combine these with measurements of glycogen and triacylglycerol utilization in muscle biopsy samples taken before and after exercise. In the present study, all of these methods were applied during exercise at 68 % of maximum oxygen uptake. A major finding was the utilization of circulating VLDL-TG after adaptation to the fat-rich diet. In addition, utilization of plasma FA was greater after the fat-rich compared to the carbohydrate-rich diet, whereas plasma glucose uptake during exercise was identical between the two conditions. Thus, the reduction in carbohydrate oxidation after fat diet adaptation was due to muscle glycogen sparing.
In the present study, [1-13C]palmitate was infused during exercise, under conditions in which the composition of the fuel mix utilized was markedly different. Under both conditions the stable isotope tracer data, combined with data from indirect calorimetry, indicated that approximately 55-65 % of total whole-body fat oxidation came from plasma FAs (Fig. 4). These findings are in accordance with the findings of Romijn et al. (1993). In that study, in which the pre-exercise diet was not controlled, whole-body exercise was performed at 65 % of maximum oxygen uptake and it was demonstrated that plasma FA oxidation contributed 53 % of whole-body fat oxidation. For studies of metabolite exchange across the leg, only limited evidence is available for comparisons. In the present study, a fractional extraction of [1-13C]palmitate across the leg of 20-25 % and a net leg extraction of FAs of 8-11 % (Table 3) was observed, which is in accordance with previous values obtained using radioactive tracers (Havel et al. 1967; Turcotte et al. 1992). Tracer-determined leg FA uptake accounted for 39-50 % of the total fat utilized during exercise (Fig. 4) in fat-fed and carbohydrate-fed subjects, which is somewhat less (15 %) than that derived from whole-body data on [1-13C]palmitate oxidation (Fig. 4). This difference cannot be readily explained, but it is possible that the determination of leg FA uptake was underestimated due to contamination of the FAs originating from fat tissue draining into the femoral vein (Van Hall et al. 1999). When comparing leg RQ (0.87 ± 0.02, 0.91 ± 0.03) and whole-body R (0.86 ± 0.01, 0.93 ± 0.02), the difference between RQ and R is minimal in both groups, thus eliminating the possibility of a higher fat utilization in the upper body compared to the legs. However, there might be a different partition between fat fuels in the upper body and arms compared to the legs, such that the discrepancy between whole-body and leg measurements could be due to a higher utilization of plasma FAs during exercise in tissues other than the exercising leg muscle, such as the liver and the heart. Unfortunately, there are no data available on the exact partitioning between the upper and lower body of fat fuels during bicycle exercise. Based on the present results, it seems reasonable to suggest that plasma FA utilization in the working leg is somewhat lower than that revealed by whole-body measurements.
No matter which of the techniques were used, some of the lipids oxidized could not be accounted for (Fig. 4). With the whole-body approach, this unaccountable fraction has generally been assumed to represent the oxidation of intramuscular triacylglycerols, based on the assumption that FAs originating from triacylglycerol in the blood (serum triacylglycerol or VLDL-TG) are not utilized by the working muscle. However, in the present study a significant fraction of VLDL-TG was degraded across the exercising leg in the fat-fed group. Assuming that all FAs liberated by the degradation of VLDL-TG were taken up by the muscle tissue and oxidised, this would provide a major portion of the unaccountable fat oxidized after fat feeding (Fig. 4). Degradation of VLDL-TG during exercise is in accordance with our earlier findings, which demonstrated a significant catabolism of VLDL-TG across the trained but not the untrained leg (Kiens et al. 1993). In the present study, degradation of VLDL-TG was only marginal during exercise in the carbohydrate-fed group. The difference in degradation between fat- and carbohydrate-fed groups was not related to a higher arterial VLDL-TG concentration after the fat-rich diet (Table 4), but is more likely to be due to a higher activity of muscle lipoprotein lipase after the fat-rich diet compared to after the carbohydrate-rich diet (Kiens et al. 1987).
As indicated in the Introduction, the extent of muscle triacylglycerol utilization during sustained exercise is controversial. In the present study, the uptake of plasma FAs and FAs from the degradation of VLDL-TG could account for, if all were oxidized, 74 % of total lipid oxidation in the fat-fed subjects and 65 % in the carbohydrate-fed subjects. In the leg, the unaccounted lipid sources amounted to, at most, 20 % of total leg energy turnover. Under the assumption that this originated from muscle triacylglycerol and that breakdown was uniform in the estimated 4 kg of active leg muscle, this is equivalent to approximately 4-5 mmol (kg dry weight)−1 of muscle triacylglycerol, which is clearly at the limit of detection. However, as several previous studies using different techniques and exercise of longer duration did not reveal any significant breakdown of muscle triacylglycerol (Standl et al. 1980; Kiens et al. 1993; Starling et al. 1997; Kiens & Richter, 1998; Bergman et al. 1999), then other sources must also be considered. One such possibility is the delivery of FAs not transported via the blood, but is located in between muscle fibres, as has been suggested previously (Kiens et al. 1993). Unfortunately, the breakdown of FAs from adipocytes dispersed between the muscle cells cannot be measured reliably with current techniques. Still, it is reasonable to believe that these adipocytes could be contributing to lipolysis, and consequently to fuel utilization during exercise.
In the present study, based on the R values and in agreement with our previous findings (Helge et al. 1996), the fat-rich diet elicited a decreased dependence on carbohydrate as a fuel. Interestingly, the plasma glucose uptake, and thus probably the plasma glucose utilization, were identical during exercise between the two diets, so that muscle glycogen sparing after the fat-rich diet accounted for the total lowering of carbohydrate oxidation. Other studies have demonstrated that plasma glucose utilization is significantly lower after both short- (Martin et al. 1978) and long-term (Phinney et al. 1983) adaptation to a fat-rich diet compared to a carbohydrate-rich diet. However, in those studies muscle glycogen stores were significantly decreased across the diet period, whereas in the present study muscle glycogen was maintained at the initial level during fat diet adaptation. Furthermore, in the present study the arterial plasma glucose concentration was higher throughout the last 30 min of exercise, whereas in previous studies the arterial plasma glucose concentration was reportedly either similar (Phinney et al. 1983) or lower (Martin et al. 1978) during exercise.
In conclusion, in this study we have demonstrated that VLDL-TG made a significant contribution to fuel utilization during exercise after adaptation to a fat-rich diet. The increased total fat oxidation observed after fat diet adaptation originated from both a higher plasma FA oxidation and utilization of VLDL-TG, and thus circulating VLDL-TG should be included among the lipid fuels that may be utilized during exercise. In contrast, the carbohydrate sparing observed after fat diet adaptation was due to muscle glycogen sparing and not to a diminished plasma glucose uptake.
Acknowledgments
The skilled technical assistance of Martin Rollo, Irene Beck Nielsen, Betina Bolmgren, Winnie Tågerup and Nina Pluzek is acknowledged. The study was supported by grants from the Danish National Research Foundation grant no. 504-14, the Danish Research Academy (J.nr. 77-7711), Team Danmark and the Danish Sports Research Council J.nr. 94-1-09, the UK Medical Research Council and the Wellcome Trust.
References
- Andersen P, Saltin B. Maximal perfusion of skeletal muscle in man. Journal of Physiology. 1985;366:233–249. doi: 10.1113/jphysiol.1985.sp015794. [DOI] [PMC free article] [PubMed] [Google Scholar]
- Bergman BC, Butterfield GE, Wolfel EE, Casazza GA, Lopaschuk GD, Brooks GA. Evaluation of exercise and training on muscle lipid metabolism. American Journal of Physiology. 1999;276:E06–117. doi: 10.1152/ajpendo.1999.276.1.E106. [DOI] [PubMed] [Google Scholar]
- Bergström J. Muscle electrolytes in man: determined by neutron activation analysis on needle biopsy specimens. A study on normal subjects, kidney patients and patients with chronic diarrhea. Scandinavian Journal of Clinical Laboratory Investigation. 1962;68:11–13. [Google Scholar]
- Brooke MH, Kaiser KK. Three ‘myosin ATPase’ systems: the nature of their pH lability and sulfhydryl dependence. Journal of Histochemistry and Cytochemistry. 1970;18:670–672. doi: 10.1177/18.9.670. [DOI] [PubMed] [Google Scholar]
- Carlson LA, Ekelund LG, Froberg SO. Concentration of triglycerides, phospholipids and glycogen in skeletal muscle and of free fatty acids and beta-hydroxybutyric acid in blood in man in response to exercise. European Journal of Clinical Investigation. 1971;1:248–254. doi: 10.1111/eci.1971.1.4.248. [DOI] [PubMed] [Google Scholar]
- Christensen EH, Hansen O. Arbeitsfähigkeit und ernärung. Skandinavishes Archiv für Physiolgie. 1939;81:160–171. [Google Scholar]
- Christensen NJ, Vestergaard P, Sorensen T, Rafaelsen OJ. Cerebrospinal fluid adrenaline and noradrenaline in depressed patients. Acta Psychiatrica Scandinavica. 1980;61:178–182. doi: 10.1111/j.1600-0447.1980.tb00577.x. [DOI] [PubMed] [Google Scholar]
- Coyle EF, Jeukendrup AE, Oseto MC, Hodgkinson BJ, Zderic TW. Low-fat diet alters intramuscular substrates and reduces lipolysis and fat oxidation during exercise. American Journal of Physiology, Endocrinology and Metabolism. 2001;280:E391–398. doi: 10.1152/ajpendo.2001.280.3.E391. [DOI] [PubMed] [Google Scholar]
- Coyle EF, Jeukendrup AE, Wagenmakers AJM, Saris WHM. Fatty acid oxidation is directly regulated by carbohydrate metabolism during exercise. American Journal of Physiology. 1997;36:E268–275. doi: 10.1152/ajpendo.1997.273.2.E268. [DOI] [PubMed] [Google Scholar]
- Drabkin DL, Austin FH. Spectrophotometric studies II. Preparations from washed blood cells, nitric oxide hemoglobin and sulfhemoglobin. Journal of Biological Chemistry. 1935;122:51–65. [Google Scholar]
- Essen B, Hagenfeldt L, Kaijser L. Utilization of blood-borne and intramuscular substrates during continuous and intermittent exercise in man. Journal of Physiology. 1977;265:489–506. doi: 10.1113/jphysiol.1977.sp011726. [DOI] [PMC free article] [PubMed] [Google Scholar]
- Fisher EC, Evans WJ, Phinney SD, Blackburn GL, Bistrian BR, Young VR. Changes in skeletal muscle metabolism induced by a eucaloric ketogenic diet. In: Knuttgen HG, Vogel JA, Portman J, editors. Biochemistry of Exercise. Champaign IL, USA: Human Kinetics; 1983. pp. 497–501. [Google Scholar]
- Frayn K. Calculation of substrate oxidation rates in vivo from gaseous exchange. Journal of Applied Physiology. 1983;55:628–634. doi: 10.1152/jappl.1983.55.2.628. [DOI] [PubMed] [Google Scholar]
- Havel RJ, Pernow B, Jones NL. Uptake and release of free fatty acids and other metabolites in the legs of exercising men. Journal of Applied Physiology. 1967;23:90–99. doi: 10.1152/jappl.1967.23.1.90. [DOI] [PubMed] [Google Scholar]
- Helge JW, Kiens B. Muscle enzyme activity in man: role of substrate availability and training. American Journal of Physiology. 1997;272:R1620–1624. doi: 10.1152/ajpregu.1997.272.5.R1620. [DOI] [PubMed] [Google Scholar]
- Helge JW, Richter EA, Kiens B. Interaction of training and diet on metabolism and endurance during exercise in man. Journal of Physiology. 1996;292:293–306. doi: 10.1113/jphysiol.1996.sp021309. [DOI] [PMC free article] [PubMed] [Google Scholar]
- Helge JW, Wulff B, Kiens B. Impact of a fat rich diet on endurance in man: role of the dietary period. Medicine and Science in Sports and Exercise. 1998;30:456–461. doi: 10.1097/00005768-199803000-00018. [DOI] [PubMed] [Google Scholar]
- Hultman E, Nilsson L. Liver glycogen in man. Effect of different diets and muscular exercise. In: Pernow B, Saltin B, editors. Muscle Metabolism During Exercise. New York: Plenum Press; 1971. pp. 143–151. [Google Scholar]
- Kiens B, Essen-Gustavsson B, Christensen NJ, Saltin B. Skeletal muscle substrate utilization during submaximal exercise in man: Effect of endurance training. Journal of Physiology. 1993;469:459–478. doi: 10.1113/jphysiol.1993.sp019823. [DOI] [PMC free article] [PubMed] [Google Scholar]
- Kiens B, Essen-Gustavsson B, Gad P, Lithell H. Lipoprotein lipase activity and intramuscular triglyceride stores after long term high-fat and high-carbohydrate diets in physically trained men. Clinical Physiology. 1987;7:1–9. doi: 10.1111/j.1475-097x.1987.tb00628.x. [DOI] [PubMed] [Google Scholar]
- Kiens B, Lithell H. Lipoprotein metabolism influenced by training-induced changes in human skeletal muscle. Journal of Clinical Investigation. 1989;83:558–564. doi: 10.1172/JCI113918. [DOI] [PMC free article] [PubMed] [Google Scholar]
- Kiens B, Richter EA. Types of carbohydrate in an ordinary diet affect insulin action and muscle substrates in humans. American Journal of Clinical Nutrition. 1996;63:47–53. doi: 10.1093/ajcn/63.1.47. [DOI] [PubMed] [Google Scholar]
- Kiens B, Richter EA. Utilization of skeletal muscle triacylglycerol during postexercise recovery in humans. American Journal of Physiology, Endocrinology and Metabolism. 1998;38:E332–337. doi: 10.1152/ajpendo.1998.275.2.E332. [DOI] [PubMed] [Google Scholar]
- Krogh A, Lindhard J. The relative value of fat and carbohydrate as sources of muscular energy. Biochemical Journal. 1920;14:290–363. doi: 10.1042/bj0140290. [DOI] [PMC free article] [PubMed] [Google Scholar]
- Lacroix M, Mosora F, Pontus M, Lefebvre P, Luyckz A, Lopez-Habib G. Glucose naturally labeled with carbon-13: use for metabolic studies in man. Science. 1973;181:445–446. doi: 10.1126/science.181.4098.445. [DOI] [PubMed] [Google Scholar]
- Lowry OH, Passonneau JV. A Flexible System of Enzymatic Analysis. New York: Academic Press; 1972. [Google Scholar]
- Martin B, Robinson S, Robertshaw D. Influence of diet on leg uptake of glucose during heavy exercise. American Journal of Clinical Nutrition. 1978;31:62–67. doi: 10.1093/ajcn/31.1.62. [DOI] [PubMed] [Google Scholar]
- Phillips SM, Green HJ, Tarnopolsky MA, Heigenhauser GF, Hill RE, Grant SM. Effects of training duration on substrate turnover and oxidation during exercise. Journal of Applied Physiology. 1996;81:2182–2191. doi: 10.1152/jappl.1996.81.5.2182. [DOI] [PubMed] [Google Scholar]
- Phinney SD, Bistrian BR, Evans WJ, Gervino E, Blackburn GL. The human metabolic response to chronic ketosis without caloric restriction: preservation of submaximal exercise capability with reduced carbohydrate oxidation. Metabolism. 1983;32:769–776. doi: 10.1016/0026-0495(83)90106-3. [DOI] [PubMed] [Google Scholar]
- Romijn JA, Coyle EF, Sidossis LS, Gastadelli A, Horowitz JF, Endert E, Wolfe RR. Regulation of endogenous fat and carbohydrate metabolism in relation to exercise intensity and duration. American Journal of Physiology. 1993;265:E380–391. doi: 10.1152/ajpendo.1993.265.3.E380. [DOI] [PubMed] [Google Scholar]
- Schoeller DA, Klein PD, Watkins JB, Heim T, Mac Lean WC., Jr 13C abundances of nutrients and the effect of variations in 13C isotopic abundances of test meals formulated for 13CO2 breath tests. American Journal of Clinical Nutrition. 1980;33:2375–2385. doi: 10.1093/ajcn/33.11.2375. [DOI] [PubMed] [Google Scholar]
- Schrauwen P, Blaak EE, Aggel-Leijssen DP, Borghouts LB, Wagenmakers AJ. Determinants of the acetate recovery factor: implications for estimation of [13C]substrate oxidation. Clinical Science. 2000a;98:587–592. [PubMed] [Google Scholar]
- Schrauwen P, Wagenmakers AJM, Lichtenbelt WDVM, Saris WHM, Westerterp KR. The effect of diet on acetate recovery factor during rest and exercise. Proceedings of the Nutrition Society. 1999;58:163A. [Google Scholar]
- Schrauwen P, Wagenmakers AJ, Marken Lichtenbelt WD, Saris WH, Westerterp KR. Increase in fat oxidation on a high-fat diet is accompanied by an increase in triglyceride-derived fatty acid oxidation. Diabetes. 2000b;49:640–646. doi: 10.2337/diabetes.49.4.640. [DOI] [PubMed] [Google Scholar]
- Scrimgeour CM, Rennie MJ. Automated measurement of the concentration and 13C enrichment of carbon dioxide in breath and blood samples using the Finnigan MAT Breath Gas Analysis System. Biomedical Environmental Mass Spectrometry. 1988;15:365–367. doi: 10.1002/bms.1200150703. [DOI] [PubMed] [Google Scholar]
- Sidossis LS, Coggan AR, Gastadelli A, Wolfe RR. A new correction factor for use in tracer estimations of plasma fatty acid oxidation. American Journal of Physiology. 1995;269:649–655. doi: 10.1152/ajpendo.1995.269.4.E649. [DOI] [PubMed] [Google Scholar]
- Siggaard-Andersen O, Wimberley PD, Fogh-Andersen N. Measured and derived quantities with modern pH and blood gas equipment: calculation algorithms with 54 equations. Scandinavian Journal of Clinical Laboratory Investigation. 1988;48:7–15. [Google Scholar]
- Standl E, Lotz N, Dexel T, Janka H-U, Kolb HJ. Muscle triglycerides in diabetic subjects: effects of insulin deficiency and exercise. Diabetologica. 1980;18:463–469. doi: 10.1007/BF00261702. [DOI] [PubMed] [Google Scholar]
- Starling RD, Trappe TA, Parcell AC, Kerr CG, Fink WJ, Costill DL. Effects of diet on muscle triglyceride and endurance performance. Journal of Applied Physiology. 1997;82:1185–1189. doi: 10.1152/jappl.1997.82.4.1185. [DOI] [PubMed] [Google Scholar]
- Steele R. Influences of glucose loading and of injected insulin on hepatic glucose output. Annals of the New York Academy of Sciences. 1959;82:420–432. doi: 10.1111/j.1749-6632.1959.tb44923.x. [DOI] [PubMed] [Google Scholar]
- Tanis AA, Rietveld T, Wattimena JL, Van Den Berg JW, Swart GR. Muscle glycogen does not interfere with a 13CO2 breath test to monitor liver glycogen oxidation. Clinical Physiology. 2000;20:126–133. doi: 10.1046/j.1365-2281.2000.00237.x. [DOI] [PubMed] [Google Scholar]
- Turcotte LP, Richter EA, Kiens B. Increased plasma FFA uptake and oxidation during prolonged exercise in trained vs. untrained humans. American Journal of Physiology. 1992;262:E791–799. doi: 10.1152/ajpendo.1992.262.6.E791. [DOI] [PubMed] [Google Scholar]
- Van Hall G. Correction factors for 13C-labelled substrate oxidation at whole-body and muscle level. Proceedings of the Nutrition Society. 1999;58:979–986. doi: 10.1017/s0029665199001299. [DOI] [PubMed] [Google Scholar]
- Van Hall G, Gonzalez-Alonso J, Sacchetti M, Saltin B. Skeletal muscle substrate metabolism during exercise: methodological considerations. Proceedings of the Nutrition Society. 1999;58:899–912. doi: 10.1017/s0029665199001202. [DOI] [PubMed] [Google Scholar]
- Wagenmakers AJ, Rehrer NJ, Brouns F, Saris WH, Halliday D. Breath 13CO2 background enrichment during exercise: diet-related differences between Europe and America. Journal of Applied Physiology. 1993;74:2353–2357. doi: 10.1152/jappl.1993.74.5.2353. [DOI] [PubMed] [Google Scholar]
- Wieland O. Glycerol assay. In: Bergmeyer HV, editor. Methods of Enzymatic Analysis. New York: Academic Press; 1974. pp. 1404–1406. [Google Scholar]
- World Health Organization. Energy and protein requirements: report of a joint FAO/WHO/UNU expert consultation. Technical Report Series. 1985;724:1–206. [PubMed] [Google Scholar]