

Abstract
Descending corticospinal volleys evoked after transcranial magnetic or electrical stimulation of the leg area of the motor cortex were recorded from an electrode in the spinal epidural space of six conscious patients who had electrodes implanted for treatment of chronic pain, and from one anaesthetised patient undergoing surgery for a spinal tumour.
At threshold, the shortest-latency volley (L1 volley) was evoked by stimulation with an anode 2 cm lateral to the vertex. Anodal stimulation at the vertex also elicited a volley at this latency in two patients, but in the other patients the first volley evoked appeared 1—1.3 ms later (L2 volley), at the same latency as the initial volley evoked by magnetic stimulation. High-intensity stimulation of any type could evoke both the L1 and L2 waves as well as later ones (L3, L4, etc.) that had a periodicity of about 1.5 ms.
Voluntary contraction increased the amplitude of the L2 and later volleys, but had no effect on the L1 volley.
Intracortical inhibition between pairs of magnetic stimuli resulted in clear suppression of the L4 and later waves. The L2 and L3 waves were unaffected.
In the anaesthetised patient the L1 volley occurred 1.7 ms later than the volley produced by transmastoid stimulation of the corticospinal pathways in the brainstem.
The L1 volley is likely to be a D wave produced by the direct activation of pyramidal axons in the subcortical white matter; the L2 and later volleys are likely to be I waves produced by the trans-synaptic activation of corticospinal neurones. The implication is that electrical stimulation with an anode at the vertex is more likely to evoke I waves preferentially than stimulation over the hand area. A more secure way to ensure D wave activation of corticospinal fibres from the leg area is to place the anode 2 cm lateral to the vertex.
Transcranial magnetic stimulation (TMS) can readily activate the output of the motor cortex and evoke EMG responses in muscles throughout the body. At least for the hand area, there is now a relatively well-accepted model of how stimulation evokes the corticospinal output. At low intensities, TMS activates corticospinal neurones trans-synaptically (I waves: Day et al. 1989; Burke et al. 1993; Kaneko et al. 1996; Nakamura et al. 1996; Di Lazzaro et al. 1998a, b). Direct activation of the axon only occurs at high stimulation intensities, or if the magnetic stimulus induces current to flow in a latero-medial direction along the central sulcus (e.g. Werhahn et al. 1994; Kaneko et al. 1996; Nakamura et al. 1996; Di Lazzaro et al. 1998a). Transcranial electrical stimulation (particularly anodal stimulation; Day et al. 1989) appears to stimulate preferentially the axons of pyramidal tract cells in the subcortical white matter (D waves), and activates pyramidal neurones trans-synaptically only at higher intensities. Burke et al. (1993), who recorded descending volleys in anaesthetised patients, also noted that high-intensity anodal stimulation over the hand area could spread deep into the brain and activate corticospinal axons at two preferred points that were thought to correspond to the cerebral peduncle (the volley was 0.9 ms earlier than that evoked at threshold; termed the D2 wave), and the pyramidal decussation (1.7 ms earlier; see also Rothwell et al. (1994); termed the D3 wave).
Previous studies using surface and single-unit EMG recording suggest that magnetic stimulation over the leg area recruits neurones in a subtly different way to those recruited by magnetic stimulation over the hand area. Priori et al. (1993) found that the latency of surface and single-unit EMG responses in the tibialis anterior (TA) muscle was the same for both vertex electrical and magnetic stimulation of the leg area. They assumed that electrical stimulation activated corticospinal axons in the subcortical white matter, and therefore they proposed that magnetic stimulation activated the same point. Effectively, they suggested that TMS of the leg area was much more likely to evoke a D wave than after stimulation over the hand area. Nielsen et al. (1995) also found that the latency of EMG responses in leg muscles was the same after electrical or magnetic stimulation at the vertex. However, there were two additional features of their results that led them to propose that excitation occurred at the initial segment of the corticospinal neurone rather than at the membrane of the subcortical axon. First, they used H-reflex testing to demonstrate that voluntary contraction could decrease the threshold and increase the size of descending volleys evoked by both forms of stimulation (Nielsen et al. 1993). This would be a natural consequence of stimulation at the initial segment, but not of stimulation of the axon. The second point was that if the anodal electrical stimulus was moved 2 cm lateral to the vertex, EMG latencies jumped 1-2 ms earlier still. They proposed that with this electrode position, the point of activation moved into the deep subcortical white matter like the D2 wave of Burke et al. (1993).
A recent paper by Terao et al. (2000) has questioned the generality of these findings. First of all, they could not reproduce the finding of Nielsen et al. (1995) that responses to anodal electrical stimulation were earlier when the anode was placed 2 cm lateral to the vertex. Second, they compared the latency of their responses with those elicited by transmastoid electrical stimulation (Ugawa et al. 1991), which is thought to activate corticospinal fibres at the pyramidal decussation. Terao et al. (2000) found that the EMG responses evoked by lateral electrical stimulation had a latency that was 1.6-2 ms longer than those evoked by transmastoid stimulation, leading them to conclude that scalp electrical stimulation over the leg area activated corticospinal axons in the subcortical white matter (see Rothwell et al. 1994). They also found that magnetic stimulation, especially around threshold intensities, preferentially evoked EMG responses that were later than those evoked after anodal stimulation, whilst at higher intensities the latencies became equal. They argued that stimulation of the leg area was fundamentally the same as stimulation of the hand area: magnetic stimuli tended to evoke I waves, whereas vertex electrical stimulation preferentially evoked conventional D waves.
These previous reports were limited by the fact that none of the authors had actually recorded the descending volleys evoked in the corticospinal tract. They had inferred what these volleys were likely to have been by examining the form of the EMG responses. One previous study (Houlden et al. 1999) has tackled specifically the recruitment of corticospinal volleys from the leg area using direct recording of descending corticospinal volleys from the epidural space of awake human subjects. They found that multiple volleys could be elicited by TMS, but that the earliest was evoked preferentially at high threshold. On the basis of the effect of anaesthesia on each volley, they identified the earliest volley as a D wave and the later volleys as I waves. They therefore favoured the original explanation of Priori et al. (1993) that magnetic stimulation could activate the axons of corticospinal neurones directly (D activation) as well as trans-synaptically (I activation). Unfortunately, they did not compare the responses to those evoked by electrical stimulation, so that the relationship between their results and those of other studies is still debateable. In particular, they did not test the hypothesis of Nielsen et al. (1995), who proposed that the first volley evoked at low threshold is initiated at the initial segment of corticospinal neurones.
In the present paper we have also recorded descending volleys from the epidural space of awake human subjects following both electrical and magnetic methods of transcranial stimulation. We asked whether magnetic stimulation could evoke volleys with latencies as short as those evoked by anodal stimulation, and measured whether the size of the waves was affected by strong voluntary contraction. We also performed two other tests using double-pulse stimulation to check whether descending volleys are affected by conditioning stimulation in the same way as described for the hand area. Finally, we compared the descending volleys evoked by lateral anodal stimulation with those evoked after transmastoid stimulation.
METHODS
Corticospinal volleys evoked by transcranial magnetic and electrical stimulation of the motor cortex were recorded from the dorsal cord in six conscious patients (5 females; mean (s.d.) age 58 (18.7) years, range 37-80 years) with no abnormality of the central nervous system. The patients had a spinal cord stimulator implanted for treatment of intractable low-back pain. The electrode (Model Quad 3487A Medtronic, Minneapolis, MN, USA) was implanted percutaneously into the epidural space at the thoracic level, and recordings of descending activity were made 2-3 days after implantation during the trial screening period when the electrode connections are externalised. Postoperative X-rays showed that the location of the most distal electrode contact was over D10 in patients 1-4, over D3 in patient 5, and over D2 in patient 6. The patients gave written informed consent to participate in the study, which was performed with the approval of the Institutional Ethics Committee of the Faculty of Medicine of the Catholic University of Rome. The study conformed to the Declaration of Helsinki.
Recordings were made simultaneously from the epidural electrode and from the left TA muscle. Epidural potentials were recorded between the most proximal and most distal of the four electrode contacts on each implant. These had a surface area of 2.54 mm2 and were 30 mm apart. The distal contact was connected to the reference input of the amplifier. Surface EMGs were obtained via two 9 mm diameter Ag-AgCl electrodes with the active electrode over the motor point of the muscle and the reference electrode on the ligamentum patellae. EMGs and the corticospinal volleys were amplified and filtered (bandwidth 3 Hz-3 kHz) by D150 amplifiers (Digitimer, Welwyn Garden City, Herts, UK). Data were collected on a computer with a sampling rate of 10 kHz per channel in patients 1-3 and of 25 kHz per channel in patients 4-6, and stored for later analysis using a CED 1401 A/D converter (Cambridge Electronic Design, Cambridge, UK). A number of different protocols was examined in each patient. We first verified that descending responses could be recorded after magnetic stimulation. If this was possible, the remainder of the single-pulse protocols were then examined in a random order. After this, the double-pulse experiments were performed.
Magnetic stimulation
Magnetic stimulation was performed with a high-power Magstim 200 (Magstim, Whitland, Dyfed, UK). A figure-of-eight coil with external loop diameters of 9 cm was held over the motor cortex at the optimum scalp position to elicit motor responses in the contralateral TA using two different orientations over the motor strip. The induced current flowed either in a postero-anterior direction (6 patients) or in a medio-lateral direction (patients 1-3). These two coil orientations will be termed PA and ML, respectively. Stimulation intensities are expressed as a percentage of the maximum output of the stimulator. The active motor threshold (AMT) was defined as the minimum stimulus intensity that produced a consistent motor-evoked response during isometric contraction of the tested muscle at about 20 % of maximum voluntary contraction. A constant level of voluntary contraction was maintained with reference to an oscilloscope display of EMG in front of the patient. Auditory feedback of the EMG activity was also provided. Resting motor threshold was defined as the minimum stimulus intensity that produced a consistent motor-evoked response (about 50 μV in 50 % of trials) during complete muscle relaxation. Descending volleys and TA EMG responses were recorded both at rest and during strong voluntary contraction. We used increasing intensities of magnetic stimulation in steps of 5 % of the stimulator output in patients 1-3 and in steps of 10 % of the stimulator output in patients 4-6, starting from AMT. Ten sweeps were averaged at each intensity of stimulation.
The latency of each component of the descending volley was measured to its peak. Amplitudes were measured from the peak to the next trough in order to minimise distortions due to stimulus artefacts. Only consistent deflections with a mean amplitude over 10 responses of > 1 μV were analysed.
Electrical stimulation
Electrical stimulation was performed with a Digitimer D180A stimulator, using a 50 μs time constant. The cathode was located 4 cm anterior to the vertex and the anode either at the vertex (vertex anodal stimulation) or 2 cm to the right of the vertex (lateral anodal stimulation). Stimulation intensities are expressed as a percentage of the maximum output of the stimulator. We used two different intensities of stimulation, AMT and AMT plus 5 % of the maximum stimulator output in patients 2, 3, 4 and 5; patients 1 and 6 were studied only at AMT. In patient 2, vertex anodal stimulation was also performed at 10 % of stimulator output above AMT. Responses were recorded both at rest and during strong voluntary contraction, except in patient 3, who was studied only during strong voluntary contraction. Five sweeps were averaged at each intensity of stimulation.
Statistical analysis
The size of the descending volleys recorded during strong voluntary contraction and at rest was compared using a Student's paired t test. In order to correct for the number of multiple comparisons (total of 9), the significance level was adjusted to P < 0.006 after Bonferroni correction.
Interaction between near-threshold magnetic and electrical stimuli
The interaction between magnetic and electrical stimuli was investigated using near-threshold electrical and magnetic stimuli separated by 100 and 500 μs in patients 4 and 5. We used vertex anodal stimulation and PA magnetic stimulation in patient 4 and lateral anodal stimulation and PA magnetic stimulation in patients 4 and 5.
Intracortical inhibition
Corticocortical inhibition was studied in patients 1 and 4, using the technique of Kujirai et al. (1993). Two magnetic stimuli were given through the same stimulating coil over the leg motor cortex using a Bistim module. The effect of the first (conditioning) stimulus on the response to the second (test) stimulus was investigated. The conditioning stimulus was set at an intensity of 5 % (of stimulator output) below AMT. The second, test-shock intensity was adjusted to the maximum stimulator output obtained through the Bistim module. The timing of the conditioning shock was altered in relation to the test shock. Interstimulus intervals (ISIs) of 2 and 3 ms were investigated. Ten control and ten conditioned stimuli were delivered at each ISI. For these recordings muscle relaxation is very important, and the patients were given audio-visual feedback at high gain to assist in maintaining complete relaxation.
Brainstem stimulation
In order to provide further evidence for the site of activation after electrical stimulation of the leg area, we compared the epidural volleys evoked by lateral electrical stimulation with those evoked by brainstem electrical stimulation in one additional anaesthetised patient undergoing surgery for an intramedullary tumour located at the D5-D7 level. The patient, who was 60 years old, was anaesthetised throughout the procedure using propofol and remifentanyl.
Epidural volleys were recorded using an epidural electrode positioned intraoperatively at the D2 level. The recorded volleys were amplified and filtered (5-5000 Hz) and 10 sweeps were averaged using a Nicolet Viking 4. The brainstem was stimulated using a Digitimer D180A stimulator, through two electrodes fixed onto either side of the base of the skull about 5 cm lateral to the inion (Ugawa et al. 1991). The volleys evoked by brainstem stimulation were compared with those evoked by lateral anodal stimulation.
Data are presented as the means ±s.d.
RESULTS
Figure 1 is an example of a complete set of raw data from patient 2, obtained using electrical and magnetic stimulation both at rest and during voluntary contraction. The epidural volleys are on the left of the figure and the corresponding EMG responses in the TA muscle are on the right. Figure 2 shows superimposed subaverages of data from the same patient in order to illustrate the reproducibility of the main volleys. Figure 3 shows details of the responses from four patients and the effects of voluntary contraction. The data are summarised in Table 1.
Figure 1. Average (of 10 trials each) descending volleys (left two columns) and EMG responses (right two columns) evoked by electrical and magnetic transcranial stimulation using increasingly strong stimulus intensities in patient 2.
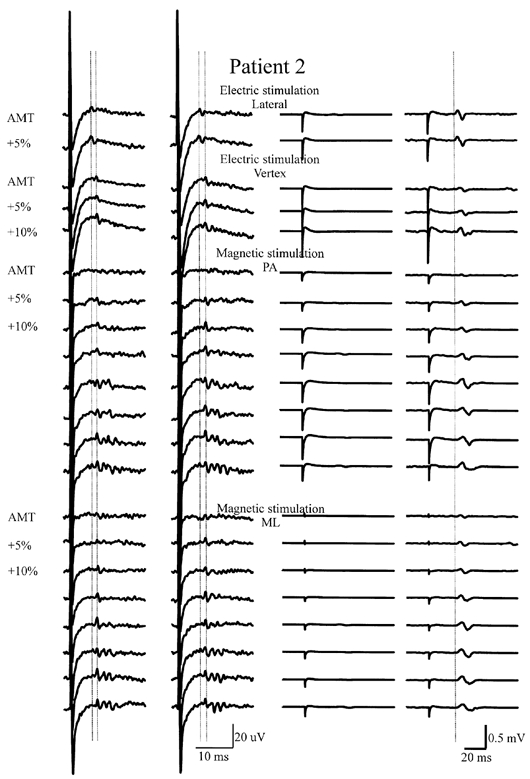
On the left are descending volleys recorded from the lower thoracic cord at rest (first column) and during voluntary contraction (second column). The vertical columns of traces are arranged in order of increasing stimulus intensity. The top traces show volleys recorded after transcranial electrical stimulation of the motor cortex with the anode 2 cm lateral to the vertex at an intensity equal to the active motor threshold (AMT) and at 5 % of stimulator output higher. The peak latency of the first volley is indicated by the left vertical line. Voluntary contraction does not modify the amplitude of the descending wave. The second block of traces shows volleys recorded after transcranial electrical stimulation of the motor cortex with the anode at the vertex at AMT and at 5 and 10 % of stimulator output higher. The first volley has a longer latency than the earliest wave evoked by lateral anodal stimulation. Voluntary contraction increases the amplitude of the descending wave at the two lowest intensities. The third block of traces shows volleys recorded after transcranial magnetic stimulation with a postero-anterior (PA)-induced current. The wave evoked at threshold intensity appears 1.1 ms later than the earliest wave evoked by lateral anodal stimulation. The peak latency of the first volley is indicated by the right vertical line. Later waves appear at increasing stimulus intensities. At the highest intensity, an earlier wave can be seen that has the same latency as the wave evoked by lateral anodal stimulation at threshold. Voluntary contraction increases the amplitude and number of descending volleys. The lower traces show the volley recorded after transcranial magnetic stimulation with a medio-lateral (ML)-induced current. Findings are similar to those obtained using PA magnetic stimulation.
Figure 2. Superimposed averages of descending volleys evoked by electrical and magnetic transcranial stimulation.
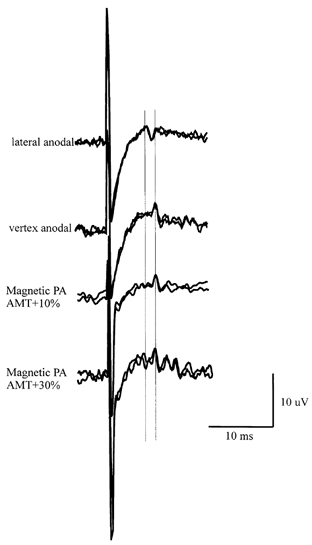
Superimposed averages (1 of 3 trials and 1 of 2 trials for electrical stimulation, and 5 trials each for magnetic stimulation) of descending volleys evoked by electrical and magnetic transcranial stimulation in patient 2, illustrating the repeatability of the recordings. The vertical lines are aligned to the peak latency of the first two volleys.
Figure 3. Descending volleys from four different patients showing the effect of voluntary contraction.
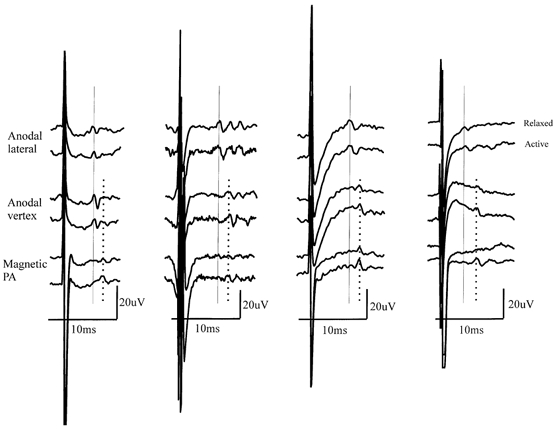
Descending volleys from four different patients (patients 5, 1, 2 and 6 from left to right) showing the effect of voluntary contraction on the amplitude of the different components of the response to lateral anodal, vertex anodal and PA magnetic stimulation at a stimulus intensity of AMT. Note that the size of the earliest-latency volley (L1, vertical continuous line) is not affected by voluntary contraction, whereas that of the second (L2) and later volleys is increased.
Table 1.
Details of epidural volleys recorded in each of the six patients studied
| Type and latency of volleys (ms) evoked at supra-threshold intensities | ||||||||
|---|---|---|---|---|---|---|---|---|
| Patient | Type of stimulation | Active motor threshold (%) | Lowest threshold volley (s) | L1 | L2 | L3 | L4 | L5 |
| 1 | Lateral anodal | 30 | L1; L2; L3 | 6.2 | 7.3 | 8.7 | — | — |
| Vertex anodal | 25 | L2; L3 | — | 7.3 | 8.7 | — | — | |
| Magnetic PA | 44 | L2 | 6.2 | 7.3 | 8.7 | 10.2 | 11.8 | |
| Magnetic ML | 50 | L2 | 6.2 | 7.3 | 8.7 | 10.2 | 11.8 | |
| 2 | Lateral anodal | 24 | L1 | 5.7 | — | — | — | — |
| Vertex anodal | 25 | L2 | 5.7 | 7.0 | 8.7 | — | — | |
| Magnetic PA | 65 | L2 | 5.7 | 7.0 | 8.7 | 10.3 | 11.8 | |
| Magnetic ML | 45 | L2 | 5.7 | 7.0 | 8.7 | 10.3 | 11.8 | |
| 3 | Lateral anodal | 38 | L1; L2 | 6.2 | 7.8 | — | — | — |
| Vertex anodal | 50 | L1 | 6.2 | — | — | — | — | |
| Magnetic PA | 55 | L2 | 6.2 | 7.8 | 9.4 | 11.2 | — | |
| Magnetic ML | 70 | L2 | 6.2 | 7.8 | 9.4 | — | — | |
| 4 | Lateral anodal | 43 | L1 | 6.0 | — | — | — | — |
| Vertex anodal | 37 | L2 | — | 7.3 | — | — | — | |
| Magnetic PA | 41 | L2 | — | 7.3 | 9.0 | 10.4 | 12.1 | |
| 5 | Lateral anodal | 35 | L1 | 4.3 | — | — | — | — |
| Vertex anodal | 40 | L1 | 4.3 | — | — | — | — | |
| Magnetic PA | 61 | L2 | — | 5.8 | — | — | — | |
| 6 | Lateral anodal | 32 | L1 | 3.6 | — | — | — | — |
| Vertex anodal | 35 | L2 | — | 5.0 | — | — | — | |
| Magnetic PA | 38 | L2 | — | 5.0 | 6.7 | 8.2 | — | |
PA postero-anterior direction, ML medio-lateral direction.
Electrical stimulation
All patients were studied during strong voluntary contraction and all except for patient 3 were also studied at rest. Patients 2, 3, 4 and 5 were given stimuli at AMT and 5 % above AMT, whilst patients 1 and 6 were studied only at AMT. In patient 2, vertex anodal stimulation was also performed at 10 % of stimulator output above AMT.
Lateral anodal stimulation
The mean AMT in all six patients was 34 ± 7 % of stimulator output. The mean latency of the earliest volley in patients 1-4, who had a similar electrode location, was 6.0 ± 0.2 ms; in patients 5 and 6 (with the high thoracic electrode) the latency was 4.3 and 3.6 ms. For convenience we will refer to this as an L1 volley. Voluntary contraction had no effect on the amplitude of the L1 volley (P > 0.05; see Fig. 3 and 4). There was insufficient data to test whether there was an effect on later waves.
Figure 4. Grand mean amplitude of the total volley and of individual waves evoked by electrical and magnetic stimulation at rest and during strong voluntary contraction.
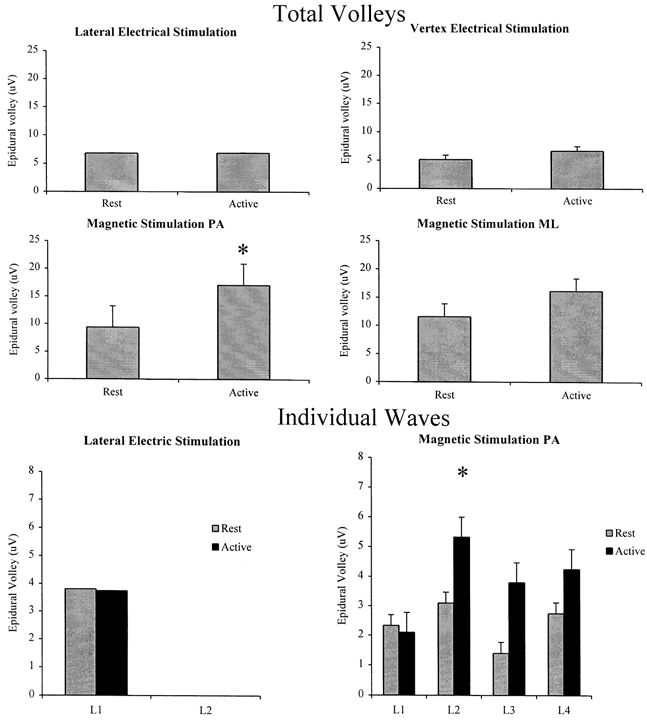
Grand mean amplitude of the total volley (the sum of the amplitudes of individual waves) and of individual waves evoked by electrical and magnetic stimulation at rest and during strong voluntary contraction. All six patients contributed data to the graphs for PA magnetic stimulation. Only five patients contributed data to the electrical stimulation results, and only three patients to the ML magnetic stimulation results. In each individual, the amplitude of the responses was taken as the mean over all of the intensities studied. The graphs plot the grand mean of these data across patients. The amplitude of the total volleys evoked by electrical stimulation is not significantly modified by voluntary contraction (P > 0.05). The amplitude of the total volleys evoked by PA magnetic stimulation is larger during contraction (*P < 0.05). The amplitude of the volley evoked at threshold by lateral anodal stimulation (L1) is not modified by voluntary contraction (P > 0.05). The amplitude of the volley evoked at threshold by PA magnetic stimulation (L2) is larger during voluntary contraction (*P < 0.05).
Vertex anodal stimulation
The mean AMT was 35 ± 10 % of maximum stimulator output. In patients 3 and 5, the earliest wave after vertex stimulation had the same latency as that after lateral stimulation (an L1 volley). In contrast, the earliest negative wave evoked in the other patients had a latency that was 1.1-1.4 ms longer than the shortest latency volley evoked by lateral anodal stimulation. We will refer to this as an L2 volley. The mean data at rest and during voluntary contraction are shown in Fig. 4 for the five patients in whom this was examined. Although the mean amplitude of the total volley (the sum of the amplitudes of all individual waves) increased by 30 % during voluntary contraction, the difference was not statistically significant (P > 0.05). Because of the limited number of electrical stimuli given to each patient, we were not able to determine the effects on individual L1 and L2 volleys, nor could we determine whether voluntary contraction had any effect on the threshold of the responses to either vertex or lateral stimulation.
Magnetic stimulation
PA stimulation
The mean AMT was 52 ± 12 % of stimulator output. The lowest-threshold volley evoked by magnetic stimulation had a mean latency of 7.4 ± 0.3 ms in subjects 1-4, who had similar electrode locations. In patients 5 and 6, the latency was 5.8 and 5.0 ms, respectively. In all cases the value was some 1.4 ms longer than the L1 volley evoked by lateral anodal stimulation and corresponded to the latency of the L2 volley evoked by vertex anodal stimulation. The initial volley increased in size and was followed by later volleys as the intensity of stimulation was increased (Fig. 1 and 2). We will refer to these volleys as L3, L4 and L5. The mean interpeak interval between the later waves was 1.6 ± 0.2 ms (range 1.4-1.8 ms). An earlier small wave appeared at a stimulus intensity of 25 % of the stimulator output above AMT (corresponding to 150 % AMT) in patient 1, 35 % (corresponding to 160 % AMT) in patient 2 and 30 % (corresponding to 140 % AMT) in patient 3. This volley had the same latency as the L1 volley recorded following lateral electrical stimulation. The threshold of this volley was not modified by voluntary contraction.
Voluntary contraction had two effects on the volleys evoked by PA magnetic stimulation. First, it appeared that the threshold for evoking recognisable activity was lower during voluntary contraction than at rest. During voluntary contraction a descending wave was seen at 5-10 % of stimulator output below the threshold for recognisable activity at rest in all patients but one (patient 5). The second effect was that at virtually all intensities, the amplitude of each volley, apart from the L1 volley evoked at high intensities of stimulation, was higher during activity than at rest (Fig. 4). The increase in the grand mean amplitude of the total volley (the sum of the amplitudes of all the individual waves) was 81 % (P < 0.05).
ML stimulation (patients 1-3 only)
Although we have termed this form of stimulation ‘medio-lateral’, this is true only in so far as it relates to the EMG responses recorded in leg muscles. Thus, if we were recording the EMG from the left leg, then ML stimulation means that the induced current flow in the brain was from left to right across the leg area, as viewed from above. However, the descending volleys that were recorded at the same time as the EMG could contain descending activity from either hemisphere. In this case, the activity would be a mixture of volleys evoked by ML stimulation of the right hemisphere and LM stimulation of the left hemisphere.
AMT was 50 % of the stimulator output in patient 1, 45 % in patient 2 and 70 % in patient 3. At threshold stimulus intensities, ML magnetic stimulation evoked a single negative wave with the same latency as the volley evoked in the same patients by threshold PA magnetic stimulation (an L2 volley). This volley increased in size and was followed by later volleys as the intensity of stimulation was increased (Fig. 1). An earlier small wave appeared at a stimulus intensity of 25 % of stimulator output above AMT in patients 1 and 2 and 30 % in patient 3; this volley had the same latency as the earliest volley recorded following lateral electrical stimulation (an L1 volley).
As with PA stimulation, voluntary contraction reduced the threshold for evoking a descending volley. During contraction, a descending wave was seen at 10 % of stimulator output below the resting threshold in patients 1 and 2 and at 20 % of stimulator output below rest threshold in patient 3. In addition, at virtually all intensities, the amplitude of the volleys was higher during activity than at rest (Fig. 4). Although the mean amplitude of the total volley (the sum of the amplitudes of all individual waves) increased by 39 %, the difference was not statistically significant (P > 0.05). Because of the limited number of patients studied, a total of three, we were not able to determine the effects of voluntary contraction on individual volleys.
Interaction between the electrical and magnetic stimuli
In patient 4, we gave a threshold electrical stimulus at the vertex either 100 or 500 μs before a threshold magnetic stimulus, to test whether the response to both stimuli was greater than the response to the sum of each alone. There was facilitation of the descending wave and of the subsequent EMG responses at either ISI (Fig. 5). If the electrical stimulus was moved to 2 cm lateral to the vertex, then there was no facilitation (not illustrated and also performed in patient 5).
Figure 5. Descending volleys and EMG responses evoked by a threshold magnetic stimulus alone, a vertex anodal stimulus alone and both stimuli together.
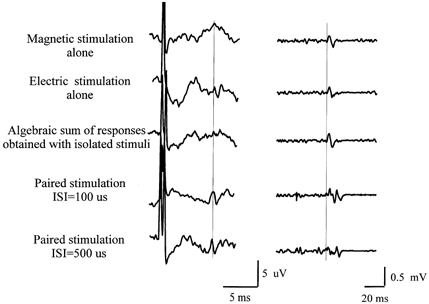
Descending volleys (left) and EMG responses (right) evoked by a threshold magnetic stimulus alone (top traces) and a vertex anodal stimulus alone (second traces). The third trace is the electronic sum of the first two traces, whilst the fourth and bottom traces show the actual result of giving both stimuli together at an interval of 100 μs (fourth traces) and 500 μs (bottom traces). Stimulus intensity was just over AMT for both types of stimulation. There is little recognisable descending activity when magnetic or electrical stimuli are delivered alone, whereas there is a clear descending wave when both stimuli are delivered together at both interstimulus intervals (ISIs) studied. Note the corresponding increase in amplitude of the EMG response recorded simultaneously in the tibialis anterior muscle.
Intracortical inhibition
Paired stimulation of the motor cortex was performed in patients 1 and 4. Figure 6 shows the averaged descending volleys recorded in patient 1. The responses to a magnetic test stimulus given alone and a test stimulus conditioned by a subthreshold shock are superimposed for two different ISIs. The test magnetic shock alone evoked several waves, with the earliest recognisable wave (an L2 volley) having a latency 1.3 ms longer than the L1 volley evoked in the same patient by lateral anodal stimulation. The later waves were clearly suppressed when preceded by a conditioning shock given 2 or 3 ms earlier. In contrast, the first two descending waves (L2 and L3 volleys) were virtually unaffected at either interval. Indeed, in this patient, the second of these was facilitated.
Figure 6. Epidural volleys and EMG responses in the tibialis anterior muscle evoked by a test stimulus alone and when conditioned by a subthreshold stimulus presented 2 or 3 ms earlier.
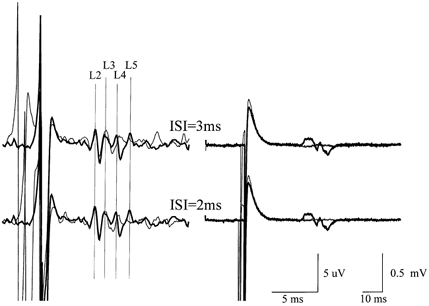
Epidural volleys (left) and EMG responses in the tibialis anterior muscle (right) evoked by a test stimulus alone (thick traces) and when conditioned by a subthreshold stimulus (thin traces) given 2 or 3 ms earlier in patient 1. Recordings were performed at rest. Each trace is the mean of 10 sweeps. The test stimulus evoked four waves (labelled L2, L3, L4 and L5) and a small EMG response. The L2 wave has a latency 1.1 ms longer than the earliest wave evoked by lateral anodal stimulation. When both stimuli were delivered, the last two descending volleys were suppressed, whilst the first and second waves were not modified. The EMG response was almost abolished.
Brainstem stimulation
Brainstem stimulation was performed only in one anaesthetised subject. Brainstem stimulation evoked a single negative volley with a latency of 1.9 ms, which was 1.7 ms earlier than the volley evoked by lateral anodal stimulation (Fig. 7).
Figure 7. Epidural volleys evoked by brainstem stimulation and lateral anodal stimulation in one anaesthetised patient undergoing surgery for an intramedullary tumour.
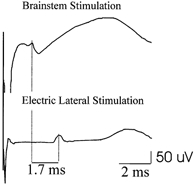
The epidural electrode is located at the D2 level. Each trace is the mean of ten sweeps. Lateral anodal stimulation evoked a single negative wave (L1) with a latency of 3.6 ms. The volley evoked by brainstem stimulation appeared 1.7 ms earlier.
DISCUSSION
Characteristics of epidural volleys
The volleys evoked by different forms of electrical and magnetic stimulation had similar latencies. In this discussion we assume that volleys with the same latency are likely to be produced by similar mechanisms. As for hand area stimulation, we presume that these volleys represent the repetitive activation of the same population of large-diameter axons rather than the activation of populations of axons with different diameters and conduction velocities. Consistent with this is the observation that the interval between the first two volleys was the same in patients 1-4 (mean 1.3 ms, range 1.1-1.6 ms) as it was in patients 5 and 6 (1.5 and 1.7 ms, respectively), even though the electrodes were located at D10 in the former and at D3 and D2, respectively, in the latter. If the 1.3 ms difference in latency at D10 had been due to differences in corticospinal conduction velocity, then it can be calculated that the interpeak latency at D3 should have been 1.0 ms rather than the 1.5 ms that was observed.
Site of initiation of the descending volleys
The shortest latency volley, L1, was not influenced by changes in cortical excitability produced by voluntary contraction, whereas the later volleys (L2, L3, etc.) were larger if the stimuli were given during tonic voluntary contraction. Previous work on the hand area has shown that D waves are unaffected by the level of voluntary contraction (Di Lazzaro et al. 1999), whereas I waves are usually facilitated (Di Lazzaro et al. 1998b). By analogy, we presume that L1 is a D wave.
The question remains as to the level at which this D wave is initiated. Is it initiated in the immediately subcortical white matter, close to the pyramidal neurones, as suggested by Priori et al. (1993), Houlden et al. (1999) and Terao et al. (2000)? In this case, L1 corresponds to a conventional D wave, L2 to an I1 wave, and L3 to an I2 wave. Alternatively, is the L1 wave initiated at a deep site, equivalent to the D2 wave of Burke et al. (1990, 1993), as suggested by Nielsen et al. (1995)? In this case, L1 becomes a D2 wave, L2 a D0 wave (initial segment activation, where it is sensitive to the level of cortical excitability) and L3 an I1 wave.
The arguments rest on timing estimates relative to a known site of stimulation. In both the present report and that of Nielsen et al. (1995), the latter is the site activated by transmastoidal (‘brainstem’) electrical stimulation, which is thought to correspond to the level of the pyramidal decussation (Ugawa et al. 1991). Nielsen et al. (1995) used estimates of conduction velocity and distance to conclude that the conduction time from a site near the vertex to the brainstem is 2.5-3.0 ms. They measured the latency difference between EMG responses elicited by lateral anodal and brainstem stimulation to be 1.8 ms. They therefore concluded that lateral anodal stimulation activated corticospinal fibres at a deep site. Responses evoked by vertex anodal stimulation occurred 1-1.5 ms later and therefore were supposed to arise from a site near the vertex.
The values for conduction times in the present report, made on the basis of measurement of descending volleys, are similar to those reported by Nielsen et al. (1995). Thus, in the one patient we tested in this way, the interval between the wave evoked by lateral anodal and transmastoid (‘brainstem’) stimulation was 1.7 ms. It should be noted that this recording was performed in an anaesthetised patient because we did not have ethical approval to perform ‘brainstem’ stimulation in conscious patients. Therefore, we cannot be completely certain that the initial volley produced by lateral anodal stimulation was the same L1 wave as we had observed in conscious patients. Nevertheless, the identification seems likely since although the anaesthetic may affect the amplitude of D waves from the hand area (Burke et al. 2000), it does not change the order of recruitment, at least in the hand area.
Despite the similarity between our values and those of Nielsen et al. (1995), we would like to suggest a different interpretation of the data. Rather than using indirect estimates of vertex to brainstem conduction time, we have compared the latencies with those obtained from experiments on the hand area. At this site, several lines of evidence suggest that the conduction time from the conventional site of D wave activation to the brainstem is around 1.7 ms, rather than 3 ms.
(1) Threshold anodal stimulation of the hand area is thought to activate corticospinal axons in the subcortical white matter. At such intensities, the latency difference between EMG responses evoked in active muscle by cortical and brainstem stimulation is 1.7-1.8 ms (Ugawa et al. 1991).
(2) The latency difference between descending volleys evoked by threshold anodal stimulation of the hand area and brainstem stimulation is 1.6 ms (Rothwell et al. 1994).
(3) Thompson et al. (1991) recorded descending volleys at the cervico-medullary junction after threshold anodal stimulation of the hand area with a latency of 1.8 ms.
(4) For comparison, threshold electrical stimulation of the hand area evokes descending volleys at a high cervical electrode with a latency of 2.2 ms (Di Lazarro et al. 1999).
If we assume that the conduction distance from the vertex to the brainstem is approximately the same as that from the hand area to the brainstem, then lateral anodal stimulation activates corticospinal axons near the vertex, and not in the deep white matter as suggested by Nielsen et al. (1995). In other words, the L1 volley is equivalent to a conventional D wave.
This conclusion is consistent with two other features of the present results. First, the latency difference between L1 and L2 volleys was 1.4 ms. This is the same as the difference between D and I1 waves in the hand area. However, if the L1 volley had been equivalent to the D2 wave (deep site of stimulation) and L2 to initial segment activation, we would have expected the latency difference to be 0.8 ms (see Burke et al. 1990, 1993). Second, we were able to evoke the L1 volley using high-intensity magnetic stimulation in most of the patients we studied. Since magnetic stimulation, especially with the standard flat figure-of-eight coil that we used, is not thought to penetrate very deep into the brain, it seems likely that the L1 volley was initiated at a fairly superficial site (see also arguments in Terao et al. 2000), and was therefore not a D2 wave.
It should be noted that these arguments depend upon the assumption that the conduction velocity and conduction distance from the cortex to the site of brainstem activation are similar for pyramidal tract fibres originating in the hand and the leg area. They also assume that the fastest fibres activated by brainstem stimulation have the same conduction velocity as the fastest fibres activated by transcranial stimulation. If there were any substantial violations of these assumptions, then our identification of the site of activation of the L1 volley would be insecure.
Behaviour of the volleys after paired-pulse stimulation
Experiments with pairs of stimuli were designed to test whether interactions between stimuli behaved similarly in the leg area as in the arm area. Those obtained using anodal followed by magnetic stimuli at very short (< 1 ms) intervals were designed to mimic those of Rothwell et al. (1992) on the hand area. In the hand area, there was facilitation between the D waves evoked by anodal or latero-medial magnetic stimulation at ISIs of 100 μs but not at 500 μs. Rothwell et al. (1992) took this as evidence that the two forms of stimulation were interacting at a site with a very short time constant, most probably at the nodal membrane of the corticospinal axons. The interaction that we observed in the present experiments concerned the L2 volley, and the behaviour was not the same as for the arm area. The two types of stimuli facilitated each other, but with a time course longer than 500 μs. This indicates that the stimuli interacted at a site other than an axonal membrane. There are two probable explanations for this result if we assume that the L2 volley is an I1 wave. First, the L2 volley might be initiated at the initial segment region of cortical interneurones. Since this would be expected to have a longer time constant than the axon, the two forms of stimulation might interact here. Alternatively, electrical stimulation could evoke one set of I wave inputs to the corticospinal neurones, and magnetic stimulation another set. The EPSPs from both would summate readily at the pyramidal neurones and again produce temporal facilitation of the descending L2 volley. Effectively, the sets of cortical interneurones activated by electrical and magnetic stimulation must be partially non-overlapping.
The experiments that examined intracortical inhibition with paired magnetic pulses were also designed to test whether the behaviour observed after stimulation of the hand area could be seen after stimulation over the leg area. Intracortical inhibition in the hand area affects the I2 and later waves, but never the I1 or D wave (Di Lazzaro et al. 1998c; Hanajima et al. 1998). The present data from the leg area indicate a preferential affect on the L4 and later volleys. If the L1 volley is a conventional D wave, then this means that the I3 wave (L4 volley) is selectively targeted by intracortical inhibition in the leg area. If so, this would differ from the results in the arm area, where the I2 wave is clearly affected by intracortical inhibition.
Conclusions
From the present data we have argued that the earliest volley (L1) evoked by electrical or magnetic stimulation of the leg area is a conventional D wave that is initiated in the subcortical white matter. Later volleys are I waves. In contrast to the behaviour seen after transcranial electrical stimulation of the hand area, in some individuals, vertex anodal stimulation can preferentially evoke an I1 wave. Since this is sensitive to the excitability of the leg area of the cortex, such stimulation is not a good way of distinguishing between interventions that produce changes in cortical or spinal excitability. A better method is to use lateral anodal stimulation, which always evokes an initial D wave that is insensitive to changes in cortical excitability.
References
- Burke D, Bartley K, Woodforth IJ, Yakoubi A, Stephen JP. The effects of a volatile anaesthetic on the excitability of human corticospinal axons. Brain. 2000;123:992–1000. doi: 10.1093/brain/123.5.992. [DOI] [PubMed] [Google Scholar]
- Burke D, Hicks R, Gandevia SC, Stephen J, Woodforth I, Crawford M. Direct comparison of corticospinal volleys in human subjects to transcranial magnetic and electrical stimulation. Journal of Physiology. 1993;470:383–393. doi: 10.1113/jphysiol.1993.sp019864. [DOI] [PMC free article] [PubMed] [Google Scholar]
- Burke D, Hicks RG, Stephen JP. Corticospinal volleys evoked by anodal and cathodal stimulation of the human motor cortex. Journal of Physiology. 1990;425:283–299. doi: 10.1113/jphysiol.1990.sp018103. [DOI] [PMC free article] [PubMed] [Google Scholar]
- Day BL, Dressler D, Maertens De Noordhout A, Marsden CD, Nakashima K, Rothwell JC, Thompson PD. Electric magnetic stimulation of human motor cortex: surface EMG and single motor unit responses. Journal of Physiology. 1989;412:449–473. doi: 10.1113/jphysiol.1989.sp017626. [DOI] [PMC free article] [PubMed] [Google Scholar]
- Di Lazzaro V, Oliviero A, Profice P, Insola A, Mazzone P, Tonali P, Rothwell JC. Effects of voluntary contraction on descending volleys evoked by transcranial electrical stimulation over the motor cortex hand area in conscious humans. Experimental Brain Research. 1999;124:525–528. doi: 10.1007/s002210050649. [DOI] [PubMed] [Google Scholar]
- Di Lazzaro V, Oliviero A, Profice P, Saturno E, Pilato F, Insola A, Mazzone P, Tonali P, Rothwell JC. Comparison of descending volleys evoked by transcranial magnetic and electric stimulation in conscious humans. Electroencephalography and Clinical Neurophysiology. 1998a;109:397–401. doi: 10.1016/s0924-980x(98)00038-1. [DOI] [PubMed] [Google Scholar]
- Di Lazzaro V, Restuccia D, Oliviero A, Profice P, Ferrara L, Insola A, Mazzone P, Tonali P, Rothwell JC. Effects of voluntary contraction on descending volleys evoked by transcranial stimulation in conscious humans. Journal of Physiology. 1998b;508:625–633. doi: 10.1111/j.1469-7793.1998.625bq.x. [DOI] [PMC free article] [PubMed] [Google Scholar]
- Di Lazzaro V, Restuccia D, Oliviero A, Profice P, Ferrara L, Insola A, Mazzone P, Tonali P, Rothwell JC. Magnetic transcranial stimulation at intensities below active motor threshold activates intracortical inhibitory circuits. Experimental Brain Research. 1998c;119:265–268. doi: 10.1007/s002210050341. [DOI] [PubMed] [Google Scholar]
- Hanajima R, Ugawa Y, Terao Y, Sakai K, Furubayashi T, Machii K, Kanazawa I. Paired pulse magnetic stimulation of the human motor cortex: differences among I-waves. Journal of Physiology. 1998;509:607–618. doi: 10.1111/j.1469-7793.1998.607bn.x. [DOI] [PMC free article] [PubMed] [Google Scholar]
- Houlden DA, Schwartz ML, Tator CH, Ashby P, Mackay WA. Spinal cord-evoked potentials and muscle responses evoked by transcranial magnetic stimulation in 10 awake human patients. Journal of Neuroscience. 1999;19:1855–1862. doi: 10.1523/JNEUROSCI.19-05-01855.1999. [DOI] [PMC free article] [PubMed] [Google Scholar]
- Iles JF, Cummings R. Electrical and magnetic stimulation of motor cortex in man. Journal of Physiology. 1992;452:287P. [Google Scholar]
- Kaneko K, Kawai S, Fuchigama Y, Morita H, Ofuji A. The effect of current direction induced by transcranial magnetic stimulation of the corticospinal excitability in human brain. Electroencephalography and Clinical Neurophysiology. 1996;101:478–482. doi: 10.1016/s0013-4694(96)96021-x. [DOI] [PubMed] [Google Scholar]
- Kujirai T, Caramia MD, Rothwell JC, Day BL, Thompson PD, Ferbert A, Wroe S, Asselman P, Marsden CD. Corticocortical inhibition in human motor cortex. Journal of Physiology. 1993;471:501–519. doi: 10.1113/jphysiol.1993.sp019912. [DOI] [PMC free article] [PubMed] [Google Scholar]
- Nakamura H, Kitagawa H, Kawaguchi Y, Tsuji H. Direct and indirect activation of human corticospinal neurones by transcranial magnetic and electrical stimulation. Neuroscience Letters. 1996;24:45–48. doi: 10.1016/0304-3940(96)12659-8. [DOI] [PubMed] [Google Scholar]
- Nielsen J, Petersen N, Ballegaard M. Latency of effects evoked by electrical and magnetic brain stimulation in lower limb motoneurones in man. Journal of Physiology. 1995;484:791–802. doi: 10.1113/jphysiol.1995.sp020704. [DOI] [PMC free article] [PubMed] [Google Scholar]
- Nielsen J, Petersen N, Deuschl G, Ballegaard M. Task-related changes in the effect of magnetic brain stimulation on spinal neurones in man. Journal of Physiology. 1993;471:223–243. doi: 10.1113/jphysiol.1993.sp019899. [DOI] [PMC free article] [PubMed] [Google Scholar]
- Priori A, Bertolasi L, Dressler D, Rothwell JC, Day BL, Thompson PD, Marsden CD. Transcranial electric and magnetic stimulation of the leg area of the human motor cortex: single motor unit and surface EMG responses in the tibialis anterior muscle. Electroencephalography and Clinical Neurophysiology. 1993;89:131–137. doi: 10.1016/0168-5597(93)90095-7. [DOI] [PubMed] [Google Scholar]
- Rothwell JC, Burke D, Hicks R, Stephen J, Woodforth I, Crawford M. Transcranial electrical stimulation of the motor cortex in man: further evidence for the site of activation. Journal of Physiology. 1994;481:243–250. doi: 10.1113/jphysiol.1994.sp020435. [DOI] [PMC free article] [PubMed] [Google Scholar]
- Rothwell JC, Day BL, Amassian VE. Near threshold electrical and magnetic transcranial stimuli activate overlapping sets of cortical neurones in humans. Journal of Physiology. 1992;452:109P. [Google Scholar]
- Terao Y, Ugawa Y, Hanajima R, Machii K, Furubayashi T, Mochizuki H, Enomoto H, Shiio Y, Uesugi H, Iwata NK, Kanazawa I. Predominant activation of I1-waves from the leg motor area by transcranial magnetic stimulation. Brain Research. 2000;859:137–146. doi: 10.1016/s0006-8993(00)01975-2. [DOI] [PubMed] [Google Scholar]
- Thompson PD, Day BL, Crockard HA, Calder I, Murray NMF, Rothwell JC, Marsden CD. Intra-operative recording of motor tract potentials at the cervico-medullary junction following scalp electrical and magnetic stimulation of the motor cortex. Journal of Neurology, Neurosurgery and Psychiatry. 1991;54:618–623. doi: 10.1136/jnnp.54.7.618. [DOI] [PMC free article] [PubMed] [Google Scholar]
- Ugawa Y, Rothwell JC, Day BL, Thompson PD, Marsden CD. Percutaneous stimulation of corticospinal pathways at the level of the pyramidal decussation in humans. Annals of Neurology. 1991;29:418–427. doi: 10.1002/ana.410290413. [DOI] [PubMed] [Google Scholar]
- Werhahn KJ, Fong JK, Meyer BU, Priori A, Rothwell JC, Day BL, Thompson PD. The effect of magnetic coil orientation on the latency of surface EMG and single motor unit responses in the first dorsal interosseous muscle. Electroencephalography and Clinical Neurophysiology. 1994;93:138–146. doi: 10.1016/0168-5597(94)90077-9. [DOI] [PubMed] [Google Scholar]