

Abstract
We have developed a technique that permits time-lapse imaging of retinal ganglion cells (RGCs), their dendritic arbors and their axons in mammals in vivo. This technique utilizes a standard confocal laser scanning microscope, transgenic mice that express yellow fluorescent protein (YFP) in a subset of RGCs and survival anesthesia techniques. The same individual RGCs with their dendritic arbors and axons were multiply imaged in vivo in both adult and juvenile mice. Additionally, the same RGC that was imaged in vivo could then be located and imaged in fixed retinal whole mount preparations. This novel technique has many potential applications.
INTRODUCTION
A full understanding of dynamic cellular processes would benefit from the ability to observe the same cells over time rather than viewing populations of cells cross-sectionally at various time points (Lichtman and Fraser, 2001). Recently, a convergence of technological advances in molecular biology and fluorescence imaging has made it possible to image individual mammalian neurons and their processes in vivo in time-lapse fashion in both the peripheral nervous system (Walsh and Lichtman, 2003) and in the brain (Grutzendler et al., 2002; Trachtenberg et al., 2002). In the retina, time-lapse imaging of individual RGCs and their dendritic processes has been possible in living zebrafish (Mumm et al., 2006; Zolessi et al., 2006). In mammals, RGC bodies have been imaged in vivo using various imaging techniques (Sabel et al., 1997; Engelmann and Sabel, 1999; Thanos et al., 2002; Cordeiro et al., 2004; Seeliger et al., 2005; Gray et al., 2006; Higashide et al., 2006). For technical reasons, in vivo imaging of individual RGCs and their dendritic arbors, which require higher resolution to image, has not been previously possible in mammals (Chalupa, 2006; Morgan et al., 2005). Time-lapse studies have provided unexpected findings regarding cellular behavior relative to what can be inferred about dynamic processes from sequential time point data (Walsh and Lichtman, 2003; Grutzendler et al., 2002; Trachtenberg et al., 2002; Mumm et al., 2006).
Thus, the ability to resolve individual RGCs and their processes in mice over time may provide new avenues of research in both normal neurophysiology and in the study of mutant or disease models. In this report, we describe a novel technique by which individual RGCs along with their dendrites and axons can be imaged in living mice in time-lapse fashion using a readily-available confocal laser scanning microscope with minimal customization.
MATERIALS AND METHODS
Animals
All protocols were approved and monitored by the Animal Care Committee of the Johns Hopkins University School of Medicine and conform to the ARVO Statement for the Use of Animals in Ophthalmic and Vision Research. The YFP-H line of transgenic mice which express cytoplasmic YFP in a small subset of RGCs (Feng et al., 2000) was obtained from The Jackson Laboratory (strain: B6.Cg-Tg(Thy1-YFPH)2Jrs/J; Bar Harbor, Maine). This is one line of many that express spectral variants of GFP under the relatively neuron specific modified Thy1 promoter. Expression of the YFP appears to be innocuous to neuronal development, and neurons tolerate prolonged fluorescence imaging in both the peripheral and central nervous systems (Walsh and Lichtman, 2003; Grutzendler et al., 2002; Feng et al., 2000). Individual lines have different patterns of expression; some have all RGCs labeled, while in others many, few or none are labeled. This variation may be due to modifying effects of genetic sequences near the random location of transgene insertion into the chromosome (Lichtman and Sanes, 2003). For the present work, lines that express in only a subset of RGCs are more advantageous, as this permits the resolution of individual neurons and their processes. At the same time, interpretations of research with these lines are subject to whatever selection bias for RGC expression may be present.
In vivo imaging
Adult and juvenile mice were anesthetized with an anesthetic cocktail consisting of ketamine 7.5 mg/ml, xylazine 1.3 mg/ml, and acepromazine 0.2 mg/ml (Arras et al., 2001) given intraperitoneally (IP) with a 30 g needle. Injecting half the recommended dosage (0.05 ml/10 gm body weight) IP followed by an injection of ketamine only IP (0.03 ml/10 gm body weight of ketamine 20 mg/ml) 10 min later led to sufficient anesthesia (little or no foot pinch response) in both adult and juveniles for approximately 1 – 2 h with less than 10% of animals dieing from overdose with this technique.
We topically anesthetized the cornea with proparacaine 0.5% and dilated the pupil with topical tropicamide 1%. Approximately 1 min later, a drop of viscous hydroxypropyl methylcellulose (Goniosol, CIBA Vision Ophthalmics, Atlanta, GA) was placed on the eye. A glass coverslip (24 mm x 30 mm x 0.13–0.17 mm, Fisher Scientific) was then placed on the eye. This coverslip kept the eye moist throughout the imaging procedure and nullified the refractive power of the mouse’s cornea thus permitting imaging of the retinal plane using the optics of the microscope. Additionally, the coverslip also helped to dampen any motion artifact from the animal’s breathing. The contralateral eye was taped closed to prevent desiccation.
The mouse was then placed on a custom-designed (MKW and David Kays, Wilmer Eye Institute) aluminum, heated, microscope stage (Fig. 1) that was fit to the inverted laser scanning confocal microscope (LSM 510 Meta, Carl Zeiss Inc, Thornwood, NY). A heating element was fixed to the underside of the stage with a separate custom-built heat controller (David Kays) that was set to keep the stage temperature at 37 degrees C. Alternatively, warm water in a plastic bag can be placed over the animal to keep it warm or a commercial temperature controller may be used (e.g., Cole-Palmer temperature controller). The aluminum stage was recessed 1 cm relative to the normal microscope stage to provide the proper position for the objective lens to image the retina. A 6 mm hole was placed in the base of the stage and the mouse eye with coverslip was oriented for imaging through this hole (the objective is below the stage in this inverted microscope). The area around the central hole in the stage was machined to create a central depression for the mouse. By repositioning the mouse, different areas of the retina can be imaged.
Figure 1. Custom designed microscope stage with mouse.

Top Left: top view of the aluminum stage with a central depressed 6 mm window for imaging. Top Middle: underside view with heating element. Top Right: mouse in imaging position. Lower Left: side view of aluminum stage. Lower Middle: oblique view of aluminum stage. Lower Right: mouse in imaging position; note glass coverslip.
Using proprietary Zeiss image acquisition software, individual RGCs were imaged by focusing deep to the lens and vitreous of the mouse eye with either 5x or 10x air objectives (5x Plan-Apochromat/0.16 numerical aperture (NA), 10x Plan-Neo/0.3 NA, Carl Zeiss Inc.) using the 514 nm argon laser and 530 – 600 nm band pass filter. High quality RGCs images were not able to be obtained with higher magnification and NA lenses available to us. It may be possible to obtain higher quality images with higher NA lenses with varying working distances although ultimate resolution may be limited by aberrations imparted by the mouse eye itself. Due to movement artifact from the mouse’s breathing, high scan speeds were needed, and single z plane images were acquired. Typically, the confocal pinhole aperture was left considerably open in order to optimize fluorescent signal acquisition (see individual figures for specific acquisition settings).
After imaging, the coverslip was removed, and the methylcellulose was rinsed from the eye with saline and ophthalmic lubricating ointment (Lacri-Lube, Allergan, Irvine, CA) was placed over the eye. There were no instances of corneal damage or clouding noted either during the imaging sessions or subsequently. The mouse was wrapped in gauze on a plastic bag filled with warm water and allowed to recover. Typically the mouse was active 2 – 4 hr after the initial anesthesia injections.
The same mouse could then be re-imaged and survived on a subsequent day using the same imaging protocol. This process can be repeated multiple times over varying time courses as anesthetic lethality was not a significant problem and no instances of corneal damage were noted. Given the small numbers of RGCs that are labeled in each retina, the same individual RGC of interest could be found based on its morphology and neighboring YFP-positive neurons.
Whole mount retina
Mice were sacrificed by overdose with the above anesthesia. The superior limbus was marked by light cautery for orientation purposes. The eye of interest was then removed using Vannas scissors and forceps with 0.12 mm teeth. The eye was placed in 4% paraformaldehyde in 0.1 M phosphate buffer for 1 hr. The cornea and lens were then removed with Vannas scissors. Relaxing incisions were made in the peripheral retina, and a spatula was used to remove the retina from the retinal pigment epithelium. The retina was mounted on a slide with Vectashield (Vector Laboratories) and a coverslip and imaged with the same confocal microscope used for in vivo imaging (5x, 10x, 20x Plan-Apo/0.75 NA, and 40x oil Plan-Neofluar/1.3 NA objectives, Carl Zeiss Inc.) using the 514 nm argon laser and 530 – 600 nm band pass filter.
No image processing or adjustment of signal curves was performed. Figures were made using Adobe Photoshop.
RESULTS
Fixed tissue imaging: Retinal ganglion cells
Approximately 20 transgenic mice expressing YFP, a spectral variant of green fluorescent protein (GFP), in a small subset of RGCs (Feng et al., 2000) were utilized for these studies (The Jackson Laboratory; strain: B6.Cg-Tg(Thy1-YFPH)2Jrs/J; Bar Harbor, Maine). In these mice, typically 50 – 100 RGCs in each retina express YFP (Fig. 2) out of an estimated 50,000 RGCs in the mouse retina (Quigley HA, unpublished data). Because the YFP is expressed cytoplasmically, it fills both cell bodies and processes including dendritic arborizations and axons (Fig. 3). As in the GFP-M transgenic line (Lin and Masland, 2005), the YFP-H transgenic line that we have utilized also contains various morphologic subtypes of fluorescent RGCs (Fig. 4). As in peripheral motor neurons, the level of fluorescence intensity can vary among YFP-positive neurons in these transgenic mouse lines (Walsh MK and Lichtman JW, unpublished data, 2000).
Figure 2. Subset of retinal ganglion cells (RGCs) expresses yellow fluorescent protein (YFP).
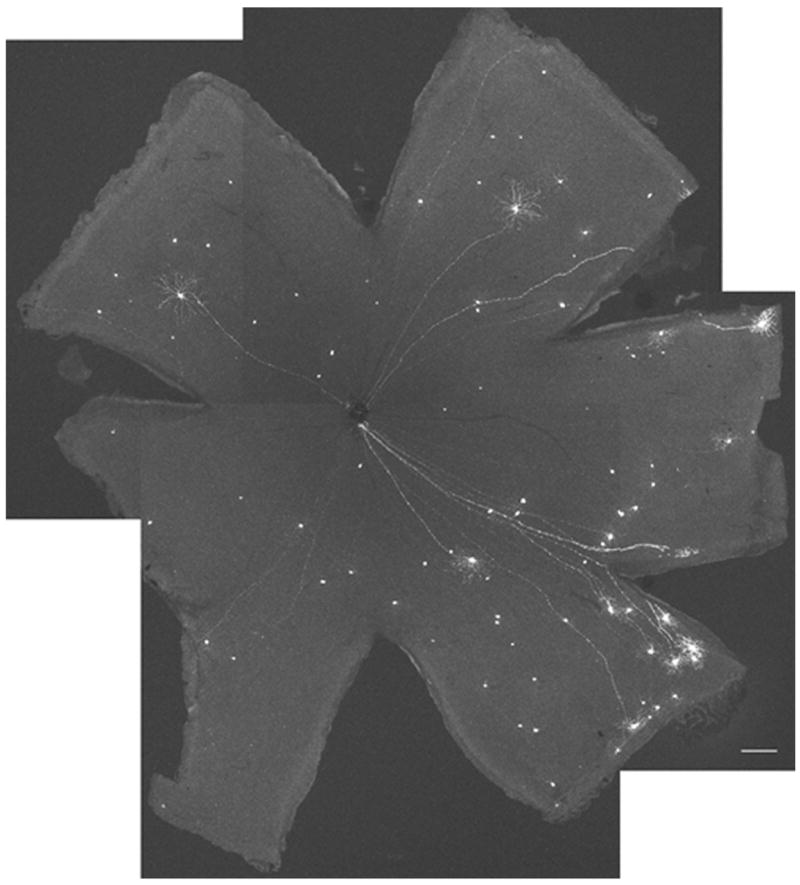
This is a montage of a whole mount fixed adult mouse retina from the YFP-H transgenic line. Typically 50 – 100 RGCs are YFP positive. The intensity of YFP fluorescence can vary among the positive neurons. Acquisition settings: 5x objective, 0.7 zoom, stack size: 2606 μm x 2606 μm x 127–211 μm, pixel size: 2.54 μm x 2.54 μm x 21.1 μm, laser power 10%, pinhole 67 μm, pixel time 3.2 μs, projection, scale bar 200 μm.
Figure 3. YFP-positive retinal ganglion cell.
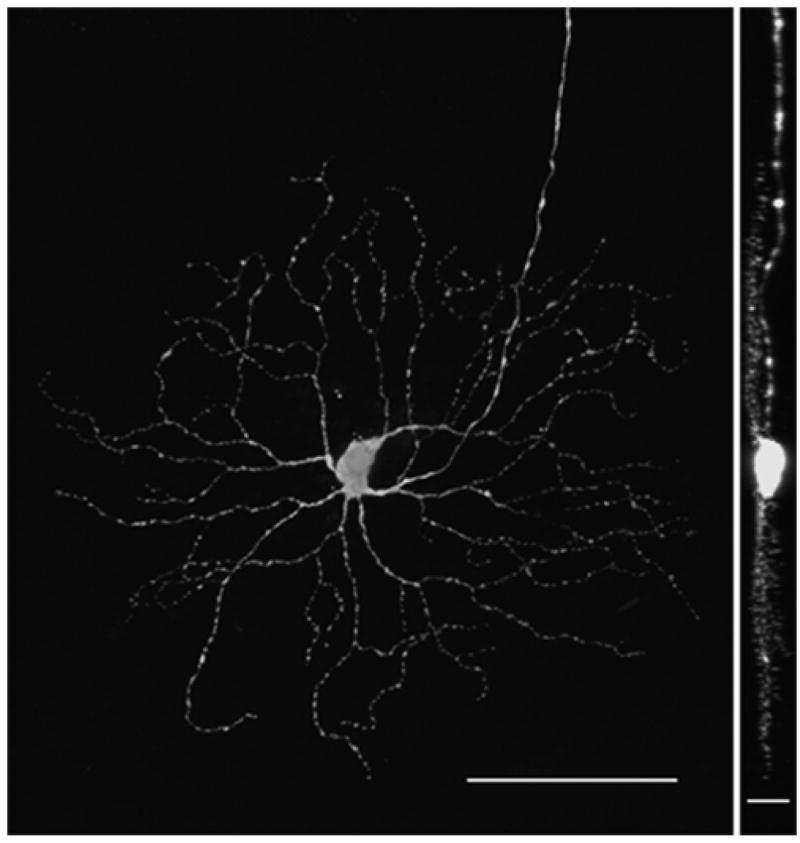
This is a single YFP-positive RGC in an adult fixed whole mount retina. The dendritic arbor and boutons are appreciated as well as the axon exiting the field of view superiorly. Left: en face view. Right: 90 degree view. Acquisition settings: 20x objective, no zoom, stack size: 461 x 461 x 26.5 μm, pixel size: 0.45 x 0.45 x 0.95 μm, pixel time 1.6 μs, laser power 10%, pinhole 61 μm, projections, scale bars: 100 μm (left) and 20 μm (right).
Figure 4. Multiple RGC morphologies and rare amacrine cell in fixed whole mount.

Various morphologic subtypes of RGCs are YFP-positive in these mice. Of approximately 500 YFP-positive retinal neurons screened, 2 non-RGCs were found, one of which is located inferiorly in this image. It appears to be a bistratified amacrine cell (See Figure 5). Left: en face view. Right: 90 degree view. Acquisition settings: 20x objective, no zoom, stack size: 461 x 461 x 38 μm, pixel size: 0.45 x 0.45 x 1 μm, pixel time 1.6 μs, laser power 10%, pinhole 61 μm, projections, scale bars: 50 μm (left) and 20 μm (right).
Fixed tissue imaging: Amacrine cells
Out of approximately 500 YFP-positive retinal neurons screened, two were found that appeared to be amacrine cells. In each of these two cases, the cell body stratified to what appeared to be the inner nuclear versus RGC layer and the dendritic arbor was bistratified to the inner plexiform layer with no apparent axon visible (Figs. 4, 5). These cells appear to be a unique type of amacrine cell similar to the bistratified amacrines in rabbit retina (MacNeil and Masland, 1998).
Figure 5. Rare YFP-positive amacrine cell.
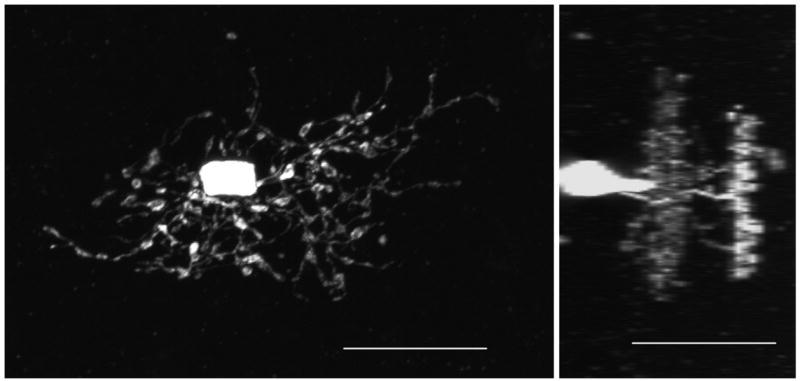
This is the same amacrine cell imaged in Figure 2 in whole mount fixed retina. Its dendritic tree is bistratified and is one of only 2 found out of approximately 500 screened YFP-positive neurons. The second amacrine cell had a similar morphology (data not shown). Left: en face view. Right: 90 degree view. Acquisition settings: 40x oil objective, 3x zoom, stack size: 77 x 77 x 33 μm, pixel size: 0.07 x 0.07 x 1 μm, pixel time 1.6 μs, laser power 10%, pinhole 71 μm, projections, scale bars: 20 μm (left) and 20 μm (right).
In vivo imaging
By imaging through the mouse cornea-lens axis, YFP-positive axons can be seen entering the optic nerve head in vivo (Fig. 6). Dendritic processes can also be resolved (Fig. 7). Cell bodies, dendrites and axons in the peripapillary region and near periphery were accessible for imaging. Although there were typically 10 – 15 RGC bodies that were YFP-positive in the peripapillary region, typically only 2 – 4 RGCs would have sufficient YFP intensity to permit visualization of dendritic details. Additionally, given the small numbers of cell bodies that were YFP-positive in the peripapillary area, individual cells that were imaged in vivo could then be located in whole mount fixed preparations of the retina (Fig. 8). As expected, relative to the whole mount images, the in vivo images are inverted by the eye’s optical properties.
Figure 6. In vivo imaging of RGC axons emanating from optic disc in adult mouse.
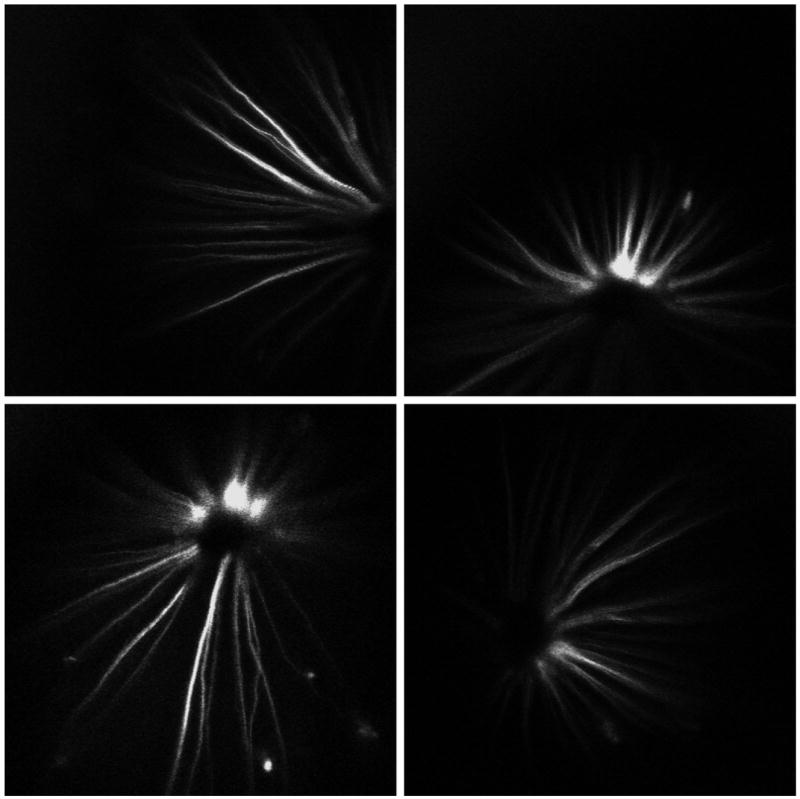
These are images taken in vivo from the right eye of an adult mouse showing multiple YFP-positive axons entering the optic nerve head and rare RGC bodies in the peripapillary region. Acquisition settings: 5x objective, no zoom, single image planes, pixel time 1.6 μs, laser power 53%, pinhole 1000 μm.
Figure 7. In vivo imaging of RGC dendritic arbor.

Using a 10x Plan-Neo/0.3 NA objective, this RGC’s dendritic arbor details were imaged in vivo (See also Figure 6). Acquisition settings: 10x objective, no zoom, single image plane, pixel time 1.6 μs, laser power 51%, pinhole 545 μm.
Figure 8. Single RGC imaged in vivo then in fixed whole mount.

Soon after anesthesia, this animal stopped breathing. Therefore these in vivo images, taken immediately after cessation of breathing, do not have breathing movement artifacts. Z stacks of images were thereby obtained. The eye was then fixed, and the same RGC was imaged in whole mount. Left panel acquisition settings: 5x objective, no zoom, z stack, projection, pixel time 1.6 μs, laser power 10%, pinhole 294 μm. Right panel: 20x objective, no zoom, stack size: 461 x 461 x 28 μm, pixel size: 0.45 x 0.45 x 1 μm, pixel time 1.6 μs, laser power 10%, pinhole 61 μm, projection, scale bar: 50 μm; fixed image inverted to match orientation of in vivo image.
Additionally, individual RGCs and their dendritic processes and axons were imaged in juvenile mice (Fig. 9). No significant differences in imaging characteristics or image quality were noted in juveniles versus adults. RGCs can also be time-lapse imaged in juvenile mice by re-imaging the same neurons on a subsequent day during a second anesthesia (Fig. 10). As the gross anatomy and location of labeled cells are static over these time periods, previous images can be used as maps to locate specific cell bodies and axons on subsequent imaging sessions. In adult mice, RGC bodies, dendrites, and axons can also be imaged on multiple occasions (Fig. 11). As expected there is gross stability in the dendritic branching pattern. Additionally, an individual RGC can be imaged multiple times, the animal sacrificed, the retina whole mounted, and the same RGC that was imaged in vivo can be easily located and imaged in the whole mount fixed preparation (Fig. 12) which makes it possible for immunohistochemical studies of RGCs for which in vivo time-lapse data have already been collected. As expected the resolution obtained in fixed tissue imaging is superior to that obtained in vivo, therefore the full extent of dendritic labeling is not captured in vivo as the resolution is limited by the optical apparatus of the mouse eye.
Figure 9. In vivo imaging in juvenile mouse.
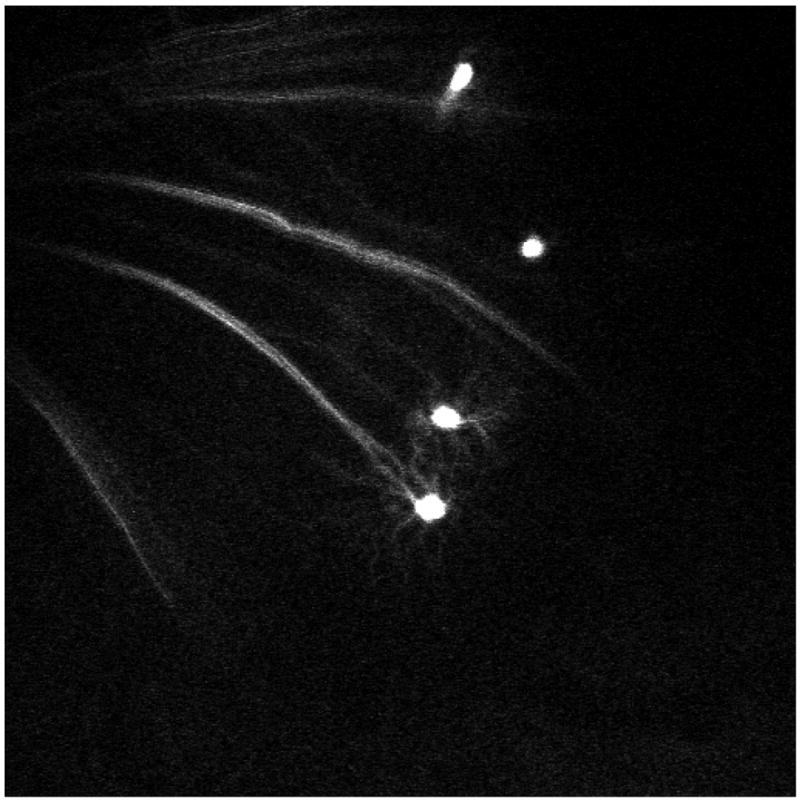
In this 4 week old mouse image, 4 RGC bodies can be appreciated. Dendritic details are apparent in 2 of the RGCs. Acquisition settings: 5x objective, no zoom, single image plane, pixel time 1.6 μs, laser power 52%, pinhole 761 μm.
Figure 10. In vivo time-lapse imaging in juvenile mouse.
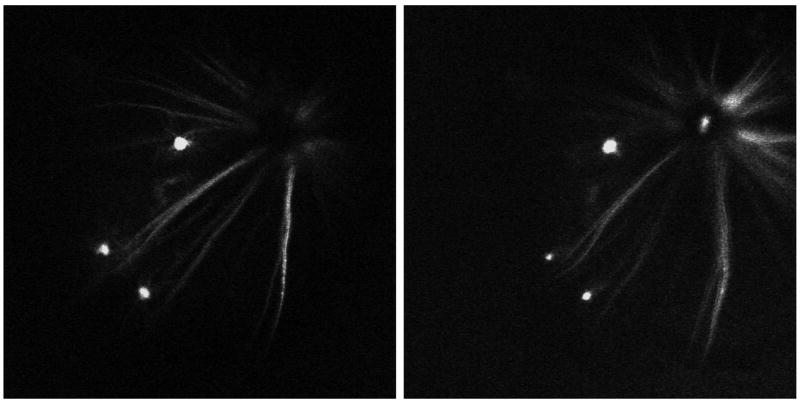
This 4 week juvenile mouse was imaged at day 0 (left), and then again on day 2 (right). 3 RGCs are appreciated in this peripapillary region. Acquisition settings: 5x objective, no zoom, single image plane, pixel time 1.6 μs; Day 0: laser power 51%, pinhole 454 μm; Day 2: laser power 52%, pinhole 670 μm.
Figure 11. In vivo time-lapse imaging in adult mouse.
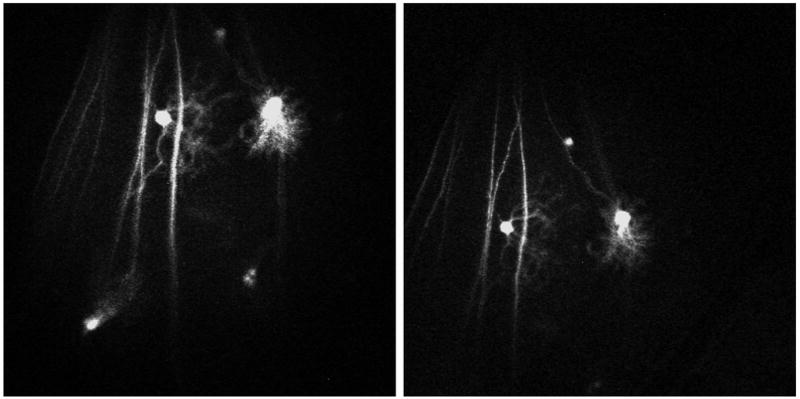
This region of the retina in an adult mouse was imaged in vivo, the animal was survived then imaged again 2 days later. The 2 central RGCs have differing dendritic morphologies which are grossly stable over the 2 day interval. Acquisition settings: 5x objective, no zoom, single image plane, pixel time 1.6 μs; Day 0: laser power 53%, pinhole 1000 μm; Day 2: laser power 51%, pinhole 636 μm.
Figure 12. In vivo time-lapse imaging of single RGC then imaged in whole mount.
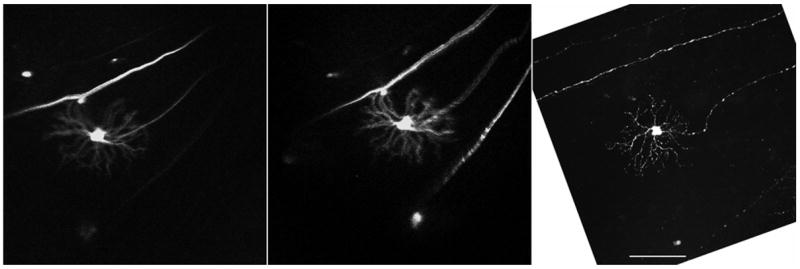
This RGC was imaged initially in vivo, the animal was survived and then imaged again the next day in vivo, after which the same RGC was imaged in fixed whole mount preparation the same day. There appears to be some artifactual stretching of the tissue in the fixed preparation, as the distance between the dendritic arbor and the nearby axons is increased relative to the in vivo image. By utilizing low power views of the entire retina as a map we are assured that the fixed cell is the same as that imaged in vivo. Left panel acquisition settings: 5x objective, no zoom, single image plane, pixel time 1.6 μs, laser power 51%, pinhole 636 μm. Center panel: 5x objective, no zoom, single image plane, pixel time 1.6 μs, laser power 52%, pinhole 761 μm. Right panel: 20x objective, no zoom, stack size: 461 x 461 x 34 μm, pixel size: 0.45 x 0.45 x 3.8 μm, pixel time 1.6 μs, laser power 15%, pinhole 61 μm, projection, scale bar: 100 μm; fixed image inverted & rotated to match orientation of in vivo images.
DISCUSSION
We have been able to image individual RGCs with their axons and dendrites multiple times in a living mammal for the first time, to the best of our knowledge. Unlike zebrafish (Mumm et al., 2006; Zolessi et al., 2006), the ocular coats of pigmented transgenic mice, which express cytoplasmic spectral variants of GFP in subsets of neurons (Feng et al., 2000), prevent transscleral (posterior to the mouse cornea) imaging of RGCs using confocal laser scanning microscopy or even multiphoton microscopy (Morgan et al., 2005). Therefore, we viewed retinal neurons through the central visual axis (through the mouse’s cornea and lens) of the mouse eye. The method used a glass coverslip and a coupling agent to create a plano-concave lens on the mouse cornea to permit appropriate focusing of retinal detail. We resolved individual RGCs with their dendritic arborizations and axons in living mice using a standard confocal fluorescence microscope with no customization of the microscope’s optics necessary. Since the mice could be re-anesthetized at later times, we were able to image the same RGC over multiple time points. The same neuron could then be located and imaged in fixed, retinal whole mount preparations after sacrifice.
In vivo retinal ganglion cell imaging has also been accomplished in mice (Seeliger et al., 2005), rat (Sabel et al., 1997; Engelmann and Sabel, 1999; Thanos et al., 2002; Cordeiro et al., 2004; Higashide et al., 2006) and macaque (Cordeiro et al., 2004; Gray et al., 2006). These studies utilized either standard epifluorescence microscopy (Thanos et al., 2002), confocal fluorescence microscopy (Sabel et al., 1997; Engelmann and Sabel, 1999), scanning laser ophthalmoscopy (SLO) (Seeliger et al., 2005; Cordeiro et al., 2004; Higashide et al., 2006), or adaptive optics (Gray et al., 2006). In contrast to this previous work, our technique provides a level of RGC imaging resolution not previously seen in mammals. With this technique, it is possible to not only image cell bodies and axons but also dendritic specialization in vivo. Previous work has only allowed for the counting of cell bodies (Sabel et al., 1997; Engelmann and Sabel, 1999; Thanos et al., 2002; Seeliger et al., 2005; Cordeiro et al., 2004; Higashide et al., 2006; Gray et al., 2006) and some visualization of axons (Gray et al., 2006). Several previous techniques also utilized superior colliculus (Sabel et al., 1997, Engelmann and Sabel, 1999; Thanos et al., 2002; Higashide et al., 2006), lateral geniculate (Gray et al., 2006) and intravitreal (Cordeiro et al., 2004) injections in order to label RGCs with fluorescent markers. The limited timecourse of RGC labeling and potential confounders or complications related to injections are eliminated by utilizing transgenic mice which express fluorescent protein cytoplasmically throughout the life of the animal.
There are many potential applications of this new technique. For example, one of the authors (HAQ) is developing mouse models for acute and chronic elevations in intraocular pressure. Combining this with in vivo imaging of individual RGCs will permit the study of RGC damage at a cellular level in acute glaucoma in living mice. These mice can also be crossed with various transgenic mouse models of retinal, glaucomatous and optic nerve disease which will permit the study of RGC structural dynamics in these models. Additionally, this imaging technique can be combined with experimental protocols to study the effects of retinal ischemia on RGCs or as an assay for retinal toxicity in pharmacotherapy studies. The in vivo imaging can then be coupled with immunohistochemical studies of tissue from which time-lapse data has already been acquired.
Other applications of the method include studies of normal retinal development and the effects of aging. Survival in vivo imaging in mice has been carried out as early as postnatal day 8 (Walsh and Lichtman, 2003), a time at which RGC dendritic segregation is still in its early stages in mice (Landi et al., 2007). Any gross perturbation to dendritic structure or architecture as a response to insult or during normal development (e.g., dendritic segregation) should be resolvable with this technique. This technique should also be applicable to the study of other retinal cell types labeled with GFP variants. Improved axial resolution in the deeper layers of the retina should be possible by utilizing multiphoton fluorescence microscopy.
Acknowledgments
Thank you to Morton F. Goldberg, David L. Guyton, and Matthew B. Walsh for reviewing the manuscript.
Financial support:
Harry A. Quigley Research Award from the Wilmer Eye Institute (MKW).
NIH grants EY 02120 and 01765 (HAQ).
Unrestricted support from the Leonard Wagner Trust, New York, NY (HAQ).
Footnotes
Presented in part at the Wilmer Resident Association 66th Clinical Meeting, May 18, 2007, Baltimore, MD.
No financial disclosures or conflicts of interest for either author.
Publisher's Disclaimer: This is a PDF file of an unedited manuscript that has been accepted for publication. As a service to our customers we are providing this early version of the manuscript. The manuscript will undergo copyediting, typesetting, and review of the resulting proof before it is published in its final citable form. Please note that during the production process errors may be discovered which could affect the content, and all legal disclaimers that apply to the journal pertain.
References
- Arras M, Autenried P, Rettich A, Spaeni D, Rulicke T. Optimization of intraperitoneal injection anesthesia in mice: drugs, dosages, adverse effects, and anesthesia depth. Comp Med. 2001;51(5):443–456. [PubMed] [Google Scholar]
- Chalupa LM. Developing dendrites demonstrate unexpected specificity. Neuron. 2006;52(4):567–8. doi: 10.1016/j.neuron.2006.10.013. [DOI] [PubMed] [Google Scholar]
- Cordeiro MF, Guo L, Luong V, Harding G, Wang W, Jones HE, et al. Real-time imaging of single nerve cell apoptosis in retinal neurodegeneration. Proc Natl Acad Sci USA. 2004;101(36):13352–13356. doi: 10.1073/pnas.0405479101. [DOI] [PMC free article] [PubMed] [Google Scholar]
- Engelmann R, Sabel BA. In vivo imaging of mammalian central nervous system neurons. Methods Enzymol. 1999;307:563–570. doi: 10.1016/s0076-6879(99)07033-0. [DOI] [PubMed] [Google Scholar]
- Feng G, Mellor RH, Bernstein M, Keller-Peck C, Nguyen QT, Wallace M, et al. Imaging neuronal subsets in transgenic mice expressing multiple spectral variants of GFP. Neuron. 2000;28(1):41–51. doi: 10.1016/s0896-6273(00)00084-2. [DOI] [PubMed] [Google Scholar]
- Gray DC, Merigan W, Wolfing JI, Gee BP, Porter J, Dubra A, et al. In vivo fluorescence imaging of primate retinal ganglion cells and retinal pigment epithelial cells. Opt Express. 2006;14(16):7144–7158. doi: 10.1364/oe.14.007144. [DOI] [PubMed] [Google Scholar]
- Grutzendler J, Kasthuri N, Gan WB. Long-term dendritic spine stability in the adult cortex. Nature. 2002;420(6917):812–816. doi: 10.1038/nature01276. [DOI] [PubMed] [Google Scholar]
- Higashide T, Kawaguchi I, Ohkubo S, Takeda H, Sugiyama K. In vivo imaging and counting of rat retinal ganglion cells using a scanning laser ophthalmoscope. Invest Ophthalmol Vis Sci. 2006;47(7):2943–2950. doi: 10.1167/iovs.05-0708. [DOI] [PubMed] [Google Scholar]
- Landi S, Cenni MC, Maffei L, Berardi N. Environmental enrichment effects on development of retinal ganglion cell dendritic stratification require retinal BDNF. PLoS ONE. 2007;2(4):e346. doi: 10.1371/journal.pone.0000346. [DOI] [PMC free article] [PubMed] [Google Scholar]
- Lichtman JW, Fraser SE. The neuronal naturalist: watching neurons in their native habitat. Nat Neurosci. 2001;4 Suppl:1215–1220. doi: 10.1038/nn754. [DOI] [PubMed] [Google Scholar]
- Lichtman JW, Sanes JR. Watching the neuromuscular junction. J Neurocytol. 2003;32(5–8):767–775. doi: 10.1023/B:NEUR.0000020622.58471.37. [DOI] [PubMed] [Google Scholar]
- Lin B, Masland RH. Synaptic contacts between an identified type of ON cone bipolar cell and ganglion cells in the mouse retina. Eur J Neurosci. 2005;21(5):1257–1270. doi: 10.1111/j.1460-9568.2005.03967.x. [DOI] [PubMed] [Google Scholar]
- MacNeil MA, Masland RH. Extreme diversity among amacrine cells: implications for function. Neuron. 1998;20(5):971–982. doi: 10.1016/s0896-6273(00)80478-x. [DOI] [PubMed] [Google Scholar]
- Morgan J, Huckfeldt R, Wong RO. Imaging techniques in retinal research. Exp Eye Res. 2005;80(3):297–306. doi: 10.1016/j.exer.2004.12.010. [DOI] [PubMed] [Google Scholar]
- Mumm JS, Williams PR, Godinho L, Koerber A, Pittman AJ, Roeser T, et al. In vivo imaging reveals dendritic targeting of laminated afferents by zebrafish retinal ganglion cells. Neuron. 2006;52(4):609–621. doi: 10.1016/j.neuron.2006.10.004. [DOI] [PMC free article] [PubMed] [Google Scholar]
- Sabel BA, Engelmann R, Humphrey MF. In vivo confocal neuroimaging (ICON) of CNS neurons. Nature Medicine. 1997;3(2):244–247. doi: 10.1038/nm0297-244. [DOI] [PubMed] [Google Scholar]
- Seeliger MW, Beck SC, Pereyra-Munoz N, Dangel S, Tsai JY, Luhmann UF, et al. In vivo confocal imaging of the retina in animal models using scanning laser ophthalmoscopy. Vision Res. 2005;45(28):3512–3519. doi: 10.1016/j.visres.2005.08.014. [DOI] [PubMed] [Google Scholar]
- Thanos S, Indorf L, Naskar R. In vivo FM: using conventional fluorescence microscopy to monitor retinal neuronal death in vivo. Trends Neurosci. 2002;25(9):441–444. doi: 10.1016/s0166-2236(02)02246-4. [DOI] [PubMed] [Google Scholar]
- Trachtenberg JT, Chen BE, Knott GW, Feng G, Sanes JR, Welker E, et al. Long-term in vivo imaging of experience-dependent synaptic plasticity in adult cortex. Nature. 2002;420(6917):788–794. doi: 10.1038/nature01273. [DOI] [PubMed] [Google Scholar]
- Walsh MK, Lichtman JW. In vivo time-lapse imaging of synaptic takeover associated with naturally occurring synapse elimination. Neuron. 2003;37(1):67–73. doi: 10.1016/s0896-6273(02)01142-x. [DOI] [PubMed] [Google Scholar]
- Zolessi FR, Poggi L, Wilkinson CJ, Chien CB, Harris WA. Polarization and orientation of retinal ganglion cells in vivo. Neural Develop. 2006 Oct 13;1:2. doi: 10.1186/1749-8104-1-2. [DOI] [PMC free article] [PubMed] [Google Scholar]