

Abstract
Purpose
To report the macular pigment optical density (MPOD) findings at 0.5° of eccentricity from the fovea in elderly subjects participating in ARMA, a study of aging and age-related maculopathy (ARM) ancillary to the Health, Aging, and Body Composition (Health ABC) Study.
Methods
MPOD was estimated with a heterochromatic flicker photometry (HFP) method in a large biracial population sample of normal 79.1 ± 3.2-year-old adults living in the Midsouth (n = 222; 52% female; 23% black, 34% users of lutein-containing supplements). Within a modified testing protocol, subjects identified the lowest and the highest target intensity at which the flicker sensation disappeared, and the exact middle of this “no-flicker zone” was interpolated by the examiner.
Results
An MPOD estimate was obtained successfully in 82% of the participants. The mean MPOD in our sample was 0.34 ± 0.21 (SD). The interocular correlation was high (Pearson’s r = 0.82). Compared with lutein supplement users, mean MPOD was 21% lower in nonusers (P = 0.013). MPOD was also 41% lower in blacks than in whites (P = 0.0002), even after adjustment for lutein supplement use. There were no differences in MPOD by gender, iris color, or history of smoking.
Conclusions
Older adults in the Midsouth appear to have average MPOD and interocular correlation comparable to those in previous studies. Lutein supplement use and white race correlated with higher MPOD. No evidence of an age-related decline in MPOD was seen in the sample. The HFP method for the measurement of MPOD is feasible in epidemiologic investigations of the elderly, the group at highest risk of ARM.
The main constituents of the yellow pigment of the human fovea are two carotenoids, lutein and zeaxanthin, collectively termed macular pigment (MP). Oxidative stress is high in the retina due to the intense light exposure and the high rate of oxidative metabolism, especially in the macula.1–3 It has been hypothesized that the MP may protect the macular tissue from oxidative damage1,4; may contribute to improving visual acuity and visibility by absorbing short-wavelength light5; and, by these mechanisms, may play a role in protecting the retina from the development of age-related maculopathy (ARM).1,3,4 Epidemiologic data supporting this hypothesis are conflicting,1,3,6–16 but these studies have been based on serum or dietary lutein and zeaxanthin measurement and not direct ocular measurements.
During the past 10 years, several noninvasive methods have been developed to quantify macular MPs in vivo. The bases and applications of these methods have been reviewed recently.17–21 The most commonly and most extensively validated method used is a psychophysical test based on heterochromatic flicker photometry (HFP).17,22 Subjects taking the test with this technique are asked to find the point at which the sensation of flicker in test targets disappears. The range of intensity within which flicker is no longer appreciated is termed the “no-flicker zone.” Ordinarily, the subject is asked to identify empirically the middle of the no-flicker zone with progressively finer adjustments of the knob and to push a button at the subjectively determined point.
Several studies have reported the characteristics and correlates of MPOD measured with the HFP-based method in distinct American and European population samples, most of which focused on young to middle-aged adults.2,17,23–46 Of the few studies that involved older subjects,29,31,35,37,42,43 only that of Snodderly et al.42 focused on methodological issues and challenges pertaining to MPOD testing in the elderly, reporting highly reproducible results within a median time of 45 minutes to test both eyes. Herein, we illustrate our findings in a large sample of elderly individuals from the Midsouth with a simpler protocol modified for use in geriatric populations in an epidemiologic setting.
Methods
The ARMA Study Population
The ARMA Study focused primarily on a sample of participants from the Health ABC study, a biracial cohort of more than 3000 highly functional elderly individuals 70 years old or older at study inception. Health ABC is being conducted in two U.S. cities: Memphis and Pittsburgh. Our study included an enriched sample of the Memphis Health ABC cohort (which consists of more than 1300 individuals), participating in years 6 and 7 of the Health ABC study and an independently funded arm of the study in which non–Health ABC participants from the general Memphis metropolitan elderly population were also enrolled.
All participants were free of diabetic retinopathy and glaucoma or any other overt retinal and/or optic nerve disease (as determined by history, clinical examination, or both) that may confound or otherwise affect MPOD determinations. Subjects with unilateral conditions such as macular hole or amblyopia were allowed to participate as long as the fellow eye met the inclusion criteria. All participants underwent detailed eye examinations, including documentation of lens opacity based on published AREDS (Age-Related Eye Disease Study) criteria,47 iris color (categorized as blue-gray, green, hazel, brown, or black), and stereo fundus photography of the macula. Photographs were obtained and graded in a masked fashion according to the published AREDS criteria.48 Only elderly subjects free of ARM by both clinical and masked fundus photograph grading criteria are included in this report. The resultant study sample included 222 subjects, 52% of which were women and 23% of which were black. Only six of the participants were active smokers, whereas 101 were previous smokers and 113 had never smoked. Smoking information was not available for one subject. Information was also collected about current use of dietary supplements containing lutein. This information could be verified in all but one participant by either direct inspection of the bottle of dietary supplements used by the participants (typically a multivitamin enriched with lutein), or by obtaining the name and brand of the supplement at the time of examination and verifying subsequently if it contained lutein supplements. Use of lutein-containing supplements (n = 75) ranged between 0.25 mg/daily (the dosage currently found in most multivitamin supplements) and 20 mg/daily. Additional details on the characteristics of the resulting study sample are summarized in Table 1. All procedures conformed to the Declaration of Helsinki and were approved by the Institutional Review Board of the University of Tennessee Health Science Center (UTHSC).
Table 1.
Characteristics of the ARMA Study Sample
| n (%)* | Age (mean ± SD) | Range (y) | |
|---|---|---|---|
| Total | 222(100) | 79.1 ± 3.2 | 69–86 |
| By gender | |||
| Male | 106(48) | 79.5 ± 3.0 | 70–86 |
| Female | 116(52) | 78.7 ± 3.5 | 69–86 |
| By race | |||
| White | 170(77) | 78.9 ± 3.3 | 68–85 |
| Black | 52(23) | 79.5 ± 3.1 | 76–86 |
| By lutein supplement use† | |||
| Users | 75(34) | 78.6 ± 3.4 | 69–85 |
| Nonusers | 146(66) | 79.3 ± 3.2 | 72–86 |
Percentage of total study sample.
Lutein supplement use status could not be determined for one participant.
MPOD Measurement Methodology
The HFP-based instrument used in this study (Macular Metrics Corp., Rehoboth, MA) was a light-emitting diode (LED)–based one, derived from the one developed and reported by Wooten et al.32 and used in several other published studies.42,49,50 In brief, the psychophysical visual sensitivity was determined for a 1.7-log td, 460-nm flickering test stimulus, presented in a darkened environment on a 1.5-log td, 6°, 470-nm rod-suppressing background and alternating in counterphase with a test light at a wavelength that is not absorbed by the MP (570 nm).
The ratio between measurements for a 1.0° foveal target (i.e., providing information on MPOD at 0.5° eccentricity) and one obtained parafoveally with a 2° diameter stimulus centered approximately 7° from fixation (where the MP density is minimal) provided an estimate of the MPOD in our study. The 1.0° foveal target is the one that has been most often used in previous studies. Fixation for the foveal target was maintained via a 5-minute spot in the middle of the test target. For the parafoveal estimates, a small, red LED, always situated to the left of the background field, was used as an eccentric fixation device. The flicker frequency of the two test stimuli was always >8 Hz foveally and >5 Hz parafoveally and was optimized by the examiner for each subject and for each stimulus (typically, between 9 and 13 Hz for the foveal stimulus and between 6 and 10 Hz for the parafoveal stimulus). Only subjects with corrected visual acuity of 20/100 or better in at least one eye to ETDRS (Early Treatment Diabetic Retinopathy Study) chart testing were considered eligible to attempt MPOD determinations. All subjects were tested with the correction at near that allowed them the sharpest resolution of a ring test target. Both positive and negative additions to the default +1.50-D lens of the instrument were allowed.
To minimize the variability of test results and participants’ fatigue, a slightly modified testing protocol was used. Participants were instructed to identify the limits of the no-flicker zone for each target, which were termed the “minimum” and the “maximum” intensities for the test target in question. They performed the test by adjusting, first clockwise and then counterclockwise, a knob controlling the intensity of the test targets (see Fig. S1 in the Online Appendix, available at http://www.iovs.org/cgi/content/full/48/4/1458/DC1, for further details), going always from flickering to not flickering and starting at the low-intensity end (i.e., minimums first). Participants were always encouraged to blink several times when they first thought they had reached a no-flicker point and to continue adjusting the knob until the blinking no longer allowed the sensation of flickering in the test targets to resume. The examiner then calculated the exact mathematical average of the minimum and maximum numerical values, which identified the middle of the no-flicker zone, and entered it on behalf of all subjects. For participants who had difficulty adjusting the knob on their own (e.g., in case of tremor), the examiner performed the task on their behalf, instructing the subject to notify the examiner immediately upon cessation of the flicker sensation. A similar strategy recently has been used successfully by others.49,50 As detailed in the Online Appendix, with this protocol, we could limit test repetitions to three, instead of the five to eight used in previous studies, attaining equally accurate estimates more rapidly.
Statistical Methods
Frequency distributions and other basic information were obtained in a spreadsheet program (Excel; Microsoft, Redmond, WA). All other statistical analyses were performed with another commercial program (SAS statistical software, ver. 8.1; SAS, Cary, NC). Unless otherwise specified, all analyses were conducted on a per-subject basis (i.e., averaging the MPOD estimates between the two eyes). For participants who could contribute an MPOD estimate from only one eye, the value from that eye was used. To determine whether there was a significant difference in the characteristics of participant subgroups, a two-tailed paired Student’s t-test was used for continuous variables (e.g., MPOD) and the χ2 test was used, or the odds ratio (OR) was calculated, for dichotomous variables, as appropriate (e.g., MPOD estimate obtained versus not obtained). Correlations between continuous variables (e.g., between-eye MPOD) were approached with a general linear model and characterized by means of the Pearson’s correlation coefficient (r). When appropriate, other potential confounding variables were included in and controlled for in the model. Furthermore, comparisons between multiple subgroups (e.g., by iris color) were analyzed by analysis of variance (ANOVA) and of covariance (ANCOVA), as appropriate. Preplanned analyses included the estimation of the MPOD interocular correlation; comparison of MPOD estimates between genders (male versus female), races (white versus black), lutein use (lutein supplement users versus non-users), and iris colors; and the correlation between MPOD and age. Because of the multiple additional comparisons performed in this study, we conservatively considered P < 0.01 to be statistically significant for all comparisons.
Results
MPOD measurements were obtained in both eyes of 157 (71%) of the 222 participants and in at least one eye in 183 (82%) of them. The characteristics of the subjects in whom MPOD estimates were obtainable and their breakdown by gender and race are shown in Table 2 and are contrasted with the participants in whom an MPOD estimate could not be obtained. Of the 183 subjects in whom estimates could be obtained, 89 were men, 94 were women, and 35 (19%) were black. Among these participants, there were 62 lutein supplement users (27 men; 35 women) and 120 nonusers (61 men; 59 women). Of the 62 users, 55 where white, whereas there were only 7 lutein supplement users among the 35 blacks who successfully completed MPOD testing. Nearly all of the users were taking multivitamins that contained small amounts of lutein, 0.25 to 0.50 mg (n = 55), whereas a small number of participants (n = 7) were taking supplements ranging between 2 and 20 mg daily.
Table 2.
Characteristics of the Participants with and without Successful MPOD Estimates
| With Measurements
|
Without Measurements
|
|||||
|---|---|---|---|---|---|---|
| n (%)* | Age (Mean ± SD) | Range (y) | n (%)* | Age (mean ± SD) | Range (y) | |
| Total | 183(82) | 78.9 ± 3.2 | 69–86 | 39(18) | 79.8 ± 3.1 | 76–86 |
| By gender | ||||||
| Male | 89(84) | 79.5 ± 3.1 | 70–86 | 17(16) | 79.5 ± 2.5 | 76–85 |
| Female | 94(81) | 78.3 ± 3.3† | 69–85 | 22(19) | 80.1 ± 3.6† | 76–86 |
| By race | ||||||
| White | 148(87)‡ | 78.8 ± 3.3 | 69–85 | 22(13)‡ | 79.5 ± 3.1 | 76–85 |
| Black | 35(67)‡ | 79.1 ± 3.0 | 76–86 | 17(33)‡ | 80.4 ± 3.1 | 76–86 |
| By lutein supplement use§ | ||||||
| Users | 62(83) | 78.3 ± 3.5 | 69–85 | 13(17) | 79.5 ± 2.9 | 76–85 |
| Nonusers | 120(82) | 79.1 ± 3.1 | 72–86 | 26(18) | 80.0 ± 3.2 | 76–86 |
Percentage of total (n = 222) and by gender, race, or lutein supplement use subgroup.
Unpaired two-tailed t-test, P = 0.008.
χ2 test, P = 0.0007.
Lutein supplement use status could not be ascertained for one participant.
The demographic characteristics of the subjects in whom estimates were not obtainable are illustrated in Table 2. Reasons for their not being able to perform MPOD testing included inability to understand (n = 15, bilaterally) or to complete (n = 4, one eye) the test; inability to identify the maximum intensity levels necessary for the estimation of the middle of the no-flicker zone (n = 10, 7 of whom in both eyes); unwillingness to perform the test (n = 9); and inability to return to the clinic for testing after the initial eye examination (n = 8).
The duration of an entire testing session, from the time that subjects entered the testing room to the time they exited it, was documented in 157 instances. On average, a session lasted nearly 52 minutes. Of this time, active testing with our protocol was 20 ± 9 minutes per eye (95% CI: 18.5–21.4 minutes per eye). Therefore, when both eyes were eligible for testing, the average subject would require approximately 35 to 40 minutes of active testing to attain an MPOD estimate in both eyes.
Significant MPOD Differences by Lutein Supplement Use and Race, but Not between Genders or by Iris Color
Table 3 details the main findings in the 183 subjects from the Midsouth who were eligible for retention and in whom an MPOD estimate was obtained in at least one eye. The mean MPOD in our study sample was 0.34 ± 0.21. As expected, the MPOD in the right eyes correlated highly with that of the left eyes (Pearson’s r = 0.82; P < 0.0001). Consistent with its expected biological correlation, the overall mean MPOD was higher (two-tailed unpaired Student’s t-test, P = 0.013) in lutein supplement users (0.39 ± 0.20) than in nonusers (0.31 ± 0.21). Furthermore, low-dose users (≤0.5 mg/daily; n = 55) had an MPOD of 0.38 ± 0.20, and high-dose users (≥2 mg/daily; n = 7) had an MPOD of 0.51 ± 0.17. This pattern was observed consistently in both males and females and in white and black subjects (not shown). The frequency distribution of these estimates by lutein supplement use is illustrated in Figure 1. Users of lutein had a substantially higher proportion of subjects in the 0.51 to 0.70 MPOD range than did nonusers (27% vs. 12.5%), who outnumbered users in the 0.00 to 0.20 MPOD range (33% vs. 14.5%).
Table 3.
MPOD Findings in the ARMA Study Sample
| Participants (n) | MPOD (Mean ± SD) | |
|---|---|---|
| Study sample | 183 | 0.34 ± 0.21 |
| By gender | ||
| Male | 89 | 0.32 ± 0.22 |
| Female | 94 | 0.35 ± 0.19 |
| By race | ||
| White | 148 | 0.37 ± 0.19† |
| Black | 35 | 0.22 ± 0.23† |
| By eye* | ||
| Right eye | 157 | 0.34 ± 0.22‡ |
| Left eye | 0.33 ± 0.20‡ | |
| By lutein supplement use | ||
| Users | 62 | 0.39 ± 0.20§ |
| Non-users | 120 | 0.31 ± 0.21§ |
Includes only data for subjects in whom both eyes could be tested successfully and in whom the status of one eye matched that of the other (e.g., both disease-free).
Unpaired, two-tailed t-test P = 0.0002.
Pearson’s r = 0.82; P < 0.0001.
Unpaired, two-tailed t-test P = 0.013.
Figure 1.
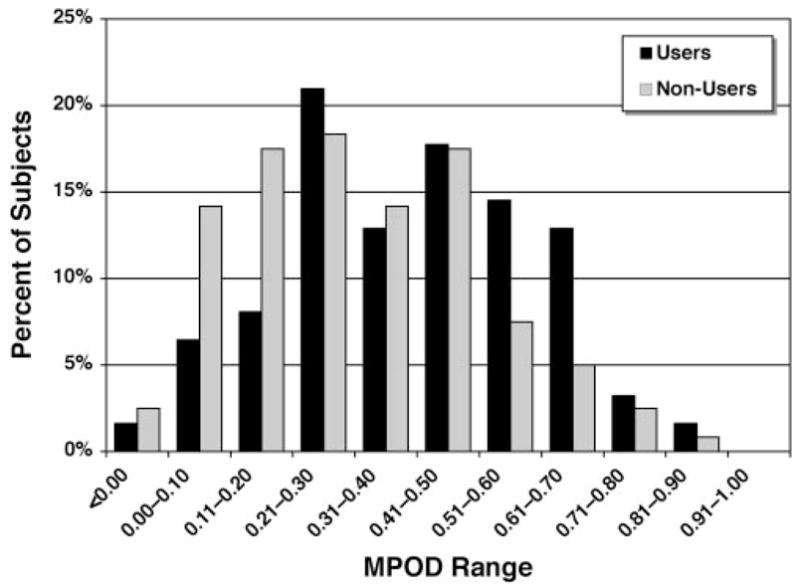
Frequency distribution of MPOD estimates in the ARMA Study by lutein supplement use (normalized to percentage of total). Consistent with the expected biological correlation, users of lutein-containing supplements outnumbered nonusers in the MPOD ranges ≥0.51 (slight negative skewness), whereas nonusers are substantially more numerous in the ranges ≤0.20 (slight positive skewness).
The frequency distribution of MPOD estimates by race is illustrated in Figure 2. On average, the blacks had significantly lower MPODs than did whites (0.22 ± 0.23 vs. 0.37 ± 0.19, P = 0.0002), and this difference remained highly significant after adjustment for lutein supplement use (P = 0.0007). Consistent with this observation, when this comparison was limited to participants who did not use lutein-containing supplements, black nonusers still had significantly lower MPODs (0.21 ± 0.23; n = 28) than did white nonusers (0.34 ± 0.19; n = 92; P = 0.003). Both race and lutein supplement use correlated significantly and independently with MPOD and, when both variables were included in a multivariate model, they explained approximately 10% of the MPOD variability (r2 = 0.10).
Figure 2.
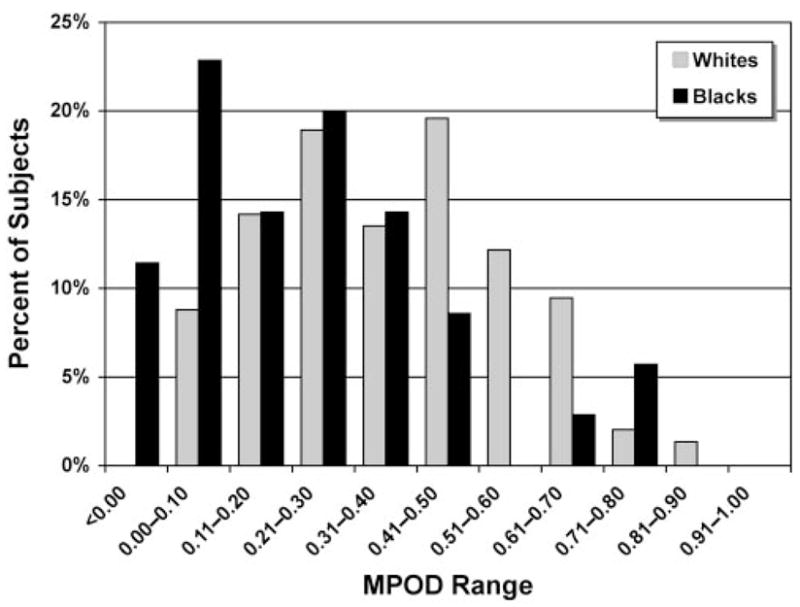
Frequency distribution of MPOD estimates by race (normalized to percentage of total). The distribution profile for blacks was positively skewed, with approximately 35% of the subjects displaying MPODs ≤0.10 and <10% with MPOD >0.50, whereas MPODs of whites were more uniformly distributed across categories, with two discernible frequency peaks in the 0.21 to 0.30 and 0.41 to 0.50 ranges, respectively.
Female nonusers had, on average, slightly higher MPODs (0.32 ± 0.20) than did male nonusers (0.30 ± 0.21), but this difference was not statistically significant. Consistent with this observation, gender was never a significant independent variable in any of the models.
We also investigated the relationship between MPOD and iris color. Blue-gray irises were defined as group 1 (n = 69). Because there were too few subjects with green irises, they were grouped with those with hazel ireses (group 2, n = 66), as in Hammond et al.26 Subjects with brown irises were categorized as group 3 (n = 48). No subject was classified as having black irises. An initial unadjusted comparison of the MPOD showed a significant difference between the three groups, but the MPOD–iris color relationship in our sample was confounded by the black subjects in our sample being clearly overrepresented in group 3 and by the fact that there were very few lutein-containing supplement users among the blacks. When multivariate analyses were conducted also including race and lutein supplement use, iris color was no longer associated with significant differences in MPOD. When MPOD comparisons by iris color were repeated only for white non-users (n = 92), we still found no significant difference between the three subgroups, but the few white subjects with brown irises had the highest mean MPOD estimates of the three groups (group 1: 0.35 ± 0.19, n = 44; group 2: 0.32 ± 0.18, n = 40; group 3: 0.37 ± 0.20, n = 8). This trend is in line with a previous report of higher MPOD in subjects with dark irises.26
MPOD in the Elderly: No Relationship with Past Smoking or Age
It has been shown that active smoking correlates with lower MPOD levels.25,51 There were too few active smokers (n = 6, four of whom had MPOD estimates) in our sample to investigate this relationship. When contrasting MPOD in past smokers (n = 81) versus never smokers (n = 92), MPOD tended to be lower in the former (0.31 ± 0.21 vs. 0.37 ± 0.21). However, also this modest nonsignificant trend was further reduced once race and lutein-containing supplement use were controlled for in multivariate analyses (least-square MPOD means: past smokers = 0.30; never smokers = 0.33).
Last, we investigated the relationship between MPOD and age. Over the two-decade span in which estimates were successfully obtained in our population sample (range, 69–86 years), MPOD displayed only a very small, nonsignificant age-related decline (Pearson’s r = −0.026, P > 0.05). This overall trend did not change, even after adjustment for lutein supplement use, gender, race, and iris color.
Discussion
The main objectives of this cross-sectional study were to verify the feasibility of MPOD measurements in a large elderly population sample for future use as a measure in population-based epidemiologic studies of the elderly and to gain insight on the characteristics of MPOD in elderly subjects from the Midsouth, a portion of the United States in which no studies of MPOD had been conducted. Our study provides MPOD information on the largest population sample of elderly individuals studied to date and the first information on MPOD in a Midsouthern population sample.
Feasibility of MPOD Testing in the Elderly in a Large-Scale Epidemiologic Setting
With our simplified protocol, we successfully obtained bilateral MPOD estimates over the entire age range examined in 71% of the participants and in at least one eye of 82% of them. Measurements were usually completed within a reasonable length of time (18.5–21.4 minutes/eye, 95% confidence interval [CI]) for the 1° target. Taking into account the characteristics of our study sample, this testing time compares reasonably well with that of 45 minutes reported by Snodderly et al.42 in their substantially younger, white, highly educated female participants. Although theoretically ideal, obtaining estimates at additional loci may prove impractical and unattainable, at least bilaterally, in a large-scale investigation of the elderly. Disadvantages of excessively prolonged testing would include increased fatigue, possible loss of reliability and, potentially, a substantial increase in the attrition rate. Depending on the study’s purpose and the retinal health status of the population of interest, single-target binocular estimates and/or multiple-target monocular MPOD profiling may be preferable.
MPOD in the ARMA Study Sample: Comparison to Previous Studies
Table 4 illustrates a comparison of our findings with previous studies with the HFP-based technique conducted in other U.S. populations.23–29,31–35,37–39,41–43 All the investigations included in Table 4 were performed with 1° stimuli at the same peak wavelength of 460 nm used in our study, as well as studies that conducted parafoveal measurements at 4° eccentricity. For these studies, based on Robson et al.,52 it is possible that the use of a 4° parafoveal target underestimated the MPOD by approximately 10%, and possibly by as much as 20%. A reference location at approximately 7° like the one used in the present study and that of Snodderly et al.42 has been deemed the most appropriate.52 With these caveats in mind, the observed MPOD in our sample (0.34 ± 0.21) was identical with the mean of all listed studies combined (0.34 ± 0.11; range: 0.19–0.57). Compared with the average MPOD reported in other groups of elderly subjects,29,31,35,37,42,43 our subjects were again within the reported range (0.21–0.57).
Table 4.
Summary of Previous Studies of MPOD by Heterochromatic Flicker Photometry with a 1° Test Target (Peak Wavelength, 460 nm)
| Study | Method* and PTL† | Sample Size | Age Range (y) | MPOD‡ (Mean ± SD) |
|---|---|---|---|---|
| Hammond and Fuld23 | MV; 8.0 | 10 | 19–42 | 0.32 ± 0.14 |
| Hammond et al.24 | MV; 8.0 | 20 | 19–22 | 0.28 ± 0.06 |
| Hammond et al.25 | MV; 5.5 | 68 | 20–62 | S: 0.16 ± 0.12 |
| NS: 0.34 ± 0.15 | ||||
| Hammond et al.26 | MV; 5.5 | 38 | 31–43§ | B/Gy: 0.25 ± 0.20 |
| 26 | 26–34§ | Grn/Haz: 0.32 ± 0.15 | ||
| 31 | 29–37§ | Br/Blk: 0.38 ± 0.24 | ||
| Hammond et al.27 | MV; 5.5 | 88 | 19–83 | M: 0.38 ± 0.21 |
| F: 0.24 ± 0.16 | ||||
| Hammond et al.28 | MV; 5.5 | 13 | 30–65 | 0.39 ± 0.09|| |
| Hammond et al.29 | MV; 6.0 | 7 | 24–36 | F: 0.34 ± 0.18 |
| 5 | 24–31 | M: 0.50 ± 0.31 | ||
| 23 | 55–78 | F: 0.46 ± 0.30 | ||
| 16 | 48–82 | M: 0.57 ± 0.22 | ||
| Hammond et al.31 | MV; 6.0 | 10 | 24–36 | 0.40 ± 0.26 |
| 27 | 60–84 | 0.46 ± 0.29 | ||
| Wooten et al.32 | FV; 4.0 | 30 | 16–60 | 0.27 ± 0.15 |
| Hammond and Caruso-Avery34 | FV; 4.0 | 217 | 17–92 | 0.22 ± 0.13 |
| Johnson et al.35 | MV; 6.0 | 7 | 33–54 | 0.40 ± 0.05¶ |
| 21 | 33–83 | M: 0.41 ± 0.07 | ||
| F: 0.48 ± 0.01 | ||||
| Ciulla et al.37 | FV; 4.0 | 24 | 47–81 | Pre-IOL: 0.21 ± 0.13 |
| Post-IOL: 0.18 ± 0.12 | ||||
| Ciulla et al.38# | FV; 4.0 | 280 | 18–50 | All: 0.21 ± 0.13 |
| M: 0.22 ± 0.13 | ||||
| F: 0.21 ± 0.13 | ||||
| W: 0.21 ± 0.13 | ||||
| B: 0.23 ± 0.14 | ||||
| Hammond et al.41# | FV; 4.0 | 278 | 18–48 | BMI >29: 0.18 ± 0.12 |
| BMI < 29: 0.22 ± 0.14 | ||||
| Snodderly et al.42 | FV; 7.0 | 54 | 50–79 | 0.42 ± 0.22 |
| Ciulla and Hammond43 | FV; 4.0 | 50 | 54–89 | N: 0.28 ± 0.21 |
| Cat: 0.24 ± 0.16 |
FV, free (or natural) view; MV, Maxwellian view.
PTL, parafoveal test location (degrees of eccentricity of the parafoveal target).
All data are reported rounded to second decimal point; A, Asians; B, Blacks; B/Gy, Blue/Gray iris; BMI, body mass index; Br/Blk, brown/black iris; Cat, cataract; F, females; Grn/Haz, green/hazel iris; H, hispanics; M, males; N, normals; NS, nonsmokers; Post-IOL, after cataract surgery; Pre-IOL, before cataract surgery; S, smokers; W, whites.
95% CI for each study subgroup.
Baseline values for retinal responders only (n = 7).
Baseline prediet modification values.
Correlation of Use of Lutein-Containing Supplements with Higher MPOD
Our results also show that elderly individuals using lutein-containing supplements have, on average, higher MPOD levels than do nonusers. Furthermore, the few high-dose lutein supplement users in whom MPOD was measured (≥2 mg/daily; n = 7) had estimates that were, on average, 25% higher than those in low-dose supplement users (≤0.5 mg/daily; n = 55). Although our data do not provide direct proof that this difference is due to consumption of these supplements and not to, for example, differences in dietary habits preexisting the use of supplements or other factors, these results are biologically plausible and, consistent with those in previous reports,28,30,35,44,53 they support the possibility that consumption of lutein-enriched dietary supplements may result in higher MPOD levels in elderly individuals. The putative eyesight protective and ARM-preventing effects of this MPOD enhancement remain, of course, to be verified in forthcoming controlled double-blinded prospective trials.
MPOD in Elderly Blacks versus Whites in the Midsouth
Published data on MPOD in blacks are few. In studies of a Midwestern population sample,33,38,39 32 of 280 participants were black. In this sample, the MPOD in the blacks was slightly higher than that in the whites. Unlike in these studies, we observed higher MPODs in whites, a finding that is in line with an earlier study by Hammond et al.26 In our sample, the difference between the two race-based groups was highly significant, even when comparisons were limited to non–lutein-supplement users. The prevalence and incidence of ARM in the black populations studied to date is far lower than that in whites, and yet data are scarce because of the small number of black participants.54 Therefore, additional studies of elderly black populations appear to be necessary, to characterize their MPOD features further, identify their correlates, understand whether the correlates may be different from those in whites, and whether any of these putative differences may explain, at least in part, the lower prevalence of ARM among blacks.
No Difference in MPOD by Gender, Iris Color, or Past Smoking
In previous investigations over a wide age range, women had or tended to have lower MPOD levels than did men.27,33,34,38,39 With an HFP-based method but different stimuli, Mellerio et al.51 also observed a significantly higher MPOD in U.K. men. In contrast, in a study conducted on New England subjects by Johnson et al.,35 the women had, on average, higher MPOD than did the men. Our study results differ from most studies of younger subjects,27,33,34,38,39,51 but are consistent with that of Johnson et al.,35 a portion of whose study participants were older than in the other studies (see Table 4). Taken together, these findings suggest that intergender differences in MPOD, if any, may vary between populations and may differ depending on the age range sampled and that female gender alone, at least in elderly subjects, does not intrinsically predispose to or otherwise correlate with lower MPOD levels. This conclusion is supported also by previous investigations.35,45
Similar to the effect of gender, iris color in our sample of elderly individuals did not display the same significant correlation with MPOD observed in earlier studies that included mainly much younger subjects.26,38,51 Studies of larger elderly white samples with a sufficient number of subjects with dark irises are needed to determine whether the previously reported higher MPOD in younger adults with dark iris color is also present in the elderly.
Smoking is a modifiable lifestyle habit that is the leading environmental risk factor for ARM55 and a significant independent determinant of serum levels of lutein and zeaxanthin, despite high dietary intakes.56 However, past smokers do not have lower serum lutein and zeaxanthin levels that never smokers.56 The effect of smoking on MPOD has been investigated before in younger samples,25,51 showing lower MPOD estimates in smokers and an inverse relationship of MPOD with the number of cigarettes smoked daily. Consistent with results of studies at the serum level,56 our investigation provides no immediate evidence that being a past smoker is associated with lower lutein and zeaxanthin at the retinal level in elderly subjects. It remains to be determined whether reduced MPOD is also present in actively smoking elderly subjects.
Lack of an Age-Related Decline in MPOD in Elderly Midsoutherners
The data summarized in Table 4 provide no evidence of an age-related decline in MPOD across populations, which is consistent with the results of other investigators.43,46,51 This, along with our observed lack of any age-related decline in MPOD within our study sample, suggests that there seems to be little evidence of an age-related decline in MPOD at 0.5° of eccentricity from fixation with the HFP-based technique.
It must be noted that, except for the studies of Ciulla and Hammond43 and Snodderly et al.,42 most previous studies included only a limited number of elderly subjects and that in the previous studies in which age-related changes in MPOD was investigated,43,46,51 information on use of lutein- and/or zeaxanthin-containing supplements was not obtained or, even when available, information on dietary patterns was not included in the age analysis.51 Therefore, one cannot exclude that unaccounted for use of such supplements and/or dietary factors may have exerted a confounding effect in these as well as other studies, erasing any age-related effect. However, this was not the case in our study.
An inverse correlation between MPOD and age has been observed by Bernstein et al.,57 by means of a Raman spectroscopy-based technique. It is possible that the lack of age-related decline observed with HFP-based techniques may result from methodological differences with Raman spectroscopy,57,58 as further debated extensively elsewhere.59–62 The MPOD age-related decline observed with the Raman technique may be the result of interference from media opacities,43 or, since this method averages MP density up to approximately 1.7° of eccentricity,57,58 it may also be due to preferential MP density losses farther away from the foveola than that sampled by a 0.5° target. The latter explanation would be in line with the clinical observation of foveolar resiliency in geographic atrophy.63–67
Conclusions
In summary, we provided evidence of the feasibility of MPOD measurements with a simplified testing protocol with an HFP-based method in an epidemiologic setting of subjects within and over the eighth decade of life (i.e., when the prevalence of ARM is highest).54 This study allowed us to gain insight into the characteristics of MPOD in the largest elderly population sample thus far studied and the first from the Midsouth. Our investigation also included the largest number of black subjects studied to date, revealing that their MPOD is significantly lower than in whites in the same age range. MPOD measurements may be a useful outcome measure of studies of macular aging and ARM and may assist us in shedding light on the pathogenesis of ARM.
Supplementary Material
Acknowledgments
Supported by National Eye Institute Grant K23 EY000409; National Institute on Aging (NIA) Contracts N01 AG62101, N01 AG62103, and N01 AG62106 and the Intramural NIA Research Program; the International Retinal Research Foundation, Birmingham, AL; Macular Degeneration Research, American Health Assistance Foundation, Clarksburg, MD; and a Career Development Award (AI) and an unrestricted grant to the UTHSC Department of Ophthalmology from Research to Prevent Blindness. KTG was the recipient of an intramural Medical Student Summer Research Fellowship, supported by National Institute of Diabetes and Digestive and Kidney Diseases training Grant T35 DK07405 (UTHSC). TLH was the recipient of a Memphis McNair Program Summer Research Fellowship, supported by a grant from the US Department of Education P217A030229 to UTHSC. The Macular-Metrics instrument utilized to measure macular pigment optical density in this study was purchased with the generous joint funding of Bausch & Lomb and Kemin Foods Corp.
The authors thank Billy R. Wooten (Brown University, Providence, RI), B. Randy Hammond, Jr. (Medical College of Georgia, Augusta, GA), and Julie A. Mares (University of Wisconsin, Madison, WI) for helpful comments and suggestions in the early stages of the study; Ronald Shorr (UTHSC Department of Preventive Medicine) and the Health ABC Publications Committee members for helpful comments on the manuscript; the entire Health ABC staff at the Memphis study site for their assistance; Salwa M. Ahmed, Jeremy Racey, Deon Cistrunck, and Mary Lane for technical assistance; Songmei Meng and Hongtao Zhai for assistance with database creation and management; and the ARMA Study participants for their enthusiastic participation.
Footnotes
Presented in part at the annual meeting of the Association for Research in Vision and Ophthalmology, Fort Lauderdale, Florida, May 2005.
Disclosure: A. Iannaccone, Bausch & Lomb (F), Kemin Foods (F); M. Mura, None; K.T. Gallaher, None; E.J. Johnson, None; W.A. Todd, None; E. Kenyon, None; T.L. Harris, None; T. Harris, None; S. Satterfield, None; K.C. Johnson, None; S.B. Kritchevsky, None
References
- 1.Snodderly DM. Evidence for protection against age-related macular degeneration by carotenoids and antioxidant vitamins. Am J Clin Nutr. 1995;62:1448S–1461S. doi: 10.1093/ajcn/62.6.1448S. [DOI] [PubMed] [Google Scholar]
- 2.Beatty S, Boulton M, Henson D, Koh HH, Murray IJ. Macular pigment and age-related macular degeneration. Br J Ophthalmol. 1999;83:867–877. doi: 10.1136/bjo.83.7.867. [DOI] [PMC free article] [PubMed] [Google Scholar]
- 3.Mares-Perlman JA, Millen AE, Ficek TL, Hankinson SE. The body of evidence to support a protective role for lutein and zeaxanthin in delaying chronic disease: overview. J Nutr. 2002;132:518S–524S. doi: 10.1093/jn/132.3.518S. [DOI] [PubMed] [Google Scholar]
- 4.Ahmed SS, Lott MN, Marcus DM. The macular xanthophylls. Surv Ophthalmol. 2005;50:183–193. doi: 10.1016/j.survophthal.2004.12.009. [DOI] [PubMed] [Google Scholar]
- 5.Wooten BR, Hammond BR. Macular pigment: influences on visual acuity and visibility. Prog Retin Eye Res. 2002;21:225–240. doi: 10.1016/s1350-9462(02)00003-4. [DOI] [PubMed] [Google Scholar]
- 6.Schalch W. Carotenoids in the retina: a review of their possible role in preventing or limiting damage caused by light and oxygen. In: Ement I, Chance B, editors. Free Radicals and Aging. Basel, Switzerland: Birkhauser Verlag; 1992. pp. 280–298. [DOI] [PubMed] [Google Scholar]
- 7.Eye Disease Control Study Group. Antioxidant status and neovascular age-related macular degeneration. Arch Ophthalmol. 1993;111:104–109. doi: 10.1001/archopht.1993.01090010108035. [DOI] [PubMed] [Google Scholar]
- 8.Mares-Perlman JA, Brady WE, Klein R, et al. Serum antioxidants and age-related macular degeneration in a population-based case-control study. Arch Ophthalmol. 1995;113:1518–1523. doi: 10.1001/archopht.1995.01100120048007. [DOI] [PubMed] [Google Scholar]
- 9.Mares-Perlman JA, Klein R, Klein BEK, et al. Association of zinc and antioxidant nutrients with age-related maculopathy. Arch Ophthalmol. 1996;114:991–997. doi: 10.1001/archopht.1996.01100140199014. [DOI] [PubMed] [Google Scholar]
- 10.Smith W, Mitchell P, Rochester C. Serum beta carotene, alpha tocopherol, and age-related maculopathy: the Blue Mountains Eye Study. Am J Ophthalmol. 1997;124:838–840. doi: 10.1016/s0002-9394(14)71702-7. [DOI] [PubMed] [Google Scholar]
- 11.Teikari JM, Laatikainen L, Virtamo J, et al. Six-year supplementation with alpha-tocopherol and beta-carotene and age-related maculopathy. Acta Ophthalmol Scand. 1998;1998:224–229. doi: 10.1034/j.1600-0420.1998.760220.x. [DOI] [PubMed] [Google Scholar]
- 12.VandenLangenberg GM, Mares-Perlman JA, Klein R, Klein BEK, Brady WE, Palta M. Associations between antioxidant and zinc intake and the 5-year incidence of early age-related maculopathy in the Beaver Dam Eye Study. Am J Epidemiol. 1998;148:204–214. doi: 10.1093/oxfordjournals.aje.a009625. [DOI] [PubMed] [Google Scholar]
- 13.Delcourt C, Cristol J, Tessier F, Leger CL, Descomps B, Papoz L. Age-related macular degeneration and antioxidant status in the POLA Study. Arch Ophthalmol. 1999;117:1384–1390. doi: 10.1001/archopht.117.10.1384. [DOI] [PubMed] [Google Scholar]
- 14.Smith W, Mitchell P, Webb K, Leeder SR. Dietary antioxidants and age-related maculopathy: the Blue Mountains Eye Study. Ophthalmology. 1999;106:761–767. doi: 10.1016/S0161-6420(99)90164-1. [DOI] [PubMed] [Google Scholar]
- 15.Flood V, Smith W, Wang JJ, Manzi F, Webb K, Mitchell P. Dietary antioxidant intake and incidence of early age-related maculopathy: the Blue Mountains Eye Study. Ophthalmology. 2002;109:2272–2278. doi: 10.1016/s0161-6420(02)01263-0. [DOI] [PubMed] [Google Scholar]
- 16.Gale CR, Hall NF, Phillips DI, Martyn CN. Lutein and zeaxanthin status and risk of age-related macular degeneration. Invest Ophthalmol Vis Sci. 2003;44:2461–2465. doi: 10.1167/iovs.02-0929. [DOI] [PubMed] [Google Scholar]
- 17.Bone RA, Landrum JT. Heterochromatic flicker photometry. Arch Biochem Biophys. 2004;430:137–142. doi: 10.1016/j.abb.2004.04.003. [DOI] [PubMed] [Google Scholar]
- 18.Bernstein PS, Zhao DY, Sharifzadeh M, Ermakov IV, Gellermann W. Resonance Raman measurement of macular carotenoids in the living human eye. Arch Biochem Biophys. 2004;430:163–169. doi: 10.1016/j.abb.2004.07.004. [DOI] [PubMed] [Google Scholar]
- 19.Berendschot TT, van Norren D. Objective determination of the macular pigment optical density using fundus reflectance spectroscopy. Arch Biochem Biophys. 2004;430:149–155. doi: 10.1016/j.abb.2004.04.029. [DOI] [PubMed] [Google Scholar]
- 20.Delori FC. Autofluorescence method to measure macular pigment optical densities fluorometry and autofluorescence imaging. Arch Biochem Biophys. 2004;430:156–162. doi: 10.1016/j.abb.2004.05.016. [DOI] [PubMed] [Google Scholar]
- 21.Moreland JD. Macular pigment assessment by motion photometry. Arch Biochem Biophys. 2004;430:143–148. doi: 10.1016/j.abb.2004.06.024. [DOI] [PubMed] [Google Scholar]
- 22.Snodderly DM, Hammond BR., Jr . In vivo psychophysical assessment of nutritional and environmental influences on human ocular tissues: lens and macular pigment. In: Taylor AJ, editor. Nutritional and Environmental Influences on the Eye. Boca Raton, FL: CRC Press; 1999. pp. 251–273. [Google Scholar]
- 23.Hammond BR, Jr, Fuld K. Interocular differences in macular pigment density. Invest Ophthalmol Vis Sci. 1992;33:350–355. [PubMed] [Google Scholar]
- 24.Hammond BR, Jr, Fuld K, Curran-Celentano J. Macular pigment density in monozygotic twins. Invest Ophthalmol Vis Sci. 1995;36:2531–2541. [PubMed] [Google Scholar]
- 25.Hammond BR, Jr, Wooten BR, Snodderly DM. Cigarette smoking and retinal carotenoids: implications for age-related macular degeneration. Vision Res. 1996;36:3003–3009. doi: 10.1016/0042-6989(96)00008-9. [DOI] [PubMed] [Google Scholar]
- 26.Hammond BR, Jr, Fuld K, Snodderly DM. Iris color and macular pigment optical density. Exp Eye Res. 1996;62:293–297. doi: 10.1006/exer.1996.0035. [DOI] [PubMed] [Google Scholar]
- 27.Hammond BR, Jr, Curran-Celentano J, Judd S, et al. Sex differences in macular pigment optical density: relation to plasma carotenoid concentrations and dietary patterns. Vision Res. 1996;36:2001–2012. doi: 10.1016/0042-6989(95)00290-1. [DOI] [PubMed] [Google Scholar]
- 28.Hammond BR, Jr, Johnson EJ, Russell RM, et al. Dietary modification of human macular pigment density. Invest Ophthalmol Vis Sci. 1997;38:1795–1801. [PubMed] [Google Scholar]
- 29.Hammond BR, Jr, Wooten BR, Snodderly DM. Density of the human crystalline lens is related to the macular pigment carotenoids, lutein and zeaxanthin. Optom Vis Sci. 1997;74:499–504. doi: 10.1097/00006324-199707000-00017. [DOI] [PubMed] [Google Scholar]
- 30.Landrum JT, Bone RA, Joa H, Kilburn MD, Moore LL, Sprague KE. A one year study of the macular pigment: the effect of 140 days of a lutein supplement. Exp Eye Res. 1997;65:57–62. doi: 10.1006/exer.1997.0309. [DOI] [PubMed] [Google Scholar]
- 31.Hammond BR, Jr, Wooten BR, Snodderly DM. Preservation of visual sensitivity of older subjects: association with macular pigment density. Invest Ophthalmol Vis Sci. 1998;39:397–406. [PubMed] [Google Scholar]
- 32.Wooten BR, Hammond BR, Jr, Land RI, Snodderly MD. A practical method for measuring macular pigment optical density. Invest Ophthalmol Vis Sci. 1999;40:2481–2489. [PubMed] [Google Scholar]
- 33.Cooper DA, Curran-Celentano J, Ciulla TA, et al. Olestra consumption is not associated with macular pigment optical density in a cross-sectional volunteer sample in Indianapolis. J Nutr. 2000;130:642–647. doi: 10.1093/jn/130.3.642. [DOI] [PubMed] [Google Scholar]
- 34.Hammond BR, Jr, Caruso-Avery M. Macular pigment optical density in a southwestern sample. Invest Ophthalmol Vis Sci. 2000;41:1492–1497. [PubMed] [Google Scholar]
- 35.Johnson EJ, Hammond BR, Jr, Yeum KJ, et al. Relation among serum and tissue concentrations of lutein and zeaxanthin and macular pigment density. Am J Clin Nutr. 2000;71:1555–1562. doi: 10.1093/ajcn/71.6.1555. [DOI] [PubMed] [Google Scholar]
- 36.Beatty S, Murray IJ, Henson DB, Carden D, Koh H-H, Boulton ME. Macular pigment and risk for age-related macular degeneration in subjects from a northern European population. Invest Ophthalmol Vis Sci. 2001;42:439–446. [PubMed] [Google Scholar]
- 37.Ciulla TA, Hammond BR, Jr, Yung CW, Pratt LM. Macular pigment optical density before and after cataract extraction. Invest Ophthalmol Vis Sci. 2001;42:1338–1341. [PubMed] [Google Scholar]
- 38.Ciulla TA, Curran-Celantano J, Cooper DA, et al. Macular pigment optical density in a Midwestern sample. Ophthalmology. 2001;108:730–737. doi: 10.1016/s0161-6420(00)00655-2. [DOI] [PubMed] [Google Scholar]
- 39.Curran-Celentano J, Hammond BR, Jr, Ciulla TA, Cooper DA, Pratt LM, Danis RB. Relation between dietary intake, serum concentrations, and retinal concentrations of lutein and zeaxanthin in adults in a Midwest population. Am J Clin Nutr. 2001;74:796–802. doi: 10.1093/ajcn/74.6.796. [DOI] [PubMed] [Google Scholar]
- 40.Delori FC, Goger DG, Hammond BR, Snodderly DM, Burns SA. Macular pigment density measured by autofluorescence spectrometry: comparison with reflectometry and heterochromatic flicker photometry. J Opt Soc Am A Opt Image Sci Vis. 2001;18:1212–1230. doi: 10.1364/josaa.18.001212. [DOI] [PubMed] [Google Scholar]
- 41.Hammond BR, Jr, Ciulla TA, Snodderly DM. Macular pigment density is reduced in obese subjects. Invest Ophthalmol Vis Sci. 2002;43:47–50. [PubMed] [Google Scholar]
- 42.Snodderly DM, Mares JA, Wooten BR, Oxton L, Gruber M, Ficek T. Macular pigment measurement by heterochromatic flicker photometry in older subjects: the carotenoids and Age-Related Eye Disease Study. Invest Ophthalmol Vis Sci. 2004;45:531–538. doi: 10.1167/iovs.03-0762. [DOI] [PubMed] [Google Scholar]
- 43.Ciulla TA, Hammond BR., Jr Macular pigment density and aging, assessed in the normal elderly and those with cataracts and age-related macular degeneration. Am J Ophthalmol. 2004;138:582–587. doi: 10.1016/j.ajo.2004.05.057. [DOI] [PubMed] [Google Scholar]
- 44.Koh HH, Murray IJ, Nolan D, Carden D, Feather J, Beatty S. Plasma and macular responses to lutein supplement in subjects with and without age-related maculopathy: a pilot study. Exp Eye Res. 2004;79:21–27. doi: 10.1016/j.exer.2004.03.001. [DOI] [PubMed] [Google Scholar]
- 45.Nolan J, O’Donovan O, Kavanagh H, et al. Macular pigment and percentage of body fat. Invest Ophthalmol Vis Sci. 2004;45:3940–3950. doi: 10.1167/iovs.04-0273. [DOI] [PubMed] [Google Scholar]
- 46.Berendschot TT, van Norren D. On the age dependency of the macular pigment optical density. Exp Eye Res. 2005;81:602–609. doi: 10.1016/j.exer.2005.03.019. [DOI] [PubMed] [Google Scholar]
- 47.The Age-Related Eye Disease Study Research Group. The Age-Related Eye Disease Study (AREDS) system for classifying cataracts from photographs: AREDS report No. 4. Am J Ophthalmol. 2001;131:167–175. doi: 10.1016/s0002-9394(00)00732-7. [DOI] [PMC free article] [PubMed] [Google Scholar]
- 48.Age-Related Eye Disease Study Research Group. The Age-Related Eye Disease Study system for classifying age-related macular degeneration from stereoscopic color fundus photographs: the Age-Related Eye Disease Study Report Number 6. Am J Ophthalmol. 2001;132:668–681. doi: 10.1016/s0002-9394(01)01218-1. [DOI] [PubMed] [Google Scholar]
- 49.Aleman TS, Duncan JL, Bieber ML, et al. Macular pigment and lutein supplementation in retinitis pigmentosa and Usher syndrome. Invest Ophthalmol Vis Sci. 2001;42:1873–1881. [PubMed] [Google Scholar]
- 50.Duncan JL, Aleman TS, Gardner LM, et al. Macular pigment and lutein supplementation in choroideremia. Exp Eye Res. 2002;74:371–381. doi: 10.1006/exer.2001.1126. [DOI] [PubMed] [Google Scholar]
- 51.Mellerio J, Ahmadi-Lari S, van Kuijk F, Pauleikhoff D, Bird A, Marshall J. A portable instrument for measuring macular pigment with central fixation. Curr Eye Res. 2002;25:37–47. doi: 10.1076/ceyr.25.1.37.9961. [DOI] [PubMed] [Google Scholar]
- 52.Robson AG, Moreland JD, Pauleikhoff D, et al. Macular pigment density and distribution: comparison of fundus autofluorescence with minimum motion photometry. Vision Res. 2003;43:1765–1775. doi: 10.1016/s0042-6989(03)00280-3. [DOI] [PubMed] [Google Scholar]
- 53.Berendschot TT, Goldbohm RA, Klopping WA, van de Kraats J, van Norel J, van Norren D. Influence of lutein supplementation on macular pigment, assessed with two objective techniques. Invest Ophthalmol Vis Sci. 2000;41:3322–3326. [PubMed] [Google Scholar]
- 54.Friedman DS, O’Colmain BJ, Munoz B, et al. Prevalence of age-related macular degeneration in the United States. Arch Ophthalmol. 2004;122:564–572. doi: 10.1001/archopht.122.4.564. [DOI] [PubMed] [Google Scholar]
- 55.Clemons TE, Milton RC, Klein R, Seddon JM, Ferris FL., 3rd Risk factors for the incidence of advanced age-related macular degeneration in the Age-Related Eye Disease Study (AREDS) AREDS report no. 19. Ophthalmology. 2005;112:533–539. doi: 10.1016/j.ophtha.2004.10.047. [DOI] [PMC free article] [PubMed] [Google Scholar]
- 56.Gruber M, Chappell R, Millen A, et al. Correlates of serum lutein + zeaxanthin: findings from the Third National Health and Nutrition Examination Survey. J Nutr. 2004;134:2387–2394. doi: 10.1093/jn/134.9.2387. [DOI] [PubMed] [Google Scholar]
- 57.Bernstein PS, Zhao DY, Wintch SW, Ermakov IV, McClane RW, Gellermann W. Resonance Raman measurement of macular carotenoids in normal subjects and in age-related macular degeneration patients. Ophthalmology. 2002;109:1780–1787. doi: 10.1016/s0161-6420(02)01173-9. [DOI] [PMC free article] [PubMed] [Google Scholar]
- 58.Hammond BR, Jr, Wooten BR, Snodderly DM. Individual variations in the spatial profile of human macular pigment. J Opt Soc Am A. 1997;14:1187–1196. doi: 10.1364/josaa.14.001187. [DOI] [PubMed] [Google Scholar]
- 59.Wooten BR, Hammond BR. Assessment of the Raman method of measuring human macular pigment (E-letter) Invest Ophthalmol Vis Sci. Available at http://www.iovs.org/cgi/eletters/39/11/2003#73. Published August 15, 2003.
- 60.Bernstein PS, Gellermann W. Author Response: Assessment of the Raman method of measuring human macular pigment (E-letter) Invest Ophthalmol Vis Sci. Available at http://www.iovs.org/cgi/eletters/39/11/2003#74. Published August 15, 2003.
- 61.Wooten BR, Hammond BR. Assessment of the Raman method of measuring human macular pigment. II (E-letter) Invest Ophthalmol Vis Sci. Available at http://www.iovs.org/cgi/eletters/39/11/2003#92. Published December 30, 2003.
- 62.Bernstein PS, Gellermann W. Author Response: Assessment of the Raman method of measuring human macular pigment. II (E-letter) Invest Ophthalmol Vis Sci. Available at http://www.iovs.org/cgi/eletters/39/11/2003#94. Published December 30, 2003.
- 63.Maguire P, Vine AK. Geographic atrophy of the retinal pigment epithelium. Am J Ophthalmol. 1986;102:621–625. doi: 10.1016/0002-9394(86)90535-0. [DOI] [PubMed] [Google Scholar]
- 64.Sarks JP, Sarks SH, Killingsworth MC. Evolution of geographic atrophy of the retinal pigment epithelium. Eye. 1988;2:552–577. doi: 10.1038/eye.1988.106. [DOI] [PubMed] [Google Scholar]
- 65.Schatz H, McDonald HR. Atrophic macular degeneration: rate of spread of geographic atrophy and visual loss. Ophthalmology. 1989;96:1541–1551. doi: 10.1016/s0161-6420(89)32694-7. [DOI] [PubMed] [Google Scholar]
- 66.Sunness JS, Rubin GS, Applegate CA, et al. Visual function abnormalities and prognosis in eyes with age-related geographic atrophy of the macula and good visual acuity. Ophthalmology. 1997;104:1677–1691. doi: 10.1016/s0161-6420(97)30079-7. [DOI] [PMC free article] [PubMed] [Google Scholar]
- 67.Sunness JS, Gonzalez-Baron J, Applegate CA, et al. Enlargement of atrophy and visual acuity loss in the geographic atrophy form of age-related macular degeneration. Ophthalmology. 1999;106:1768–1779. doi: 10.1016/S0161-6420(99)90340-8. [DOI] [PubMed] [Google Scholar]
Associated Data
This section collects any data citations, data availability statements, or supplementary materials included in this article.