Abstract
Bacteria form architecturally complex communities known as biofilms in which cells are held together by an extracellular matrix. Biofilms harbor multiple cell types, and it has been proposed that within biofilms individual cells follow different developmental pathways, resulting in heterogeneous populations. Here we demonstrate cellular differentiation within biofilms of the spore-forming bacterium Bacillus subtilis, and present evidence that formation of the biofilm governs differentiation. We show that motile, matrix-producing, and sporulating cells localize to distinct regions within the biofilm, and that the localization and percentage of each cell type is dynamic throughout development of the community. Importantly, mutants that do not produce extracellular matrix form unstructured biofilms that are deficient in sporulation. We propose that sporulation is a culminating feature of biofilm formation, and that spore formation is coupled to the formation of an architecturally complex community of cells.
[Keywords: Bacillus, biofilm, cell fate, development, multicellularity]
Spatiotemporal regulation of gene expression is essential for the development of multicellular organisms. Mounting evidence indicates that the majority of bacteria have the capacity to form multicellular surface-associated assemblages referred to as biofilms (O’Toole et al. 2000; Stoodley et al. 2002). A hallmark of biofilms is that bacteria within them display increased resistance to antibiotics and environmental stresses, making them particularly problematic in clinical and industrial settings (Watnick and Kolter 2000; Kolter and Greenberg 2006). It has been proposed that biofilms comprise a heterogeneous population of individual cells that have followed different developmental pathways (Lazazzera 2005; An and Parsek 2007). However, there is limited direct evidence for cellular differentiation within biofilms, and the possible impact of biofilm architecture on differentiation has not been previously explored. We chose Bacillus subtilis as a model organism to study differentiation within a biofilm because it undergoes several well-characterized developmental pathways (Dubnau and Losick 2006; Smits et al. 2006).
In order to grow in multicellular biofilm communities, bacteria often produce an extracellular matrix that holds the community together. In B. subtilis, extracellular matrix production is governed by the transcriptional repressor SinR, which directly binds to the promoters of the epsA-O and yqxM-sipW-tasA operons (Kearns et al. 2005) (henceforth eps and yqxM, respectively). These operons encode the exopolysaccharide (EPS) and major protein (TasA) components of the matrix (Branda et al. 2006). At the initiation of biofilm formation, SinR is sequestered by its antagonist SinI, resulting in the production of the extracellular matrix (Kearns et al. 2005). While sinR is expressed constitutively, sinI is under the positive control of the phosphorylated form of the transcription factor Spo0A (Shafikhani et al. 2002).
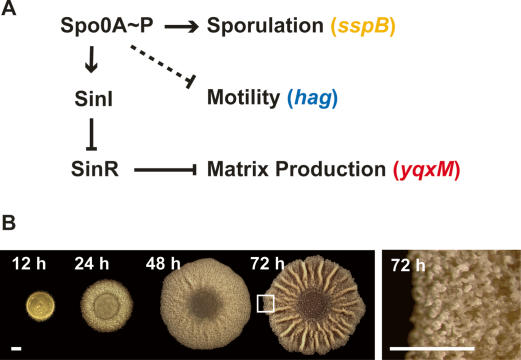
Spo0A is phosphorylated in response to conditions of nutrient limitation via a complex phosphorelay (Burbulys et al. 1991; Stephenson and Hoch 2002) and directly or indirectly regulates the transcription of genes involved in matrix production, motility, and sporulation (Fig. 1A; Fujita et al. 2005). Inherent noise in gene expression and a positive feedback loop result in a bimodal distribution in which some cells attain high levels of Spo0A activity (Spo0A-ON cells) and other cells a relatively low level (Spo0A-OFF cells) (Chung et al. 1994; Gonzalez-Pastor et al. 2003; Dubnau and Losick 2006; Veening et al. 2006b). Interestingly, this is not a simple ON/OFF switch in that the level of the phosphoprotein rises gradually in cells that ultimately attain a high level of Spo0A activity (Fujita and Losick 2005). As a consequence of being regulated by Spo0A, SinI expression and activity are also bimodal in liquid cultures (Chai et al. 2007). While the regulatory processes controlling B. subtilis differentiation have been extensively characterized in dispersed populations, little is known about how distinct cell types arise in multicellular biofilm communities.
Figure 1.
(A) Working model of the regulation of differentiation. Intracellular changes in the concentration of Spo0A∼P regulate differential gene expression. While sporulation requires high Spo0A∼P levels, the expression of SinI is achieved at lower levels of Spo0A∼P. When expressed, SinI antagonizes SinR, which directly represses genes involved in extracellular matrix production. Spo0A∼P is also involved in repressing motility. Solid lines indicate known regulatory mechanisms while the dashed line indicates an unknown mechanism. The sspB, hag, and yqxM genes are expressed in sporulating, motile, and matrix-producing cells, respectively. (B) Top view of biofilm development over time. The right panel is magnified to highlight the aerial structures observed at 72 h. The boxed region indicates the portion of the biofilm displayed later in Figure 3. Bars, 1 mm.
B. subtilis biofilms develop on an agar surface as architecturally complex colonies (Branda et al. 2001). Figure 1B (left panel) shows the development of a typical biofilm over the course of 72 h. Mature biofilms form aerial projections described as “fruiting body-like” because they serve as preferential sites for sporulation (Fig. 1B, right panel; Branda et al. 2001; Veening et al. 2006a). In this paper, we analyze the spatial and temporal regulation of gene expression within biofilms. We use fluorescence reporters under the control of cell-type-specific promoters, coupled with microscopy, to visualize the localization of three distinct physiological states within a biofilm. We demonstrate that gene expression is spatially and temporally regulated, and that at least three cell types (motile, matrix-producing, and sporulating) coexist in a mature biofilm. Furthermore, we show that the spatial and temporal regulation of gene expression is defective in mutants that cannot produce extracellular matrix and do not display complex architecture.
Results
Biofilms comprise heterogeneous populations
Our first goal was to determine the temporal dynamics of cellular differentiation within a biofilm. Prior studies have reported differential gene expression during biofilm development; however, population heterogeneity has not been taken into account in these analyses (Lazazzera 2005; An and Parsek 2007). We focused our studies on three distinct cell types: motile, matrix-producing, and sporulating. These cell types can be distinguished by monitoring gene expression; hag encodes flagellin and is essential for motility (Mirel and Chamberlin 1989), the yqxM operon encodes the major protein component of the extracellular matrix (Branda et al. 2006; Chu et al. 2006), and sspB encodes a small acid-soluble protein found only in sporulating cells (see Fig. 1A; Setlow 1988). The expression of these genes was followed by monitoring fluorescence after fusing their promoters to genes encoding fluorescent proteins. The fluorescence reporter constructs were integrated into the amyE locus, a neutral site on the B. subtilis chromosome (Guerout-Fleury et al. 1996).
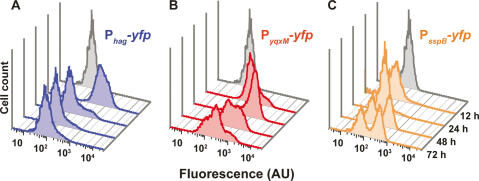
We determined the population dynamics of a B. subtilis biofilm as a function of time by harvesting samples from biofilms expressing Phag-yfp, PyqxM-yfp, or PsspB-yfp reporters at 12, 24, 48, and 72 h of development. After dispersing the biofilms, we used flow cytometry to quantify the subpopulations expressing each reporter. Our results showed that at 12 h, early in biofilm formation, the majority of the cells were motile. However, this population diminished as the biofilm matured (Fig. 2A). Analysis of cells expressing the matrix-specific promoter showed a peak of expression at 24 h (Fig. 2B), while sporulation did not commence until 48 h of biofilm formation (Fig. 2C). These data indicate that gene expression is dynamic throughout biofilm development, and that at least three distinct cell types coexist within a mature biofilm.
Figure 2.
Flow cytometry analysis of cells expressing Phag-yfp reporters (motility, blue shading) (A), PyqxM-yfp reporters (matrix-production, red shading) (B), or PsspB-yfp reporters (sporulation, orange shading) (C). Expression was followed over a period of 72 h. In gray is the peak for control cells with no yfp reporter. The Y-axis represents cell counts for each strain (30,000 cells were counted) at 12-, 24-, 48-, and 72-h time points. The X-axis is arbitrary units (AU) of fluorescence in a logarithmic scale.
Cells within a biofilm display spatiotemporal organization
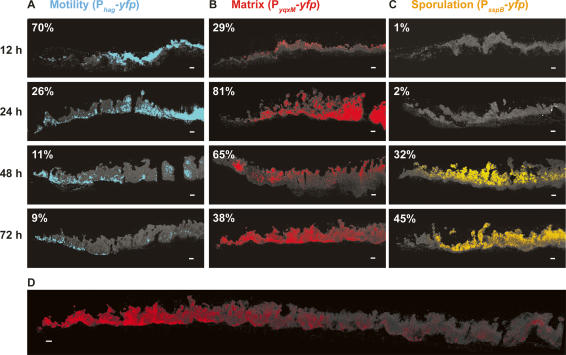
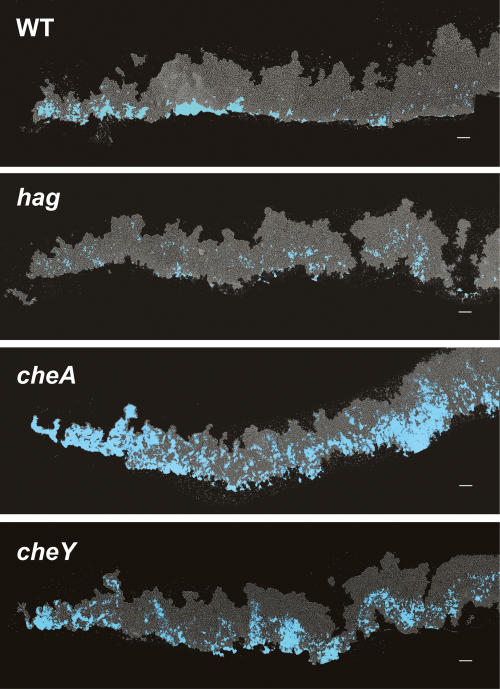
It is thought that biofilm structure results in microenvironments due to gradients of nutrients, oxygen, and self-generated signals (Werner et al. 2004; Rani et al. 2007). These microenvironments, coupled with the bistable states described for many differentiation processes, have been proposed to ultimately lead to different cell types in specific regions of the biofilm (Raser and O’Shea 2005; Kolter and Greenberg 2006). To determine if the motile, matrix-producing, and sporulating cells localize to distinct regions of the biofilm, we used thin sectioning coupled with fluorescence microscopy. It was necessary to use thin sections because B. subtilis biofilms can have a height of up to 1 mm, which is too thick to visualize using live microscopy techniques. Analysis of vertical sections of biofilms using fluorescence microscopy revealed well-defined zones of gene expression for each of the three cell types analyzed (Fig. 3). Consistent with our flow cytometric analyses of disrupted biofilms, the images obtained showed that in young biofilms (12 h) the majority of cells were motile. As time progressed, the proportion of motile cells in the population was dramatically reduced and the remaining cells expressing Phag-yfp appeared to move to the base and edge of the biofilm (Fig. 3A). This localization was likely due to directed motility because cells expressing a Phag-cfp reporter in mutant strains that lack flagella or are defective in chemotaxis remained dispersed throughout the biofilm (Fig. 4).
Figure 3.
Spatiotemporal analysis of differentiation within a biofilm. Vertical thin sections of biofilms harboring the indicated reporter fusions. (Left) Biofilms were frozen at the indicated times of development prior to cryosectioning and fixation. Images represent only partial colonies approximately encompassing the region magnified in Figure 1B. The edge of the colony is shown at the left of the image, the agar surface is at the bottom. Transmitted light images (cells appear gray on the black background) were overlaid with fluorescence images that were false-colored blue for motility (A), red for matrix production (B), and orange for sporulation (C). The percentage of fluorescent cells was obtained by flow cytometry, and is indicated in the top left of each image. Percentages represent the average obtained from three independent experiments. (D) Image of 72-h thin section from B encompassing the edge to the center of the colony. Bars, 50 μm.
Figure 4.
Motility is required for proper localization of Phag-cfpexpressing cells (blue). Vertical thin sections of biofilms harvested at 48 h of development. hag encodes flagellin, and cheA and cheY are necessary for chemotaxis. Colony orientation is as in Figure 3. Bar, 50 μm.
In marked contrast to the defined localization of motile cells, matrix-producing cells were present in patches throughout the biofilm (Fig. 3B). These cells are responsible for producing the extracellular matrix that holds the community together and their random distribution could facilitate maximal dispersal of the matrix throughout the colony. While the flow cytometry data indicated an overall decrease in matrix-producing cells in the entire biofilm (from 65% at 48 h to 38% at 72 h), the density of matrix-producing cells was greater toward the edge of the colony at 72 h (Fig. 3D). This difference accounts for the seeming discrepancy between the quantitative and visual data in Figure 3B, where only the edge of the colony is shown.
Consistent with what has been reported previously (Branda et al. 2001; Veening et al. 2006a), image analysis of PsspB-yfp showed that sporulation occurs late and preferentially in the aerial structures (Fig. 3C). While this distribution might suggest that spores, or the process of sporulation, contribute to both the architecture and spatiotemporal organization of the biofilm, this is not the case, as mutants unable to form spores (e.g., sigF) still displayed wild-type architecture and spatiotemporal organization (data not shown). It should be noted that the sspB gene, whose expression we used for quantification, is expressed late in sporulation but not in mature spores. Because spores are dormant cells in which there is little or no gene expression, the PsspB-yfp gene is not expressed to a visible level. Therefore, the percent of cells expressing PsspB-yfp is an underrepresentation of the percent of cells that have undergone sporulation in the biofilm.
A defined cell lineage exists in biofilm development
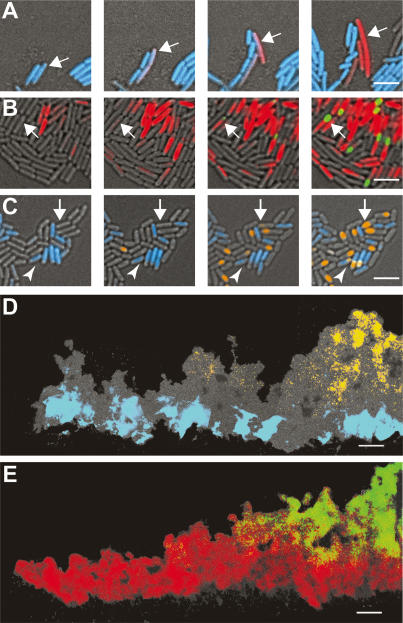
Knowing that different cell types coexist within the biofilm prompts questions regarding cell lineage. What is the developmental history of individual cells that leads to discrete subpopulations in the biofilm? To address this question, we introduced pairwise combinations of the transcriptional reporters described above into an individual strain. Fluorescence is used as a proxy for transcription of the cell-type-specific promoters. The fluorescent proteins we use are unstable under these conditions since we are able to observe the loss of fluorescence within as little as a 1-h period. As outlined in Figure 1A, in the absence of SinI, SinR represses matrix production. As levels of Spo0A∼P increase, SinI is produced and antagonizes SinR resulting in matrix production. At the same time, Spo0A∼P indirectly represses motility gene expression and motility ceases. Thus, this model predicts that as an individual cell represses motility it should begin to produce a matrix. To test this prediction, we followed cell fate in live biofilms by monitoring the expression of Phag-cfp and PyqxM-yfp using time-lapse microscopy. Indeed, the prediction was confirmed and we did not observe coexpression of the reporters in these experiments. Rather, as time progressed, motile cells switched to become matrix-producing cells (Fig. 5A). This process is not irreversible, however, as we did observe a few cells transition from a matrix-producing state back to a motile state (data not shown).
Figure 5.
Developmental history of cells within a biofilm. Time-lapse images of cells harboring dual reporter fusions. (A) Images of cells harboring Phag-cfp (motile cells, blue) and PyqxM-yfp (matrix-producing cells, red) were taken every 1 h. Arrow indicates a motile cell transitioning to matrix-producing cell. (B) Images of cells harboring PyqxM-cfp (matrix-producing cells, red) and PsspB-yfp (sporulating cells, green) were taken every 2 h. Arrow highlights a cell initiating matrix production and then transitioning to a sporulating cell. (C) Images of cells harboring Phag-cfp (motile cells, blue) and PsspB-yfp (sporulating cells, orange) were taken every 2 h. The majority of the sporulating cells arise from nonmotile cells, indicated by the white arrow. The arrowhead highlights an example of the minority of motile cells that initiate sporulation. (D,E) Thin sections of 48-h colonies from cells harboring dual reporters. Images formatted as in Figure 3. In D, motile cells (blue) appear in distinct regions relative to sporulating cells (orange), whereas in E, matrix-producing cells (red) overlap with the region of sporulating cells (green). Bars: A–C, 5 μm; D,E, 50 μm.
As biofilm development continues and sporulating cells begin to arise, do they come from motile cells, matrix-producing cells, or both? We analyzed this cell-fate determination pathway using two strains, one with PsspB-yfp and PyqxM-cfp and the other with PsspB-yfp and Phag-cfp. We observed that most sporulating cells were derived from matrix-producing cells (Fig. 5B) with very few sporulating cells arising from motile cells (Fig. 5C). Thus, under these conditions, motile cells differentiate into matrix-producing cells, which in turn, give rise to sporulating cells. This specific cell lineage was strikingly evident when the spatial distribution of expression in the double fusion strains was analyzed in mature biofilms. In vertical thin sections motile and sporulating cells were physically separated (Fig. 5D), while matrix-producing and sporulating cells had a region of overlap (Fig. 5E).
An extracellular matrix is required for differentiation of cells within the biofilm
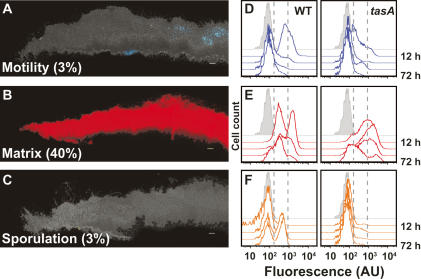
Given the cell lineage described above, we wondered if arresting development by blocking extracellular matrix production would also lead to an arrest in the development of spores. In fact, blocking matrix production with a deletion of tasA results in severely defective architecture (Branda et al. 2006) and markedly reduced spore formation within the biofilm (Fig. 6). Inspection of the anatomy of a tasA mutant biofilm using the reporter fusions and thin sectioning revealed dramatic alterations in the amount and localization of the three cell types at 72 h. In the mutant biofilm, there was a massive decrease in the expression of the motility-specific reporter relative to wild type (cf. Figs. 6A and 3A, bottom panels). The few cells that did express Phag-yfp were not localized to the base of the biofilm as was observed in wild-type colonies. Instead, we observed that many cells in the biofilm expressed PyqxM-yfp (Fig. 6B). Using flow cytometry we analyzed the dynamics of gene expression over the course of biofilm development and observed that even early in biofilm formation (12 h) a subpopulation of cells expressed the matrix-reporter PyqxM-yfp at high levels in the tasA mutant relative to the wild type (Fig. 6E, 12-h trace). Concomitant with the increase of matrix-producing cells, we observed a dramatic decrease in motility gene expression at the 12 h time point (Fig. 6D). A subpopulation of cells expressing PyqxM-yfp highly was maintained in the tasA mutant for all time points (Fig. 6E). Strikingly, in both thin-sectioning and flow cytometry analyses, there were virtually no sporulating cells in the matrix-deficient biofilm (Fig. 6C,F).
Figure 6.
The effect of an altered extracellular matrix (tasA) on spatiotemporal regulation of gene expression. (A–C) Thin sections of 72-h tasA mutant biofilms harboring the indicated reporters. False coloring for each reporter and colony orientation is as in Figure 3. The percent of cells expressing each reporter obtained by flow cytometry is indicated in the bottom left corner of each image. Bar, 50 μm. (D–F) Dynamics of gene expression are altered in a matrix-deficient mutant. Flow cytometry analysis as in Figure 2. Wild-type (left panels) versus tasA mutant (right panels) cells obtained from biofilms harvested at 12, 24, 48, or 72 h. Gray peak indicates fluorescence intensity of cells with no fluorescent reporter. Reporters used are Phag-yfp for motility (D), PyqxM-yfp for matrix production (E), and PsspB-yfp for sporulation (F). Dashed gray lines bracket low fluorescence levels. To the left are cells not expressing the reporters, and to the right are cells expressing high levels of fluorescence.
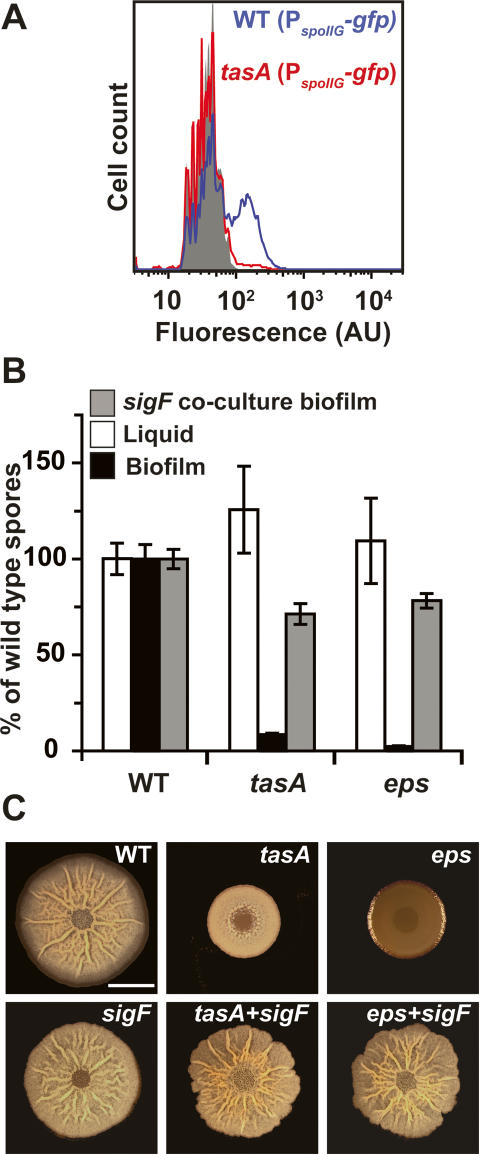
In order to better understand the nature of the sporulation defect in the tasA mutant biofilm we assayed the expression of genes that should be activated early in the sporulation pathway. Specifically, we were interested in determining if the decreased expression of PsspB stemmed from decreased Spo0A activity. To this end, we generated a GFP reporter under the control of the spoIIG promoter and introduced it into wild-type or tasA mutant cells. spoIIG is directly induced by high levels of Spo0A∼P (Fujita et al. 2005). We harvested biofilm samples at 12–48 h and observed that there was negligible expression of PspoIIG-gfp in the tasA mutant for all time points. Figure 7A shows expression of PspoIIG-gfp in the tasA mutant compared with wild type at 36 h, the time that we observe a peak of expression in wild-type cells.
Figure 7.
The effect of an altered extracellular matrix on gene expression, sporulation, and biofilm architecture. (A) Flow cytometry analysis of PspoIIG-gfp expression as in Figure 2. Wild-type (blue line) and tasA mutant (red line) cells obtained from biofilms harvested at 36 h. Gray peak indicates fluorescence intensity of cells with no fluorescent reporter. (B) Viable spore counts comparing mutants in matrix production (tasA and eps) to wild-type percent of spores in biofilms (black bars) or liquid cultures (white bars). Sporulation was restored by coculturing the different strains with a nonsporulating (sigF) mutant (gray bars). Error bars indicate SEM. (C) Coculturing restores biofilm architecture to matrix-deficient mutants. Top view of biofilms from wild-type, tasA, and eps (top panels) and sigF and cocultures of tasA or eps cells mixed at a 1:1 ratio with a sigF mutant (bottom panels) after 72 h of incubation at 30°C. Bar, 1 cm.
Does the reduced expression of sporulation-specific genes in the matrix-deficient tasA mutant also result in a decreased number of mature spores? Prior results show that tasA mutants are not defective in sporulation in liquid culture (Stover and Driks 1999). Thus, any decrease in the number of spores in a tasA mutant colony would indicate that the defect was biofilm-specific. Indeed, we found that after 72 h there was a dramatic decrease in the number of spores in the tasA mutant biofilms, but not in liquid culture (Fig. 7B). This result indicates that the matrix is not required for sporulation per se, but rather that normal progression through the developmental pathway is essential for proper sporulation in biofilms. Similar results were obtained with a mutant that cannot produce exopolysaccharide (eps) (Fig. 7B). Therefore, under these biofilm-forming conditions, progression through the developmental pathway is essential not only for producing architecture, but also for sporulation.
Sporulation can be restored by extracellular complementation of the matrix
It has been shown previously that the extracellular matrix is a resource that can be shared by the population and that colony architecture can be partially restored by coculturing tasA and eps mutant cells (Branda et al. 2006). To determine if sporulation could be restored in the matrix-deficient mutant biofilms, we cocultured tasA or eps mutant cells that do not produce an extracellular matrix with sigF mutant cells that produce wild-type matrix but are unable to sporulate. Mixing the wild type (data not shown) or tasA, or eps mutant at a 1:1 ratio with the sigF mutant resulted in colonies with wild-type architecture (Fig. 7C). While the tasA and eps mutant biofilms each displayed a dramatic sporulation defect on their own, sporulation was restored by coculturing with the sigF strain (Fig. 7B, gray bars). As a control, we confirmed that the spores obtained from coculturing were resistant to the expected antibiotics for matrix-deficient mutants (data not shown).
Discussion
The results presented in this work show that cellular differentiation within a biofilm occurs with a high degree of spatiotemporal organization. It has been proposed that biofilms comprise heterogeneous populations that are distinct from what is observed in dispersed populations, our results now provide direct evidence to support this proposal. For example, it was recently shown that only 2% of cells in a dispersed population express PyqxM (Chai et al. 2007). Here we show that this population distribution is dramatically altered in the structured environment of a biofilm, and that the spatiotemporal expression pattern is dynamic throughout biofilm formation. Furthermore, using time-lapse microscopy, we observed that cells appear to follow a defined lineage as the biofilm develops: Motile cells transition to matrix-producing cells, which ultimately differentiate into sporulating cells.
The requirement of a wild-type extracellular matrix for sporulation to occur efficiently within a biofilm indicates that the production of spores is somehow linked to the formation of an architecturally complex community. It was particularly interesting that the sporulation defect was only observed in the context of a biofilm and not in dispersed culture. The molecular basis for this difference is not known, but an appealing hypothesis is that the energy required for the matrix production creates local regions (microenvironments) within the static structure of the biofilm in which nutrients are severely depleted. Nutrient depletion in these microenvironments could stimulate the activation of Spo0A to high levels and hence trigger spore formation. Perhaps within the context of the biofilm the generation of local regions of nutrient depletion serves as a developmental checkpoint that ties an early step in sporulation (Spo0A activation) to the successful production of an extracellular matrix. Under conditions that the extracellular matrix is not produced the onset of sporulation would thus be delayed or halted.
While the mechanism by which this sporulation arrest might occur is unknown, it is possible that, in the absence of a matrix, signals required for activating sporulation-specific genes are either not produced or not sensed. We observed a decrease in the expression of spoIIG, a gene that is directly induced by high levels of Spo0A∼P, in a tasA mutant biofilm relative to wild-type cells. This suggests that the block in sporulation occurs upstream of Spo0A phosphorylation. We hypothesize that in the tasA mutant the Spo0A∼P concentration is maintained at a low level and does not reach the high level required for sporulation. This is consistent with the observed increase of PyqxM expression, which is active at lower levels of Spo0A∼P. Conceivably, matrix production is a significantly important drain on the energy resources, and hence the nutrient status of the community, such that in the absence of TasA production nutrients are insufficiently depleted to promote high level accumulation of Spo0A∼P. If so, then exhaustion of nutrients by the production of matrix would be the cue that triggers spore formation. In support of this hypothesis is the fact that a SinR mutant (which overproduces both the EPS and TasA components of the matrix) displays early expression of the Spo0A-regulated gene spoIIA relative to wild type (Veening et al. 2006a).
The coupling of sporulation with multicellular development has also been observed in other microorganisms. For example, Myxococcus xanthus is a multicellular bacterium that sporulates when starved, but sporulation only commences after the cells aggregate into macroscopic fruiting bodies (Sogaard-Andersen et al. 2003). Likewise, the filamentous bacterium Streptomyces coelicolor produces spores in raised structures known as aerial mycelia, and spore formation is normally dependent on the formation of the upwardly projecting hyphae (Chater 2001). Thus, mechanisms that tie sporulation to the formation of intricate multicellular communities appear to be a shared feature of otherwise unrelated developmental processes. This is not limited to prokaryotes; in Basidiomycetes such as Coprinus cinereus, fruiting bodies comprise raised mushroom structures that harbor many different cell types including fungal sexual spores (Kues 2000).
Phenotypic heterogeneity observed in dispersed clonal populations of bacteria has been attributed to stochastic gene expression (Dubnau and Losick 2006). These stochastic processes may render the biofilm-associated cells more responsive to subtle changes in external cues, eventually leading to the observed spatiotemporal organization of cells within the biofilm. We propose that, similar to eukaryotic development, a complex interplay between stochastic gene expression and environmental conditions functions to generate the morphologically complex and differentiated structures observed in biofilms.
Materials and methods
Strains, media, and culture conditions
Strains used in the study are listed in Supplemental Table 1. The B. subtilis strain NCIB3610 was used as the wild-type strain. For routine growth and spore quantification, cells were propagated on Luria-Bertani (LB) medium. For biofilm assays, cells were scraped from overnight growth on LB plates, resuspended in LB liquid medium to an A600 of 1, and 2 μL were spotted on MSgg solid medium (Branda et al. 2001). Biofilms were incubated at 30°C for the indicated times. Antibiotic concentrations (final) were as follows: MLS (1 μg mL−1 erythromycin, 25 μg mL−1 lincomycin), spectinomycin (100 μg mL−1), tetracycline (10 μg mL−1), and kanamycin (10 μg mL−1).
Strain and plasmid construction
The long-flanking homology PCR (LFH–PCR) technique was used for creating deletion mutations. Primers used to create a tasA∷kan gene replacement constructs were as follows (5′ to 3′): FtasADOb (GATGGAGCCGGAGTTCAATA), RtasADOb (CCTATCACCTCAAATGGTTCGCTGAACCTGTTGCCAG GTTTACAA), FtasAUPb (CGAGCGCCTACGAGGAATTTG TATCGAAGGACGGCCCAGTATTCA), RtasAUPb (ACATT GATTGGCCAGCGTAT). Primers used to create a hag∷kan gene replacement constructs were as follows (5′ to 3′): FhagDOb (GGGATCAACTTTGGGAGAGAGTTCCAAAACGTACTTC AATTATTAC), RhagDOb (GAGTCCTCTATTACCTTTAC), FhagUPb (CAATATTGACTATGGCAGAGC), RhagUPb (GA GAACAACCTGCACCATTGCAAGAGTTAATTCTCATTG TTTTGTTCC). For the sporulation-defective mutants, B. subtilis PY79 mutant ZK2771 (sigF∷kan) was used as donor strain for transferring the mutant allele into the B. subtilis strain NCIB3610 by means of SPP1-mediated generalized transduction (Yasbin and Young 1974).
Plasmids were constructed using standard methods and amplified in Escherichia coli DH5α. PCR fragments were amplified from NCIB3610 chromosomal DNA, using Pfu DNA polymerase. Oligonucleotides primers were purchased from IDT. To construct pHV115 (amyE∷Phag-yfp spc), a 258-base-pair (bp) DNA fragment containing the promoter sequence of hag was amplified using the primers PhagF (CCGGAATTCGAATT GACGCCCCAAAGCATATTG) and PhagR (GGCAAGCTTCT GAATATGTTGTTAAGGCACGTC). The PCR fragment was digested with EcoRI and HindIII, and cloned into pKM003, a cut with the same enzymes. The same PCR fragment was cloned into pKM008 to generate pHV101 (Phag-cfp). To construct pHV100 (amyE∷PsspB-yfp spc), a 240-bp DNA fragment containing the promoter sequence of sspB was amplified using the primers PsspBF (CCGGAATTCCAAACGAGATACATGAACT GATG) and PsspBR (GGCAAGCTTCTTTTTATTTAGTATG GTTGGG). The PCR fragment was digested with EcoRI and HindIII, and cloned into pKM003, digested with the same enzymes. To construct pCA100 (amyE∷PyqxM-yfp spc), a 482-bp DNA fragment containing the promoter sequence of the yqxM-sipW-tasA operon was amplified using the primers PyqxMF (TG GCGAATTCTCAGAGTTAAATGGTATTGCTTCACT) and PyqxMR (GCCTAAGCTTGTAAAACACTGTAACTTGATAT GACAA). The PCR fragment was digested with EcoRI and HindIII and cloned into pKM003, digested with the same enzymes. The same PCR fragment was cloned into pKM008 to generate pCA101 (PyqxM-cfp). For integration at the lacA locus, promoter fusions were cloned into the vector pDR183 (Doan et al. 2005). To construct strains with the amyE∷PspoIIG-gfp construct, cells were transduced with a SPP1 lysate from the donor RL2453.
Gene replacement mutations and plasmids were transferred to the 168 genetic background by transformation (Cutting and Vander Horn 1990). Transformants were selected with the appropriate antibiotics for a double crossover recombination at the amyE or the lacA locus (Guerout-Fleury et al. 1996; Hartl et al. 2001). Promoter fusions were then transferred to NCIB 3610 by SPP1-mediated generalized transduction (Yasbin and Young 1974).
Thin sectioning
A sample of biofilms and agar was harvested from MSgg plates and transferred to a Tissue-Tek Cryomold biopsy disposable vinyl specimen mold (#4565), overlaid with Tissue-Tek O.C.T Compound (#4583), and fast-frozen in a dry-ice/ethanol bath. The frozen samples were stored at −80°C. Frozen samples were sliced into 8-μm-thick sections using an IEC Minot custom microtome set to −20°C equipped with a Lipshaw blade (3536). Thin sections were placed on VWR Superfrost Plus (#48311-703) electrostatically charged slides, air-dried, and fixed in 4% paraformaldehyde in PBS (pH 7.4) for 15 min prior to adding aqueous mounting medium (0.5% N-propyl gallate [Sigma], 50% glycerol, PBS at pH 7.4) and covering with a no. 1.5 coverslip. Fixed thin sections were stored at −80°C prior to imaging.
Image analysis
Whole colonies (Figs. 1B, 7B) were photographed at low magnification (0.8×) using a Stemi SV6 stereomicroscope (Zeiss) equipped with a 1.0× Achromat S objective lens, an AxioCam charge-coupled device (CCD) video camera system (Zeiss), and a computer interface. Data were captured using Axiovision suite software (Zeiss). Aerial structures along the peripheral edges of the colonies were photographed at higher magnification (5×) using the same equipment.
Fluorescence images were obtained using a Nikon TE-2000U inverted microscope equipped with a 20× Plan Apo objective (Figs. 3, 4, 6A–C) or 60× Plan Apo oil objective (Fig. 5) with DIC and fluorescence optics. Fluorescence images were collected using a CFP/YFP dual-band filter set (Chroma #52017). Images were acquired digitally using a cooled, CCD camera (Hamamatsu Corp.) and were analyzed with Metamorph 6.1 (Molecular Devices). All images were taken at the same exposure time, processed identically for compared image sets, and prepared for presentation using Photoshop 7.0 (Adobe Systems, Inc.).
Wild-type biofilms containing no fluorescent fusions were analyzed in each experiment to determine the background fluorescence for both CFP and YFP. The expression patterns of each promoter were assessed in cells containing single reporters with each promoter fused to cfp or yfp to control for possible variation introduced by the different reporter molecules. Additionally, the expression of each fusion was assessed when inserted at the amyE or lacA locus to control for potential variation of expression due to differences in chromosome structure at the different regions.
For time-lapse images, 2 μL of a cell suspension were pipetted onto MSgg diluted 1:100 in water fortified with 1.5% agar and allowed to dry prior to inverting onto the coverslip of a glass-bottom culture dish (Mat Tek #P35G-1.5-14-C) and sealing with parafilm. The 1:100 diluted MSgg was used in order to initiate sporulation while cells were still in a monolayer. Images were taken automatically using Metamorph 6.1 (Molecular Devices). Transmitted light, CFP, and YFP images were acquired every 30 min for up to 24 h.
Flow cytometry
Biofilms were scraped from the surface of the agar plate and resuspended in 500 μL of PBS buffer. Biofilms were then immediately disrupted by repetitive passes through a 23g1 needle and fixed in 4% paraformaldehyde for 7 min. After fixation, cells were washed with PBS, resuspended in GTE buffer (50 mM Glucose, 10 mM EDTA at pH 8, 20 mM Tris-HCl at pH 8), and stored at 4°C. Prior to flow cytometric analysis, cells were subjected to mild sonication in conditions that disrupt the cells from the extracellular matrix, but that do not lyse cells at detectable levels (Branda et al. 2006). This procedure gave a preparation of single cells, as confirmed by light microscopy.
For flow cytometric analysis, cells were diluted in PBS and directly measured on a BD LSR II flow cytometer (BD Biosciences) operating a solid-state laser at 488 nm. For each sample, at least 30,000 events were analyzed. Data containing the fluorescent signals were collected by a 505LP and a 530/30-bp filter, and the photomultiplier voltage was set between 300 and 500 V. Data were captured using FACS Diva software (BD Biosciences) and further analyzed using FlowJo 8.5.2 software (http://www.flowjo.com). Figures were prepared for publication using FlowJo 8.5.2 and Adobe Illustrator CS2 12.0.1.
Spore quantification
Cells were divided into two groups: The first group (liquid) was grown in MSgg liquid medium with agitation, and the second group (biofilm) was grown on MSgg medium fortified with 1.5% agar. Samples of cells were taken after 72 h and subjected to mild sonication conditions to obtain single cells as described for flow cytometry preparation. The optical density of each preparation was normalized to OD600 of 1 after sonication. To kill vegetative cells, the normalized preparations were incubated for 20 min at 80°C. To determine viable cell counts, serial dilutions were plated from the normalized preparation before and after the 80°C incubation.
For cocultured biofilms of matrix-deficient (tasA or eps) mutants with the sigF sporulation-deficient mutant, starting cultures were adjusted to an OD600 of 1 and mixed at a 1:1 ratio prior to spotting 2 μL on MSgg medium fortified with 1.5% agar. Sporulation was assayed as described for individual strains.
Acknowledgments
We thank Yunrong Chai, Frances Chu, Ashlee Earl, and Daniel Lopez for helpful discussions. We also thank members of the Kolter laboratory as well as John Kirby for discussions and critical review of this manuscript. We are grateful to David Rudner for the gift of pKM003 and pKM008 vectors. This work was supported by NIH grant GM58213 to R.K. and GM18568 to R.L.
Footnotes
Supplemental material is available at http://www.genesdev.org.
Article is online at http://www.genesdev.org/cgi/doi/10.1101/gad.1645008.
References
- An D., Parsek M.R. The promise and peril of transcriptional profiling in biofilm communities. Curr. Opin. Microbiol. 2007;10:292–296. doi: 10.1016/j.mib.2007.05.011. [DOI] [PubMed] [Google Scholar]
- Branda S.S., Gonzalez-Pastor J.E., Ben-Yehuda S., Losick R., Kolter R. Fruiting body formation by Bacillus subtilis. Proc. Natl. Acad. Sci. 2001;98:11621–11626. doi: 10.1073/pnas.191384198. [DOI] [PMC free article] [PubMed] [Google Scholar]
- Branda S.S., Chu F., Kearns D.B., Losick R., Kolter R. A major protein component of the Bacillus subtilis biofilm matrix. Mol. Microbiol. 2006;59:1229–1238. doi: 10.1111/j.1365-2958.2005.05020.x. [DOI] [PubMed] [Google Scholar]
- Burbulys D., Trach K.A., Hoch J.A. Initiation of sporulation in B. subtilis is controlled by a multicomponent phosphorelay. Cell. 1991;64:545–552. doi: 10.1016/0092-8674(91)90238-t. [DOI] [PubMed] [Google Scholar]
- Chai Y., Chu F., Kolter R., Losick R. Bistability and biofilm formation in Bacillus subtilis. Mol. Microbiol. 2007;67:254–263. doi: 10.1111/j.1365-2958.2007.06040.x. [DOI] [PMC free article] [PubMed] [Google Scholar]
- Chater K.F. Regulation of sporulation in Streptomyces coelicolor A3(2): A checkpoint multiplex? Curr. Opin. Microbiol. 2001;4:667–673. doi: 10.1016/s1369-5274(01)00267-3. [DOI] [PubMed] [Google Scholar]
- Chu F., Kearns D.B., Branda S.S., Kolter R., Losick R. Targets of the master regulator of biofilm formation in Bacillus subtilis. Mol. Microbiol. 2006;59:1216–1228. doi: 10.1111/j.1365-2958.2005.05019.x. [DOI] [PubMed] [Google Scholar]
- Chung J.D., Stephanopoulos G., Ireton K., Grossman A.D. Gene expression in single cells of Bacillus subtilis: Evidence that a threshold mechanism controls the initiation of sporulation. J. Bacteriol. 1994;176:1977–1984. doi: 10.1128/jb.176.7.1977-1984.1994. [DOI] [PMC free article] [PubMed] [Google Scholar]
- Cutting S.M., Vander Horn P.B. Genetic analysis. In: Harwood C.R., Cutting S.M., editors. Molecular biological methods for Bacillus. John Wiley & Sons; Chichester, UK: 1990. pp. 27–74. [Google Scholar]
- Doan T., Marquis K.A., Rudner D.Z. Subcellular localization of a sporulation membrane protein is achieved through a network of interactions along and across the septum. Mol. Microbiol. 2005;55:1767–1781. doi: 10.1111/j.1365-2958.2005.04501.x. [DOI] [PubMed] [Google Scholar]
- Dubnau D., Losick R. Bistability in bacteria. Mol. Microbiol. 2006;61:564–572. doi: 10.1111/j.1365-2958.2006.05249.x. [DOI] [PubMed] [Google Scholar]
- Fujita M., Losick R. Evidence that entry into sporulation in Bacillus subtilis is governed by a gradual increase in the level and activity of the master regulator Spo0A. Genes & Dev. 2005;19:2236–2244. doi: 10.1101/gad.1335705. [DOI] [PMC free article] [PubMed] [Google Scholar]
- Fujita M., Gonzalez-Pastor J.E., Losick R. High- and low-threshold genes in the Spo0A regulon of Bacillus subtilis. J. Bacteriol. 2005;187:1357–1368. doi: 10.1128/JB.187.4.1357-1368.2005. [DOI] [PMC free article] [PubMed] [Google Scholar]
- Gonzalez-Pastor J.E., Hobbs E.C., Losick R. Cannibalism by sporulating bacteria. Science. 2003;301:510–513. doi: 10.1126/science.1086462. [DOI] [PubMed] [Google Scholar]
- Guerout-Fleury A.M., Frandsen N., Stragier P. Plasmids for ectopic integration in Bacillus subtilis. Gene. 1996;180:57–61. doi: 10.1016/s0378-1119(96)00404-0. [DOI] [PubMed] [Google Scholar]
- Hartl B., Wehrl W., Wiegert T., Homuth G., Schumann W. Development of a new integration site within the Bacillus subtilis chromosome and construction of compatible expression cassettes. J. Bacteriol. 2001;183:2696–2699. doi: 10.1128/JB.183.8.2696-2699.2001. [DOI] [PMC free article] [PubMed] [Google Scholar]
- Kearns D.B., Chu F., Branda S.S., Kolter R., Losick R. A master regulator for biofilm formation by Bacillus subtilis. Mol. Microbiol. 2005;55:739–749. doi: 10.1111/j.1365-2958.2004.04440.x. [DOI] [PubMed] [Google Scholar]
- Kolter R., Greenberg E.P. Microbial sciences: The superficial life of microbes. Nature. 2006;441:300–302. doi: 10.1038/441300a. [DOI] [PubMed] [Google Scholar]
- Kues U. Life history and developmental processes in the basidiomycete Coprinus cinereus. Microbiol. Mol. Biol. Rev. 2000;64:316–353. doi: 10.1128/mmbr.64.2.316-353.2000. [DOI] [PMC free article] [PubMed] [Google Scholar]
- Lazazzera B.A. Lessons from DNA microarray analysis: The gene expression profile of biofilms. Curr. Opin. Microbiol. 2005;8:222–227. doi: 10.1016/j.mib.2005.02.015. [DOI] [PubMed] [Google Scholar]
- Mirel D.B., Chamberlin M.J. The Bacillus subtilis flagellin gene (hag) is transcribed by the σ 28 form of RNA polymerase. J. Bacteriol. 1989;171:3095–3101. doi: 10.1128/jb.171.6.3095-3101.1989. [DOI] [PMC free article] [PubMed] [Google Scholar]
- O’Toole G., Kaplan H.B., Kolter R. Biofilm formation as microbial development. Annu. Rev. Microbiol. 2000;54:49–79. doi: 10.1146/annurev.micro.54.1.49. [DOI] [PubMed] [Google Scholar]
- Rani S.A., Pitts B., Beyenal H., Veluchamy R.A., Lewandowski Z., Davison W.M., Buckingham-Meyer K., Stewart P.S. Spatial patterns of DNA replication, protein synthesis, and oxygen concentration within bacterial biofilms reveal diverse physiological states. J. Bacteriol. 2007;189:4223–4233. doi: 10.1128/JB.00107-07. [DOI] [PMC free article] [PubMed] [Google Scholar]
- Raser J.M., O’Shea E.K. Noise in gene expression: Origins, consequences, and control. Science. 2005;309:2010–2013. doi: 10.1126/science.1105891. [DOI] [PMC free article] [PubMed] [Google Scholar]
- Setlow P. Small, acid-soluble spore proteins of Bacillus species: Structure, synthesis, genetics, function, and degradation. Annu. Rev. Microbiol. 1988;42:319–338. doi: 10.1146/annurev.mi.42.100188.001535. [DOI] [PubMed] [Google Scholar]
- Shafikhani S.H., Mandic-Mulec I., Strauch M.A., Smith I., Leighton T. Postexponential regulation of sin operon expression in Bacillus subtilis. J. Bacteriol. 2002;184:564–571. doi: 10.1128/JB.184.2.564-571.2002. [DOI] [PMC free article] [PubMed] [Google Scholar]
- Smits W.K., Kuipers O.P., Veening J.W. Phenotypic variation in bacteria: The role of feedback regulation. Nat. Rev. Microbiol. 2006;4:259–271. doi: 10.1038/nrmicro1381. [DOI] [PubMed] [Google Scholar]
- Sogaard-Andersen L., Overgaard M., Lobedanz S., Ellehauge E., Jelsbak L., Rasmussen A.A. Coupling gene expression and multicellular morphogenesis during fruiting body formation in Myxococcus xanthus. Mol. Microbiol. 2003;48:1–8. doi: 10.1046/j.1365-2958.2003.03399.x. [DOI] [PubMed] [Google Scholar]
- Stephenson K., Hoch J.A. Evolution of signalling in the sporulation phosphorelay. Mol. Microbiol. 2002;46:297–304. doi: 10.1046/j.1365-2958.2002.03186.x. [DOI] [PubMed] [Google Scholar]
- Stoodley P., Sauer K., Davies D.G., Costerton J.W. Biofilms as complex differentiated communities. Annu. Rev. Microbiol. 2002;56:187–209. doi: 10.1146/annurev.micro.56.012302.160705. [DOI] [PubMed] [Google Scholar]
- Stover A.G., Driks A. Secretion, localization, and antibacterial activity of TasA, a Bacillus subtilis spore-associated protein. J. Bacteriol. 1999;181:1664–1672. doi: 10.1128/jb.181.5.1664-1672.1999. [DOI] [PMC free article] [PubMed] [Google Scholar]
- Veening J.W., Kuipers O.P., Brul S., Hellingwerf K.J., Kort R. Effects of phosphorelay perturbations on architecture, sporulation, and spore resistance in biofilms of Bacillus subtilis. J. Bacteriol. 2006a;188:3099–3109. doi: 10.1128/JB.188.8.3099-3109.2006. [DOI] [PMC free article] [PubMed] [Google Scholar]
- Veening J.W., Smits W.K., Hamoen L.W., Kuipers O.P. Single cell analysis of gene expression patterns of competence development and initiation of sporulation in Bacillus subtilis grown on chemically defined media. J. Appl. Microbiol. 2006b;101:531–541. doi: 10.1111/j.1365-2672.2006.02911.x. [DOI] [PubMed] [Google Scholar]
- Watnick P., Kolter R. Biofilm, city of microbes. J. Bacteriol. 2000;182:2675–2679. doi: 10.1128/jb.182.10.2675-2679.2000. [DOI] [PMC free article] [PubMed] [Google Scholar]
- Werner E., Roe F., Bugnicourt A., Franklin M.J., Heydorn A., Molin S., Pitts B., Stewart P.S. Stratified growth in Pseudomonas aeruginosa biofilms. Appl. Environ. Microbiol. 2004;70:6188–6196. doi: 10.1128/AEM.70.10.6188-6196.2004. [DOI] [PMC free article] [PubMed] [Google Scholar]
- Yasbin R.E., Young F.E. Transduction in Bacillus subtilis by bacteriophage SPP1. J. Virol. 1974;14:1343–1348. doi: 10.1128/jvi.14.6.1343-1348.1974. [DOI] [PMC free article] [PubMed] [Google Scholar]


