

Abstract
We describe and validate a hybrid image- and blood-sampling (HIBS) method to derive the input function for quantification of microPET mice data. The HIBS algorithm derives the peak of the input function from the image, which is corrected for recovery, while the tail is derived from 5-6 optimally placed blood sampling points. A Bezier interpolation algorithm is used to link the rightmost image peak data point to the leftmost blood sampling point. To assess the performance of HIBS, 4 mice underwent 60-minute microPET imaging sessions following a 0.40-0.50mCi bolus administration of 18FDG. In total, twenty-one blood samples (bsPTAC) were obtained throughout the imaging session to compare against the proposed HIBS method. MicroPET images were reconstructed using filtered back projection (FBP) with a zoom of 2.75 on the heart. Volumetric regions of interest (VROI) were composed by drawing circular ROIs 3-pixels in diameter on 3-4 transverse planes of the left ventricle. Performance was characterized by kinetic simulations in terms of bias in parameter estimates when bsPTAC and HIBS are used as input functions. The peak of the bsPTAC curve was distorted in comparison to the HIBS-derived curve due to temporal limitations and delay in blood sampling which affected the rates of bidirectional exchange between plasma and tissue. The results highlight limitations in using bsPTAC. The HIBS method, however, yields consistent results and thus is a substitute for bsPTAC.
Keywords: Blood input function, small animal PET imaging, Image quantification
Introduction
Small animal PET imaging is an invaluable tool in drug discovery, staging of disease, and monitoring the efficacy of novel therapeutic regimens. In a typical small animal PET imaging session, a radiopharmaceutical is administered and the kinetics of its distribution is characterized. The kinetics of the radiopharmaceutical account for receptor-ligand interactions and provide measures of receptor density [1], blood flow rates [2], metabolism rates [3], and other applications depending on the radiopharmaceutical’s mode of action. To accurately depict its kinetics, however, an input function which is essentially the plasma time-activity curve (PTAC) of the radiopharmaceutical serves as a forcing function to model the kinetics of the radiopharmaceutical in tissue. Ideally, the PTAC should be extracted non-invasively to minimize animal handling and blood volume loss. As important, a non-invasive approach would circumvent errors associated with rapid blood sampling of the early component of the PTAC (i.e., the peak). In recent years, several minimally invasive techniques have been proposed which involve statistical separations of physiological signals. The techniques fall broadly into two categories: apex-seeking approaches and least-squares optimization. The apex-seeking approaches with non-negativity constraints have been successfully applied to human PET images [4-6], primates [7], and microPET rat data [8, 9]. The least-squares approaches have successfully been applied to human cardiac PET data [10-12]. Their application to mice data, however, was met with limited success.
Non-invasive techniques in mice imaging are hampered by the small dimension of the mouse heart, partial volume effects (PVE), as well as cardiac and respiratory motion during the microPET session all of which affect convergence of non-invasive algorithms. We propose a simple technique that utilizes blood-sampling as well as image data. Many microPET study protocols require blood samples throughout the imaging session for subsequent metabolite and/or substrate analysis [13]. The number of blood samples ranges between 5-7 sampling points. For example, in our facility we draw blood samples at 1min, 2min, 5min, 10min, 15min, 20min post-injection for metabolite and substrate analysis in microPET cardiac glucose, acetate, and palmitate (GAP) metabolism studies [3, 9, 13]. Ideally, any information available about the temporal profile of the radiopharmaceutical in blood should be used to reconstruct the input function. In this publication, we propose a hybrid image- and blood-sampling (HIBS) algorithm whereby the peak of the PTAC is derived from the image while the tail of the PTAC is concatenated from blood samples using a Bezier linker. We assess the validity of method using mice microPET data and simulations.
Materials & Methods
microPET Imaging
Four mice were anesthetized by inhalation though an induction chamber followed by a 60-minute microPET (Focus-120 and Focus-220, Knoxville, TN) imaging session. The imaging session was initiated 5sec following a 0.40-0.50mCi bolus administration of 18FDG, as previously described [13]. In total, twenty-one blood samples were obtained throughout the imaging session to compare against the proposed HIBS method. MicroPET images were reconstructed using Filtered Back Projection (FBP) with a zoom of 2.75 on the heart. In total, 40 frames were generated with frame durations of 1×3sec, 6×2sec, 9×5sec, 6×10sec, 4×30sec, 2×1min, 2×2min, and 10×5min. Volumetric regions of interest (VROI) were composed by drawing circular ROIs with a 3-pixel diameter on 3-4 transverse planes of the left ventricle.
Hybrid Image- and Blood-Sampling (HIBS)
The HIBS method derives the peak of the input function from the image while the tail is derived from blood sampling. The peak of the image was corrected for recovery using a partial volume correction of rLV = 0.7 based on simulations and phantom data [14]. The number of frames that define the peak is user adjustable. In this work, we used the first 8-12 frames (corresponding to time 0-0.62min post injection) of the image. Six blood samples from time point 1min to 60min (sampling points at 1min, 2min, 5min, 10min, 40min, and 60min, post injection) were used to define the tail of the input function. To link the rightmost image peak data point to the leftmost blood sampling point (i.e., 1min) we evaluated various linkers. We found that a Bezier interpolation is optimal for linking the rightmost image data to the leftmost blood sample. Bezier interpolations [15] uses Bernstein basis of the form [(1-t)3,3t(1-t)2,3t2(1-t),t3] in lieu of the monomial basis [1,t,t2,t3]. We use a Bernstein basis of order n=3 such that
| (1) |
where B3,i (t) is the ith Bernstein polynomial with spatial control points p0 ,…, p3 . Horner’s rule [16] is applied for efficient computation of the polynomial. In formulating the HIBS algorithm, the rightmost peak data point corresponds to control point p0 and the leftmost blood sampling point corresponds to control point p3. Control points p2 and p3 are determined by calculating the intersection of a linear polynomial through the peak and extrapolation of the blood samples (Figure 1). A MATLAB code for Bezier interpolation is available through the MATLAB Central File Exchange. The HIBS algorithm is formulated as follows:
Assign control points p0 and p3
Compute and assign control points p2 and p3 as described above (see Figure 1)
- Let
- Compute
where x = 1…tn denotes a uniform spacing of time points between control point p0 and p3 (we use n=100).
Figure 1.
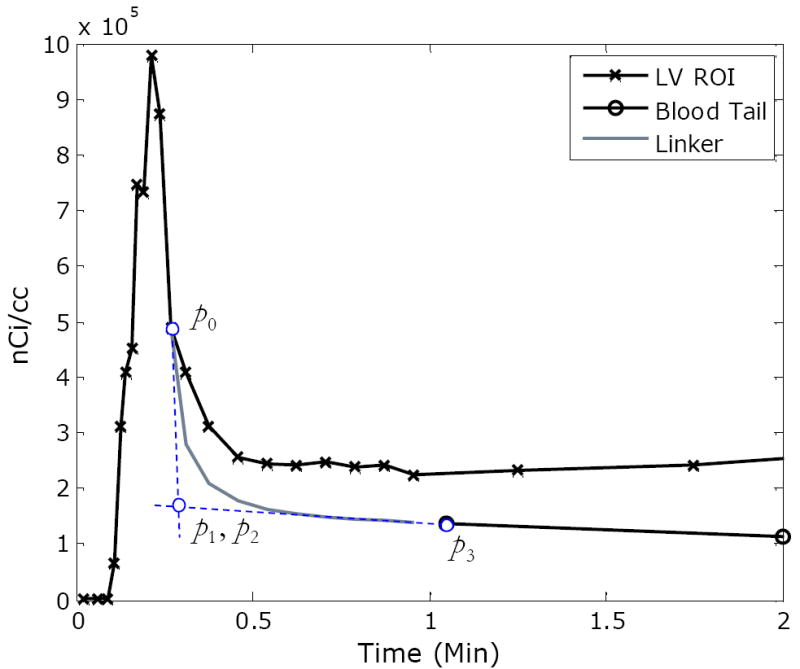
An illustration of the hybrid image- and blood-sampling (HIBS) method with a Bezier linker. Bezier control points are indicated by p0, p1, p2, and p3. Control point p0 corresponds to the rightmost image peak data point; p3 corresponds to and the leftmost blood sampling point; and control points p2 and p3 are determined by calculating the intersection of a linear polynomial through the peak and extrapolation of the blood samples as illustrated by the dashed (blue) lines. The resulting linker is depicted in gray. Note that the image peak data is corrected for recovery prior to the application of HIBS.
Validation of HIBS
Typically, non-invasive (or minimally invasive) input function algorithms are validated by comparing the area under the curves (AUC) of the blood-samples PTAC (bsPTAC) and the one derived by the proposed algorithm [6, 7, 12]. These results can be misleading since two curves could have similar AUCs but different shapes. We chose a more stringent approach in validating the HIBS method. In particular, we characterized differences between the bsPTAC and HIBS-derived PTAC by simulating tissue curves of 18FDG metabolism with predefined kinetic rate-constants using PTAC as input function. Tissue time-activity curve (TACs) were simulated based on the FDG kinetic model where K1 (mL/g/min) and k2 (/min) denote the forward and reverse rate-constants of bidirectional exchange between blood and tissue while k3 (/min) and k4 (/min) denote rate of phosphrylation and dephosphorylation of FDG in tissue, respectively. Subsequently, the simulated tissue curves were fit to retrieve the kinetic rate-constants using both PTAC and the HIBS-generated curve as the input functions. Ideally, if there are no significant differences (p>0.05) between the HIBS fitted rate-constants and the PTAC fitted rate-constant, it suggests that the HIBS-derived input function would produce similar kinetic parameters as when bsPTAC is used as an input function, therefore validating the algorithm. The validation scheme is as follows:
Simulate 18FDG tissue time-activity curve using bsPTAC as input function with predefined kinetic parameters. The kinetic values used in the simulation correspond to (K1, k2, k3, k4)=(0.2, 0.15, 0.1, 0.01).
Add pseudo-Poisson noise proportional to the activity at time ti and inversely proportional to the frame duration. The noise level matched the correlation of variation (CV) of a microPET image (last frame).
Fit each curve generated in step 2 for the kinetic parameters using bsPTAC as input function. And, similarly, fit the curve for kinetic parameters using HIBS as an input function. The optimization produces two sets of rate-constants which are recorded.
Iterate steps (1)-(3) 100 times and record the set of fitted parameters at each iteration.
Subsequently, calculate mean and standard deviations for each set of vector kinetic estimates. Average percent bias from simulated values is calculated as
| (2) |
where θ = (K1, k2, k3, k4) and θ^ is a vector of estimated kinetic values.
Results
Typical outputs of reconstructed PTAC using the HIBS method are depicted in Figure 2. Panels A-D correspond to validation experiments tabulated in Table 1. In particular, panels A1 and B1 depict the LV ROI curve, the tail of the blood sampling starting at 1min, and the Bezier linker (gray); whereas, in panels A2 and B2, the HIBS-derived PTAC is compared against the blood sampled PTAC (bsPTAC). In panels C and D we display the first minute of blood sampling and image acquisition. In all cases, where available the in-sets provide the full temporal profile of the PTAC. As evident, in particular from panels A2 and B2, the bsPTAC and the HIBS PTAC are in agreement beyond 1min, as expected. The peak of the bsPTAC is dispersed and underestimated compared to the HIBS PTAC on panels A2, B2, C and, D. In addition, there are disparities in the timing and underestimation of the peak. These discrepancies are clearly evident in the insert logarithm plot and in panels C and D.
Figure 2.

A representative example of reconstructed PTAC with HIBS. Letter labels in each panel correspond to mouse labels in Table 1. The LV ROI, blood samples and Bezier linker are indicated in the Figures A1 and B1 (note that the term “blood tail” refers to blood samples beyond 1-minute). For ease of visualization, the first 10-minutes are shown with an inset for the 60-minute (in log-scale) of imaging session in panel A2 and B2. Note that time points beyond 1-minute would match blood samples. In panels C and D we display the first minute of blood sampling and image acquisition for mice C and D.
Table 1.
Validation Studies
| Blood Sampling as Input
|
HIBS as Input
|
||||||||
|---|---|---|---|---|---|---|---|---|---|
| K1 | k2 | k3 | k4 | K1 | k2 | k3 | k4 | ||
| Mouse A | Mean | 0.1966 | 0.1438 | 0.098 | 0.0101 | 0.2847* | 0.2516* | 0.1078 | 0.0095 |
| SD | 0.007 | 0.0153 | 0.0093 | 0.0015 | 0.0107 | 0.0229 | 0.0081 | 0.0011 | |
| %Bias | 1.7221 | 4.3234 | 1.9946 | -0.7732 | -29.7394 | -40.3905 | -7.1979 | 5.7766 | |
| Mouse B | Mean | 0.1954 | 0.1401 | 0.0954 | 0.0097 | 0.1999 | 0.1482 | 0.0985 | 0.0099 |
| SD | 0.0073 | 0.0165 | 0.01 | 0.0016 | 0.0074 | 0.0169 | 0.01 | 0.0015 | |
| %Bias | 2.378 | 7.0407 | 4.8525 | 2.9384 | 0.0686 | 1.218 | 1.5665 | 1.2255 | |
| Mouse C | Mean | 0.1934 | 0.1355 | 0.0919 | 0.009 | 0.3102* | 0.3231* | 0.1214 | 0.009 |
| SD | 0.0073 | 0.0174 | 0.0117 | 0.0019 | 0.0176 | 0.042 | 0.0108 | 0.0011 | |
| %Bias | 3.3936 | 10.7366 | 8.7905 | 10.5021 | -35.5307 | -53.571 | -17.6378 | 11.2732 | |
| Mouse D | Mean | 0.1952 | 0.14 | 0.0951 | 0.0096 | 0.2655* | 0.2344* | 0.1063 | 0.009 |
| SD | 0.0089 | 0.0192 | 0.0117 | 0.002 | 0.0117 | 0.0249 | 0.0093 | 0.0014 | |
| %Bias | 2.4733 | 7.1671 | 5.1915 | 4.1745 | -24.6649 | -35.9983 | -5.9704 | 11.4349 | |
Denotes that the value is significantly (p<0.05) different from corresponding parameter when blood sampling is used as an input function.
In Table 1, we tabulate results of the kinetic simulations to assess HIBS as a substitute for PTAC. Mean and standard deviation (SD) of kinetic estimates for 100 simulations are provided as well as the percent bias between the average estimate and the true parameter value. The dataset label (i.e., Mouse A, etc) corresponds to the panel label (i.e, panel A) in Figure 2. In three out of the four datasets, the kinetic parameters of bidirectional transfer (K1 and k2) are significantly different (p<0.05) from those estimated when bsPTAC is used as input function. Kinetic parameters corresponding to k3 and k4, however, are not significantly (p>0.05) different.
Discussion
Ideally, one would be interested in reconstructing the input function solely based on image data. However, due to the small size of mice; low spatial resolution of microPET; and rapid heart and respiratory motion, at this stage it is challenging to extract the input function purely based on image data. In this publication, we proposed a simple algorithm that derives the peak of the input function from the image while blood sampling is used to reconstruct the tail of PTAC (Figure 1-2). To validate HIBS as a substitute for blood sampling, we performed kinetic simulations to assess differences in kinetic values (Table 1). Typically, image-derived input functions are validated by comparing areas under the curve (AUC) of the image-derived PTAC and the blood-sampled PTAC (bsPTAC) [6, 7, 12]. However, such validation schemes are misleading since two curves may have similar AUC, but different shapes which would affect quantification. Thus, our validation approach is more stringent, but it highlights several issues in quantification of small animal imaging data.
A close inspection of the blood sampled PTAC (bsPTAC) and the image-derived PTAC reveals distorted and underestimation of the bsPTAC peak (Figure 2). Blood samples are obtained by cannulating a venous line with a catheter of a certain length. A venous blood sample has two shortcomings: first, it represents a delayed sample due to circulation time in comparison to a sample derived from the LV, which represents arterial blood; and second, it represents a post-extraction value which may explain underestimation of the peak. Moreover, blood sampling during the peak needs to be extremely rapid. To extract accurate blood samples, the blood in the catheter needs to be repeatedly cleared, or void, to allow for blood representing the next sampling point. The process is extremely delicate and somewhat subjective, depending on the experience of the technician. These observations explain differences at the peak observed in Figure 2. In fact, the underestimation and distortions of the peak in blood sampling are well documented as one of the shortcomings of blood sampling for characterization of input function [7, 8] and it is attributed to subjective limitations in temporal sampling. It is interesting to note that despite these shortcomings, blood sampling is considered the “gold standard”.
Any distortions and underestimation of the peak would affect kinetic parameters of bidirectional transfer between blood and tissue, namely K1 and k2. As noted in Table 1, in three out of the four datasets, K1 and k2 estimates of HIBS are significantly (p<0.05) different from estimates obtained when bsPTAC was used as the input function. These observations are not surprising in consideration of above arguments and are evident in Figure 2. Meyer et al. [17] have recently characterized the effects of underestimation of input peak on kinetic parameter estimates in 82Rb studies. The authors demonstrate that a 10% underestimation of the peak results in 15-30% bias in K1 estimates and increases the relative standard deviation of K1 estimates independent of noise level, which is consistent with observations. The HIBS algorithm, on the other hand, yields a consistent estimation of a linker between the blood samples and the peak of the input function derived from the image. One source of bias in estimating the peak of the input function from the image is attributed to recovery of the LV and spillover from myocardium. While we did correct for recovery of the LV blood pool based estimates from simulations and phantom studies [14], we assume the spillover from the myocardium is negligible due to minimal uptake at early frames. We note that in cases where there is no significant uptake in the myocardium in late frames (unlike 18FDG), an imaging-only method for measurement of the PTAC may be sufficient, although further validation is needed.
In conclusion, the HIBS algorithm derives the peak of the input function from the LV while the tail is derived from blood sampling. While, truly non-invasive techniques are highly desirable, in many cases 5-7 blood samples are available for metabolite analysis, and therefore, they could be used in reconstructing the input function. By reducing the number of sampling to define the peak of the blood curve, the HIBS algorithm allows for longitudinal and repeated imaging with minimal blood loss to characterize receptor density and metabolism in both rat and mice microPET imaging.
Acknowledgments
This project is partly supported by funding from the NIH/NHLBI grant 5-PO1-HL-13851, Washington University Small Animal Imaging Resource (WUSAIR) R24-CA83060, and the Siteman Cancer Center support grant P30CA091842.
Footnotes
Publisher's Disclaimer: This is a PDF file of an unedited manuscript that has been accepted for publication. As a service to our customers we are providing this early version of the manuscript. The manuscript will undergo copyediting, typesetting, and review of the resulting proof before it is published in its final citable form. Please note that during the production process errors may be discovered which could affect the content, and all legal disclaimers that apply to the journal pertain.
References
- 1.Farde L, Eriksson L, Blomquist G, Halldin C. Kinetic analysis of central [11C]raclopride binding to D2-dopamine receptors studied by PET--a comparison to the equilibrium analysis. J Cereb Blood Flow Metab. 1989;9(5):696–708. doi: 10.1038/jcbfm.1989.98. [DOI] [PubMed] [Google Scholar]
- 2.Herrero P, Kim J, Sharp TL, Engelbach JA, Lewis JS, Gropler RJ, et al. Assessment of myocardial blood flow using 15O-water and 1-11C-acetate in rats with small-animal PET. J Nucl Med. 2006;47(3):477–85. [PubMed] [Google Scholar]
- 3.Welch MJ, Lewis JS, Kim J, Sharp TL, Dence CS, Gropler RJ, et al. Assessment of myocardial metabolism in diabetic rats using small-animal PET: a feasibility study. J Nucl Med. 2006;47(4):689–97. [PubMed] [Google Scholar]
- 4.Barber DC. The use of principal components in the quantitative analysis of gamma camera dynamic studies. Phys Med Biol. 1980;25(2):283–92. doi: 10.1088/0031-9155/25/2/008. [DOI] [PubMed] [Google Scholar]
- 5.Di Paola R, Bazin JP, Aubry F, Aurengo A, Cavailloles F, Herry JY, et al. Handling of dynamic sequences in nuclear medicine. IEEE Transactions on Nuclear Science. 1982;NS-29:1310–1321. [Google Scholar]
- 6.Wu HM, Hoh CK, Choi Y, Schelbert HR, Hawkins RA, Phelps ME, et al. Factor analysis for extraction of blood time-activity curves in dynamic FDG-PET studies. J Nucl Med. 1995;36(9):1714–22. [PubMed] [Google Scholar]
- 7.Wu HM, Huang SC, Allada V, Wolfenden PJ, Schelbert HR, Phelps ME, et al. Derivation of input function from FDG-PET studies in small hearts. J Nucl Med. 1996;37(10):1717–22. [PubMed] [Google Scholar]
- 8.Kim J, Herrero P, Sharp T, Laforest R, Rowland DJ, Tai YC, et al. Minimally invasive method of determining blood input function from PET images in rodents. J Nucl Med. 2006;47(2):330–6. [PubMed] [Google Scholar]
- 9.Laforest R, Sharp TL, Engelbach JA, Fettig NM, Herrero P, Kim J, et al. Measurement of input functions in rodents: challenges and solutions. Nucl Med Biol. 2005;32(7):679–85. doi: 10.1016/j.nucmedbio.2005.06.012. [DOI] [PubMed] [Google Scholar]
- 10.El Fakhri G, Sitek A, Guerin B, Kijewski MF, Di Carli MF, Moore SC. Quantitative dynamic cardiac 82Rb PET using generalized factor and compartment analyses. J Nucl Med. 2005;46(8):1264–71. [PubMed] [Google Scholar]
- 11.Sitek A, Di Bella EV, Gullberg GT. Factor analysis with a priori knowledge--application in dynamic cardiac SPECT. Phys Med Biol. 2000;45(9):2619–38. doi: 10.1088/0031-9155/45/9/314. [DOI] [PubMed] [Google Scholar]
- 12.Sitek A, Gullberg GT, Huesman RH. Correction for ambiguous solutions in factor analysis using a penalized least squares objective. IEEE Trans Med Imaging. 2002;21(3):216–25. doi: 10.1109/42.996340. [DOI] [PubMed] [Google Scholar]
- 13.Sharp TL, Dence CS, Engelbach JA, Herrero P, Gropler RJ, Welch MJ. Techniques necessary for multiple tracer quantitative small-animal imaging studies. Nucl Med Biol. 2005;32(8):875–84. doi: 10.1016/j.nucmedbio.2005.05.010. [DOI] [PubMed] [Google Scholar]
- 14.Shoghi KI, Rowland DJ, Laforest R, Welch MJ. Characterization of Spillover and Recovery Coefficients in the Gated Mouse Heart for Non-Invasive Extraction of Input Function in microPET Studies: Feasibility and Sensitivity Analysis. IEEE Nuclear Science Symposium. 2006;4:2134–2136. [Google Scholar]
- 15.Salomon D. Curves and Surfaces for Computer Graphics. New York: Springer Verlag; 2005. [Google Scholar]
- 16.Pathan A, Collyer T. The wonder of Horner’s method. Mathematical Gazette. 2003;87(509):230–242. [Google Scholar]
- 17.Meyer C, Weibrecht M, Peligrad D-N. Variation of Kinetic Model Parameters Due to Input Peak Distortions and Noise in Simulated 82Rb PET Perfusion Studies. IEEE Nuclear Science Symposium. 2006;5:2703–2707. [Google Scholar]