Abstract
Mapping by admixture linkage disequilibrium (MALD) is an economical and powerful approach for the identification of genomic regions harboring disease susceptibility genes in recently admixed populations. We develop an information-theory-based measure, called expected mutual information (EMI), which computes the impact of a set of markers on the ability to infer ancestry at each chromosomal location. We then present a simple and effective algorithm for the selection of panels that strives to maximize the EMI score. Finally, we demonstrate via well-established simulation tools that our panels provide more power and accuracy for inferring disease gene loci via the MALD method in comparison to previous methods.
Mapping by admixture linkage disequilibrium (MALD) is an economical and powerful approach for the identification of genomic regions harboring disease-susceptibility genes in recently admixed populations (Reich and Patterson 2005; Smith and O’Brien 2005). For the method to be useful, the prevalence of the disease under study should be considerably different between the ancestral populations from which the admixed population was formed.
Myeloma, for example, is a type of cancer that is approximately three times more prevalent in Africans than in Europeans (Smith and O’Brien 2005). Hepatitis C clearance is approximately five times more prevalent in Europeans than in Africans. Stroke, lung cancer, prostate cancer, dementia, end-stage renal disease, multiple sclerosis, hypertension, and many more diseases all exhibit a higher morbidity in either Africans or Europeans, when the two ethnically different populations are compared (Smith and O’Brien 2005). This difference in susceptibility to a specific disease is also evident in other ethnic populations. Native Americans suffer from a high prevalence of type 2 diabetes, obesity, and gallbladder disease, while showing a lower prevalence of asthma, relative to Europeans (Price et al. 2007).
When examining an individual who originated from several ancestral populations, such as African Americans, the likelihood that this individual will carry a given disease is influenced by the susceptibility to the disease in the ancestral populations. When such an admixed individual carries a hereditary disease, the chances are higher that the disease gene or genes are harbored in chromosomal segments that originated from the ancestral population with the higher risk.
The MALD method, also known as admixture mapping, screens through the genome of either affected or both affected and healthy admixed individuals, looking for chromosomal segments with an unusually high representation of the high-risk ancestral population for the disease. MALD requires 200–500-fold fewer markers, in comparison to genome-wide association mapping, while offering the same power (Reich and Patterson 2005). Consequently, the method has an economical advantage over alternative methods. Lately, successful results from admixture mapping have begun to emerge. For example, the usage of MALD led to the discovery of multiple risk alleles (gene variants) for prostate cancer (Haiman et al. 2007).
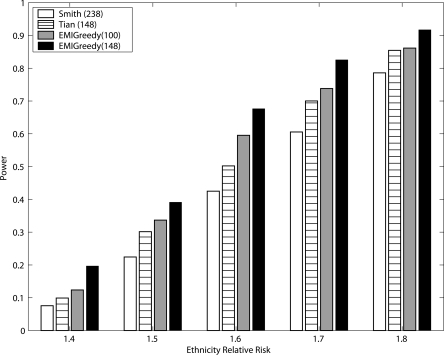
In this study, we develop an information-theory-based measure, called expected mutual information (EMI), to select an effective panel of markers to be used in MALD. Our measure, presented below, computes the total impact of a set of markers on the ability to infer ancestry at each chromosomal location, averaged over all possible recombinations that could have occurred during the admixture process. This method improves previous measures such as the Shannon information content (SIC) (Rosenberg et al. 2003) and Fisher information content (FIC) (Pfaff et al. 2004). We then present a simple and effective algorithm for the selection of panels that strives to maximize the EMI score. Next, we demonstrate via well-established simulation tools used in previous studies that our panels provide more power for inferring disease gene loci. For example, when examining 576 cases from an admixed population comparative to the African-American population, our simulations show that in the challenging case of a disease with an ethnicity risk ratio of 1.6 between the two ancestral populations, assuming a multiplicative risk disease model, the power increased from 50% to 68%, namely, an increase of ∼36% in the ability to detect the loci of disease-susceptibility genes. The detection accuracy has also significantly improved with the use of our new panels. The increase in power is particularly important in the detection of weak signals that underlie complex diseases. We conclude with extensions and discussion.
Background
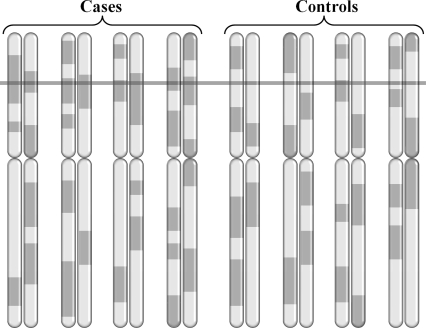
The MALD method consists of three steps. First, an admixed population with a significantly higher risk for a specific disease in one of the ancestral populations is identified. Ancestry-informative markers that effectively distinguish between the relevant ancestral populations are selected, and either case or both cases and controls are genotyped. Second, the ancestry along the chromosomes of every individual is computed based on the sampled genotypes. Third, chromosomal regions with an elevated frequency of the ancestral population with the higher disease prevalence are identified. Figure 1 illustrates the ancestral profile of eight individuals, of which half are cases and half controls. The ancestral profiles are indicated as dark and light segments along the chromosomes. The excess of the higher-risk ancestral population in the cases at the locus marked by the bar suggests that the locus contains the disease-susceptibility gene. In the controls, the ancestry at the same locus matches the expected distribution of ancestry under a given admixture model, strengthening the hypothesis that an association was found with a genuine disease locus. The detection of suspected regions can be followed by methods such as high-density SNP-based association studies, or a study of nearby candidate genomic regions.
Figure 1.
Ancestry informative markers are used to compute the ancestry across the chromosomes of cases and controls. The region indicated by the bar shows elevated frequency of the higher risk ancestral population in the cases versus the expected distribution of ancestry in the controls, suggesting a disease susceptibility locus.
Choosing ancestry-informative markers (AIM) for the construction of MALD panels has been pursued in several studies. AIM panels were constructed for African-American (Smith et al. 2004; Tian et al. 2006), Mexican-American (Tian et al. 2007), and Hispanic/Latino (Mao et al. 2007; Price et al. 2007) populations. The construction of such panels requires three ingredients: a database of markers, a measure for the informativeness of a set of markers regarding ancestry, and an algorithm that selects informative markers for the MALD panel.
The work of Rosenberg et al. (2003)) introduced a measurement for the information multialleleic markers provided on ancestry, based on the SIC. Pfaff et al. (2004) based their measurement on the FIC.
The algorithms used for panel construction in the studies that followed were driven by two prime objectives: (1) Choose markers with the highest ancestry-informativeness. (2) Choose evenly spread markers. These guidelines were set to provide informative panels for the estimation of ancestry at each point along the genome. Current panel construction algorithms are “greedy,” attempting to locally maximize an informativeness criterion, while investing less effort in ensuring that the chosen markers are evenly spaced or that the informativeness along the genome is well balanced. Smith et al. (2004) used a purely greedy algorithm for marker selection. Tian et al. (2006) divided the chromosome into windows, choosing multiple highly informative markers within every such window.
When considering the informativeness of a set of markers regarding the ancestry at an arbitrary point, previous work offered rough approximations. Smith et al. (2004) considered the informativeness of a set of markers within a constant-size window centered on the point examined as an approximation to the informativeness at that point. Tian et al. (2006) used the mean informativeness between two adjacent markers bounding the point examined. It is this deficiency that is addressed in this study. In the next section, we develop an improved measure and demonstrate through simulations that panels constructed using our measure provide increased power in the detection of disease-susceptibility gene loci.
Admixed individuals model
The genome of a recently admixed individual is a mosaic of large chromosomal segments, where each segment originated from a single ancestral population. We use the following definitions to describe these segments in admixed individuals.
Definition 1. An admixed chromosome is a chromosome that originated from more than one ancestral population.
Definition 2. A post-admixture recombination point (PAR) is a recombination point in which either two chromosomes from different populations crossed, or two chromosomes crossed when at least one of the chromosomes is an admixed chromosome.
Definition 3. A PAR block is a chromosomal segment limited by two consecutive PAR points, or by a chromosome edge and its closest PAR point.
An immediate implication of these definitions is that every PAR block originated from a single ancestral population, designated as the “ancestry of the block,” for otherwise the block would have been further divided.
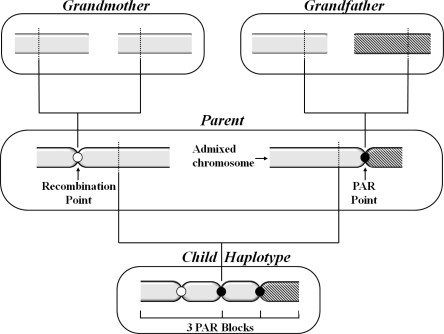
Figure 2 illustrates the propagation of PAR points along three generations of admixture, and the PAR blocks they induce. In particular, Figure 2 shows a grandmother originating from one population and a grandfather originating from two populations, yielding a parent with one admixed chromosome (with one PAR point) and one nonadmixed chromosome. As the parent’s chromosomes recombine to produce the child’s admixed chromosome, a second PAR point is added. Hence, three recombination points reside on the child’s chromosome, of which only two are PAR points (colored black). Three PAR blocks are defined rather than four as the leftmost recombination point is not a PAR point.
Figure 2.
Three generations admixture example. PAR blocks are limited only by PAR points and the chromosomes’ ends.
We denote the set of all observed markers by J, and the vector of an individual’s PAR-blocks ancestries as Q. The set of an individual’s PAR points defines a partition (denoted π) of the chromosomes into blocks. We use the random variable Qπ to denote the vector of ancestries corresponding to the PAR blocks determined by π, Qπ,i to denote the ancestry (out of K possible ancestral populations) of the ith PAR block in the given partition π, and the random vector Jπ,i = {Jπ,i,1, Jπ,i,2, . . . , Jπ,i,mi} to denote the set of mπ,i observed markers within this block. Reference to subscript π will be omitted whenever π is clear from the context.
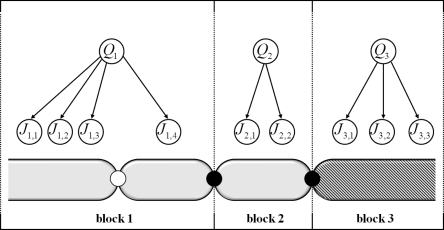
Markers within a PAR block are assigned according to the probability function of the corresponding ancestral population. We further assume that the ancestries of all PAR blocks of a given partition π are mutually independent. A graphical model showing these assumptions is given in Figure 3.
Figure 3.
Graphical model for P(Q, J) assuming markers Ji within a PAR block are independent conditioned on ancestry Qi. Ancestries of PAR blocks are assumed to be mutually independent.
The joint probability distribution described via the graphical model is given by
 |
In particular, when considering a specific point x on the genome, the joint probability for the ancestry Qx at that point is given by
where Jπ,x are the markers within the same PAR block as location x, and Jπ,x is the complementary set of markers outside this block. We use this joint distribution to derive our panel informativeness measure.
Informativeness of panels
In this section, we develop a measure for the contribution of a set of observed markers to the ability to infer the ancestry of a block conditioned on a partition π. We then extend this measure to account for the fact that π is unknown by computing the expectation over all possible partitions, while focusing on the inference of a single location x.
We start by exploring the relationship between observed markers and the ancestries of PAR blocks under the assumption that the partition is known. Using information theory, we estimate the extent to which a set of markers contribute to the ability to infer ancestry by measuring the informativeness of a set of markers regarding ancestry. The information gain for ancestry due to observing a set of markers can be described by the well-known SIC:
 |
where H(Qi) is the entropy (or the amount of uncertainty) of the PAR block’s ancestry, given by
 |
and H(Qi|Ji) is the conditional entropy on ancestry once the markers observations are accounted for, given by
In other words, the markers’ informativeness is measured by the reduction in uncertainty regarding the ancestry of a given location due to observing these markers. This reduction in uncertainty originates from the fact that each ancestral population has a distinct distribution over the haplotype. The information gain in each PAR block is computed separately through Equation 3 due to our assumption of mutual independence.
The possible presence of linkage disequilibrium between markers within a block raises difficulties partially stemming from the need to estimate the joint probability of a haplotype Ji that contains multiple markers conditioned on the ancestry [i.e., P(Ji|Qi)]. To reduce computational cost, we assume conditional independence between all markers given ancestry, yielding a simpler form of mutual information Iind(Qi; Ji), explicated in Lemma 1. The relaxation of this assumption is pursued in Section 7.
Lemma 1. For a given PAR block, let Qi be its ancestry, and Ji,j be its jth marker (out of mi markers). Under the assumption that the markers are conditionally independent given Qi, the mutual information between Qi and Ji is:
 |
Given a partition π, all PAR blocks are determined, and the informativeness of markers regarding ancestry Qi, and in particular regarding ancestry Qx of an arbitrary location x within the ith PAR block, is the informativeness of the markers in Ji alone. All other markers, namely, J\Ji, are not informative regarding Qx. However, π is not known, and for every π a different block may contain location x, determining the set of markers that are informative regarding the ancestry at x. The expected informativeness of all markers regarding ancestry at location x is given, in principle, by
We call this measure “EMI” for “expected mutual information.” Since summing over all possible partitions is not feasible, the rest of this section rewrites Equation 5 and explicates how to compute it.
Observe that for any two partitions π1 and π2 such that the PAR block that contains location x also contains the same set of markers Jπ,x ⊆ J, the term I(Qx; J|π) in Equation 5 is equal. The probability for a partition π to contain a block that contains both location x and markers Jπ,x is defined by three events:
The minimal segment [l, r] that spans over Jπ,x and x does not contain a PAR point.
The segment between l and the marker to its left (at l′), if such exists, contains a PAR point.
The segment between r and the marker to its right (at r′), if such exists, contains a PAR point.
Assuming that PAR points are distributed independently, the aforementioned three events are independent as well. This holds because the corresponding three segments are mutually exclusive. Hence, the probability of a partition π to contain a PAR block containing location x and markers Jπ,x alone is given by the product
where N[a,b] is a random variable of the number of PAR points in segment [a,b], and [l,r] is the minimal segment containing location x and markers Jπ,x.
The term P(N[l′,l] ≠ 0) depends on the existence of a marker at l′, hence, the term will equal 1 in Equation 6 in case there is no marker to the left of l. Similarly, P(N[r,r′] ≠ 0) will equal 1 in Equation 6 if there is no marker to the right of r.
Let J[l,r] denote a sequence of markers within a segment [l,r], and location(j) denote the location of a marker j ∈ J. To compute EMI, we weight the potential contribution I(Qx; J[l,r]) by the probability of such a contribution, namely, the probability P(l,r) of a partition π to contain location x and markers J[l,r] within the same block.
Theorem 1. Let Qx be the ancestry at location x, and J the set of observed markers. The expected mutual information between Qx and J is
where
 |
A common assumption is that recombination points occur as a Poisson process (Patterson et al. 2004), hence, the realization of the term P(l,r) in Equation 7 is via the Poisson distribution. In particular,
where λ is the rate of PAR points in admixed individuals, as derived from the admixture model being used. Consequently,
Equation 7 defines the EMI at a specific location x. The average information gain regarding the entire chromosome is given by
 |
which measures the average EMI along the chromosome. The set N consists of all locations x on an evenly spaced grid with a specific resolution. For example, for chromosome 1, a set N of 280 points means about one location per centimorgan (cM).
In the task of mapping disease genes in admixed populations using the MALD method, panels of high EMIavg are shown below to outperform previous panels.
Panel construction
We employ a greedy algorithm that constructs panels of markers for which the EMIavg is high. In principle, the algorithm iterates over the candidate markers, selecting the marker with the highest EMIavg gain given the markers chosen so far. Namely, in each iteration, the algorithm chooses a marker j that maximizes
where J is the set of markers selected so far.
The evaluation of EMIavg is a computationally intensive task that is repeated with every iteration, and for every candidate marker. To reduce execution time, for each examined candidate, we locally evaluate EMIavg on a set of points located in a segment of length w centered on the candidate marker. Equation 11 evaluates the EMIavg on a subset of points wj ⊆ N:
 |
where
rather than on the entire chromosome. Once a marker j is chosen, the EMIavg gain in the next iteration is computed only for those markers that are within wj, as the last chosen marker mostly affects their potential gain.
The most computationally dominant factor in EMI is the evaluation of H(J) (Equation 4), as it is exponential in the number markers |J|. However, for a given PAR block, a small number of ancestry-informative markers suffice to nearly eliminate the uncertainty regarding its ancestry; the information gain regarding the ancestry of the PAR block saturates rapidly as the number of informative markers within the PAR block increases. Hence, limiting the number of markers used in the evaluation of Equation 4 yields an eligible approximation. In our implementation, we limited the number of markers in the evaluation of Equation 4 to a maximum of 17 markers, offering a plausible trade-off between performance and approximation accuracy.
Evaluation
In this section, we demonstrate the power of panels produced by our algorithm and EMI. We compare performance with the works of Smith et al. (2004) and Tian et al. (2006).
Similarly to the panels of Smith et al. (2004) and Tian et al. (2006), we constructed a panel for the African-American admixed population. The International HapMap Project (The International HapMap Project 2005) was used as the SNP allele frequencies source for the two ancestral populations, namely, the West African and European populations. HapMap has been shown to reflect these two distinct populations well (Conrad et al. 2006).
We constructed a panel of 148 markers (denoted EMI-148) for chromosome 1, matching the number of corresponding markers in the screening panel of Tian et al. (2006) The panel of Smith et al. (2004) contains 238 markers. We further constructed a more economical panel of 100 markers for chromosome 1 (denoted EMI-100), which is two-thirds the number of markers in the panel constructed by Tian et al. (2006). Based on the admixture dynamics of African Americans as described by Hoggart et al. (2004), Smith et al. (2004), and Smith and O’Brien (2005), we used λ = 6 (Equation 8) and a proportion of 0.8 African/0.2 European contribution to the admixed population. To compute EMIavg (Equation 11), N was defined as a set of evenly spaced locations along the chromosome at a resolution of 0.5 cM, yielding N = 574 for chromosome 1. We used a window size of w = 90 cM because the expected informativeness of a marker decays to ∼5% for any location beyond 45 cM.
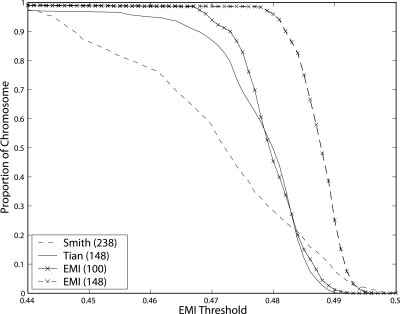
We first examine the performance of the four panels according to the EMI measure. The maximal EMI value is the entropy H(Q). In the case of African Americans, the maximal EMI value is ∼0.5 [namely, the entropy H(Q) with P(Q1) = 0.2 and P(Q2) = 0.8]. Figure 4 illustrates that the informativeness of EMI-148 is considerably higher than previous panels. Moreover, the EMI-148 panel constructed by our algorithm has a low EMI standard deviation of 0.0041 in comparison to the screening panel of Tian et al. (2006) (0.0142) and the panel of Smith et al. (2004), (0.0178); indeed, our EMI measure strives to balance the informativeness of markers across the chromosome. It is interesting to note that our lighter panel, EMI-100, has good performance as well, with a low EMI standard deviation of 0.0056.
Figure 4.
Proportion of chromosome above an EMI threshold. For most levels of informativeness, our panel covers larger segments of the chromosome.
ANCESTRYMAP (Patterson et al. 2004) is a tool we used for the estimation of the ancestral origin of a locus on the basis of sampled genotypes. Given genotypes of cases and controls, the tool can compute the likelihood of each point along the genome to be the disease locus. The disease model used by ANCESTRYMAP is a multiplicative risk model parametrized by the ethnicity relative risk (ERR) for the disease between the ancestral populations (Patterson et al. 2004); having one allele from the higher-risk population inflicts a disease risk of ERR, while having two such alleles inflicts an ERR2 disease risk. ANCESTRYMAP can also generate samples of admixed-individual genotypes for cases and controls under this multiplicative disease model. This software was used in Smith et al. (2004) and Tian et al. (2006) to evaluate the power of the Smith and Tian panels, respectively.
In the experiments conducted, we generated 576 (some panel technologies use a sample size that is a multiplicative of 96) admixed-individual cases per experiment through the use of ANCESTRYMAP. In each experiment, a single location on chromosome 1 was used as the disease-predisposition locus. In order to evaluate the performance of the panel across the entire chromosome, a set of disease-predisposition loci was chosen using a resolution of four points per centimorgan; Consequently, 687 uniformly selected locations across chromosome 1 were used in the experiments. A range of ethnicity relative risk (ERR) factors, between 1.4 and 1.8, were set as the disease model parameter, all assuming that the European population exhibits the higher risk for the disease. We focused on this range as it captures diseases such as stroke and lung cancer (Smith and O’Brien 2005), which are considered mild in their ERR, hence harder to detect. We proceeded by employing ANCESTRYMAP to locate the disease gene. Similar to the threshold used for the evaluation of Tian’s panel (Tian et al. 2006), we used a LOD score above 4.0 as an indicator for successful detection. Figure 5 shows the power, namely, the detection success rate, using 3435 experiments per panel.
Figure 5.
EMI-148 achieves a significantly higher power in all tested ERR values with 576 cases, assuming a multiplicative disease model.
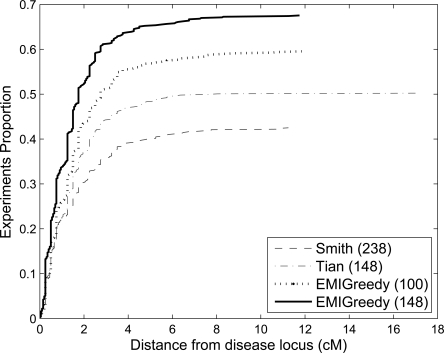
Measuring the distance between the highest detected signal and the actual disease predisposition locus reveals that our panel also has a higher detection accuracy, as Figure 6 illustrates for ERR 1.6.
Figure 6.
Experiments proportion up to an accuracy threshold for each of the four panels, under an ERR of 1.6 and 576 cases, assuming a multiplicative disease model. A higher proportion of the experiments yield higher accuracy for EMI-148, in comparison to the other three panels.
Similar results hold for other ERR values within the tested range 1.4–1.8. Averaged over the range of ERR values tested, ∼55% of the experiments detected a signal within a 3-cM distance from the actual disease predisposition locus when EMI-148 was used, while the other two panels achieved ∼42% (Tian et al. 2006) and 37% (Smith et al. 2004). The EMI-100 panel achieved an average of 46% detection rate within 3 cM over the range of ERR values tested.
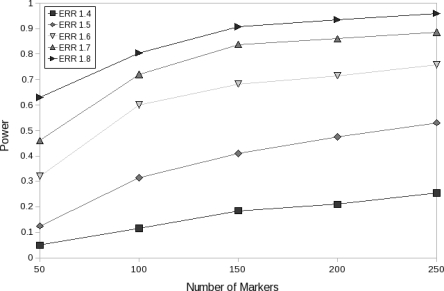
Observing the difference in performance between the EMI-100 panel and the EMI-148 panel raises the question of power saturation, namely, under a given admixed population and a disease model, how many markers will suffice to reach near maximal power. We constructed five panels for chromosome 1 for African Americans, with a different number of markers ranging from 50 to 250 in steps of 50, and examined their power over a range of ERR values and 576 cases (200 experiments per configuration) using the multiplicative disease model. As illustrated in Figure 7, for the case of an ERR of 1.7, the results indicate an increase in power from 46% (with 50 markers) to 84% (with 150 markers) and reaching ∼89% (250 markers). Further increase in power requires significantly more markers, especially for ERR ≥ 1.7.
Figure 7.
Power as a function of panel density, over a range of ERR values, using 576 cases and a multiplicative disease model.
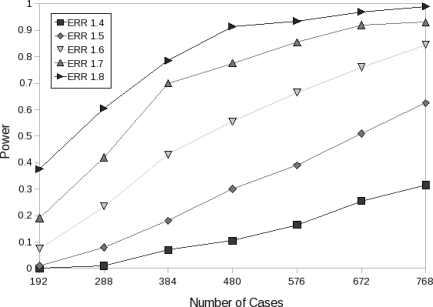
We further tested the effect of sample size on the power of our panels. Figure 8 illustrates the power of EMI-148 over a range of ERR values with 200 experiments per configuration.
Figure 8.
Power of EMI-148 as a function of the number of cases used for several ERR values assuming a multiplicative disease model.
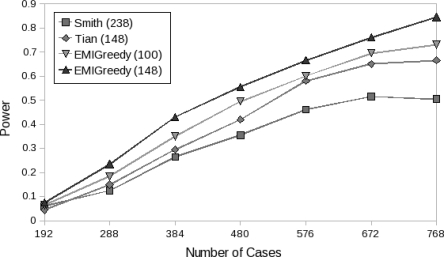
We compared the effect of sample size on power between the four panels using an ERR of 1.6. As illustrated in Figure 9, both EMI-148 and EMI-100 exhibit higher power under the different sample sizes tested, in comparison to the other two panels. More importantly, the results indicate that while the other two panels’ power converged when more than 700 samples are used, our panels continued to benefit from the additional increase in sample size.
Figure 9.
The power of the four panels as a function of the number of cases used for ERR 1.6 and a multiplicative disease model.
Detailed information regarding our panels is available at bioinfo.cs.technion.ac.il/MALD.
Extensions and Discussion
The EMI measure provides an estimate for the informativeness of a set of markers regarding ancestry at a specific location. It improves upon previous measures as it takes into account the expected informativeness of a set of markers with respect to ancestry, over all possible partitions. The higher accuracy of EMI, especially in regions between markers, enables the creation of panels that are well balanced in terms of the informativeness provided by the set of markers across the genome. Finally, the panels constructed by our algorithm demonstrated significantly higher power and accuracy.
An immediate extension of EMI that we pursued addresses possible dependencies between markers given ancestry. Lemma 1 disregards LD within ancestral population in favor of a lower computational cost. We now use a first-order Markov-chain to model marker dependencies within ancestral populations in order to provide a more accurate model. Under this model, the transition probabilities are derived from the LD present between every two adjacent markers given the ancestry. Such a model still yields a computationally plausible form, as shown in the next lemma.
Lemma 2. For a given PAR Block, let Qi be the ancestry, and Ji,j be the jth marker (out of mi markers). Under the assumption that each marker is dependent on the preceding marker and conditionally independent of the rest of the markers given Qi, the mutual information of Qi and Ji is:
 |
Another extension of EMI relaxes the assumption that the rate of PAR points, used in Equation 8, is constant across the chromosomes. Recombinational hotspots can be taken into account by using a PAR point rate as a function of location λ(x) instead of the constant rate λ. For example, assume that a chromosome is divided into regions of different PAR point rates λ1, λ2, . . . , λn. For a segment [l,r] that spans two consecutive regions with PAR rates λi and λi + 1, the term P(N[l,r]) in Equation 6 equals e−(λi⋅t+λi+1⋅(1−t))⋅|r−l|, where t is the proportion of segment [l,r] with PAR rate λi.
Differences in the rate and distribution of recombination points in the ancestral population affect our assumption that the ancestries of PAR blocks are mutually independent. Studying such differences and their extent, as was done in Conrad et al. (2006), will enable us to extend our measure accordingly.
We note that EMI assumes a model for haplotypes rather than genotypes, and that the allele frequencies P(J|Q) are definite. In reality, these frequencies are derived from a small set of samples (60, barring missing data, in the case of HapMap). In its current form, EMI lacks an appropriate treatment for the uncertainty involving allele frequencies. It is advisable to validate the allele frequencies by taking more samples for candidate markers, as done in Tian et al. (2006).
The approach presented in this paper for panel construction also applies to the second phase of the MALD method. This phase currently employs a Markov chain model that assigns the most probable ancestry for each location, given the model and marker data (Hoggart et al. 2004; Patterson et al. 2004). By conditioning on possible partitions π, one can compute the expected ancestry P(Qx|J = j) at a point x given measurements J = j via Equation 2, similarly to our computation of the expected informativeness. It would be interesting to see whether this approach yields higher accuracy in ancestry inference.
In summary, we showed that the panels produced using EMI have a well-balanced high score in terms of informativeness of markers, yielding a significant improvement in both power and accuracy, compared to previous work.
Acknowledgments
We thank Walter Wasser and Guennady Yudkovsky for fruitful discussions, Mark Silberstein for support, Tamar Aizikowitz for her helpful comments, and the reviewers for thoughtful comments. We also thank the Wolfson Foundation for contributing a grid of 120 PCs that enabled us to conduct this research. This research is supported by a Microsoft TCI grant.
Footnotes
Article published online before print. Article and publication date are at http://www.genome.org/cgi/doi/10.1101/gr.073148.107.
References
- Conrad D.F., Jakobsson M., Coop G., Wen X., Wall J.D., Rosenberg N.A., Pritchard J.K., Jakobsson M., Coop G., Wen X., Wall J.D., Rosenberg N.A., Pritchard J.K., Coop G., Wen X., Wall J.D., Rosenberg N.A., Pritchard J.K., Wen X., Wall J.D., Rosenberg N.A., Pritchard J.K., Wall J.D., Rosenberg N.A., Pritchard J.K., Rosenberg N.A., Pritchard J.K., Pritchard J.K. A worldwide survey of haplotype variation and linkage disequilibrium in the human genome. Nat. Genet. 2006;38:1251–1260. doi: 10.1038/ng1911. [DOI] [PubMed] [Google Scholar]
- Haiman C.A., Patterson N., Freedman M.L., Myers S.R., Pike M.C., Waliszewska A., Neubauer J., Tandon A., Schirmer C., McDonald G.J., Patterson N., Freedman M.L., Myers S.R., Pike M.C., Waliszewska A., Neubauer J., Tandon A., Schirmer C., McDonald G.J., Freedman M.L., Myers S.R., Pike M.C., Waliszewska A., Neubauer J., Tandon A., Schirmer C., McDonald G.J., Myers S.R., Pike M.C., Waliszewska A., Neubauer J., Tandon A., Schirmer C., McDonald G.J., Pike M.C., Waliszewska A., Neubauer J., Tandon A., Schirmer C., McDonald G.J., Waliszewska A., Neubauer J., Tandon A., Schirmer C., McDonald G.J., Neubauer J., Tandon A., Schirmer C., McDonald G.J., Tandon A., Schirmer C., McDonald G.J., Schirmer C., McDonald G.J., McDonald G.J., et al. Multiple regions within 8q24 independently affect risk for prostate cancer. Nat. Genet. 2007;39:638–644. doi: 10.1038/ng2015. [DOI] [PMC free article] [PubMed] [Google Scholar]
- Hoggart C.J., Shriver M.D., Kittles R.A., Clayton D.G., McKeigue P.M., Shriver M.D., Kittles R.A., Clayton D.G., McKeigue P.M., Kittles R.A., Clayton D.G., McKeigue P.M., Clayton D.G., McKeigue P.M., McKeigue P.M. Design and analysis of admixture mapping studies. Am. J. Hum. Genet. 2004;74:965–978. doi: 10.1086/420855. [DOI] [PMC free article] [PubMed] [Google Scholar]
- The International HapMap Project A haplotype map of the human genome. Nature. 2005;437:1299–1319. doi: 10.1038/nature04226. [DOI] [PMC free article] [PubMed] [Google Scholar]
- Mao X., Bigham A., Mei R., Gutierrez G., Weiss K., Brutsaert T., Leon-Velarde F., Moore L., Vargas E., McKeigue P., Bigham A., Mei R., Gutierrez G., Weiss K., Brutsaert T., Leon-Velarde F., Moore L., Vargas E., McKeigue P., Mei R., Gutierrez G., Weiss K., Brutsaert T., Leon-Velarde F., Moore L., Vargas E., McKeigue P., Gutierrez G., Weiss K., Brutsaert T., Leon-Velarde F., Moore L., Vargas E., McKeigue P., Weiss K., Brutsaert T., Leon-Velarde F., Moore L., Vargas E., McKeigue P., Brutsaert T., Leon-Velarde F., Moore L., Vargas E., McKeigue P., Leon-Velarde F., Moore L., Vargas E., McKeigue P., Moore L., Vargas E., McKeigue P., Vargas E., McKeigue P., McKeigue P., et al. A genome-wide admixture mapping panel for Hispanic/Latino populations. Am. J. Hum. Genet. 2007;80:1171–1178. doi: 10.1086/518564. [DOI] [PMC free article] [PubMed] [Google Scholar]
- Patterson N., Hattangadi N., Lane B., Lohmueller K.E., Hafler D.A., Oksenberg J.R., Hauser S.L., Smith M.W., O’Brien S.J., Altshuler D., Hattangadi N., Lane B., Lohmueller K.E., Hafler D.A., Oksenberg J.R., Hauser S.L., Smith M.W., O’Brien S.J., Altshuler D., Lane B., Lohmueller K.E., Hafler D.A., Oksenberg J.R., Hauser S.L., Smith M.W., O’Brien S.J., Altshuler D., Lohmueller K.E., Hafler D.A., Oksenberg J.R., Hauser S.L., Smith M.W., O’Brien S.J., Altshuler D., Hafler D.A., Oksenberg J.R., Hauser S.L., Smith M.W., O’Brien S.J., Altshuler D., Oksenberg J.R., Hauser S.L., Smith M.W., O’Brien S.J., Altshuler D., Hauser S.L., Smith M.W., O’Brien S.J., Altshuler D., Smith M.W., O’Brien S.J., Altshuler D., O’Brien S.J., Altshuler D., Altshuler D., et al. Methods for high-density admixture mapping of disease genes. Am. J. Hum. Genet. 2004;74:979–1000. doi: 10.1086/420871. [DOI] [PMC free article] [PubMed] [Google Scholar]
- Pfaff C.L., Barnholtz-Sloan J., Wagner J.K., Long J.C., Barnholtz-Sloan J., Wagner J.K., Long J.C., Wagner J.K., Long J.C., Long J.C. Information on ancestry from genetic markers. Genet. Epidemiol. 2004;26:305–315. doi: 10.1002/gepi.10319. [DOI] [PubMed] [Google Scholar]
- Price A.L., Patterson N., Yu F., Cox D.R., Waliszewska A., McDonald G.J., Tandon A., Schirmer C., Neubauer J., Bedoya G., Patterson N., Yu F., Cox D.R., Waliszewska A., McDonald G.J., Tandon A., Schirmer C., Neubauer J., Bedoya G., Yu F., Cox D.R., Waliszewska A., McDonald G.J., Tandon A., Schirmer C., Neubauer J., Bedoya G., Cox D.R., Waliszewska A., McDonald G.J., Tandon A., Schirmer C., Neubauer J., Bedoya G., Waliszewska A., McDonald G.J., Tandon A., Schirmer C., Neubauer J., Bedoya G., McDonald G.J., Tandon A., Schirmer C., Neubauer J., Bedoya G., Tandon A., Schirmer C., Neubauer J., Bedoya G., Schirmer C., Neubauer J., Bedoya G., Neubauer J., Bedoya G., Bedoya G., et al. A genomewide admixture map for Latino populations. Am. J. Hum. Genet. 2007;80:1024–1036. doi: 10.1086/518313. [DOI] [PMC free article] [PubMed] [Google Scholar]
- Reich D., Patterson N., Patterson N. Will admixture mapping work to find disease genes? Philos. Trans. R. Soc. Lond. B Biol. Sci. 2005;360:1605–1607. doi: 10.1098/rstb.2005.1691. [DOI] [PMC free article] [PubMed] [Google Scholar]
- Rosenberg N.A., Li L.M., Ward R., Pritchard J.K., Li L.M., Ward R., Pritchard J.K., Ward R., Pritchard J.K., Pritchard J.K. Informativeness of genetic markers for inference of ancestry. Am. J. Hum. Genet. 2003;73:1402–1422. doi: 10.1086/380416. [DOI] [PMC free article] [PubMed] [Google Scholar]
- Smith M.W., O’Brien S.J., O’Brien S.J. Mapping by admixture linkage disequilibrium: Advances, limitations and guidelines. Nat. Rev. Genet. 2005;6:623–632. doi: 10.1038/nrg1657. [DOI] [PubMed] [Google Scholar]
- Smith M.W., Patterson N., Lautenberger J.A., Truelove A.L., McDonald G.J., Waliszewska A., Kessing B.D., Malasky M.J., Scafe C., Le E., Patterson N., Lautenberger J.A., Truelove A.L., McDonald G.J., Waliszewska A., Kessing B.D., Malasky M.J., Scafe C., Le E., Lautenberger J.A., Truelove A.L., McDonald G.J., Waliszewska A., Kessing B.D., Malasky M.J., Scafe C., Le E., Truelove A.L., McDonald G.J., Waliszewska A., Kessing B.D., Malasky M.J., Scafe C., Le E., McDonald G.J., Waliszewska A., Kessing B.D., Malasky M.J., Scafe C., Le E., Waliszewska A., Kessing B.D., Malasky M.J., Scafe C., Le E., Kessing B.D., Malasky M.J., Scafe C., Le E., Malasky M.J., Scafe C., Le E., Scafe C., Le E., Le E., et al. A high-density admixture map for disease gene discovery in African Americans. Am. J. Hum. Genet. 2004;74:1001–1013. doi: 10.1086/420856. [DOI] [PMC free article] [PubMed] [Google Scholar]
- Tian C., Hinds D.A., Shigeta R., Kittles R., Ballinger D.G., Seldin M.F., Hinds D.A., Shigeta R., Kittles R., Ballinger D.G., Seldin M.F., Shigeta R., Kittles R., Ballinger D.G., Seldin M.F., Kittles R., Ballinger D.G., Seldin M.F., Ballinger D.G., Seldin M.F., Seldin M.F. A genomewide single-nucleotidepolymorphism panel with high ancestry information for African American admixture mapping. Am. J. Hum. Genet. 2006;79:640–649. doi: 10.1086/507954. [DOI] [PMC free article] [PubMed] [Google Scholar]
- Tian C., Hinds D.A., Shigeta R., Adler S.G., Lee A., Pahl M.V., Silva G., Belmont J.W., Hanson R.L., Knowler W.C., Hinds D.A., Shigeta R., Adler S.G., Lee A., Pahl M.V., Silva G., Belmont J.W., Hanson R.L., Knowler W.C., Shigeta R., Adler S.G., Lee A., Pahl M.V., Silva G., Belmont J.W., Hanson R.L., Knowler W.C., Adler S.G., Lee A., Pahl M.V., Silva G., Belmont J.W., Hanson R.L., Knowler W.C., Lee A., Pahl M.V., Silva G., Belmont J.W., Hanson R.L., Knowler W.C., Pahl M.V., Silva G., Belmont J.W., Hanson R.L., Knowler W.C., Silva G., Belmont J.W., Hanson R.L., Knowler W.C., Belmont J.W., Hanson R.L., Knowler W.C., Hanson R.L., Knowler W.C., Knowler W.C., et al. A genomewide single nucleotide polymorphism panel for Mexican American admixture mapping. Am. J. Hum. Genet. 2007;80:1014–1023. doi: 10.1086/513522. [DOI] [PMC free article] [PubMed] [Google Scholar]


