

Abstract
State of vigilance is determined by behavioral observations and electrophysiological activity. Here, we improve automatic state of vigilance discrimination by combining head acceleration with EEG measures. We incorporated biaxial DC-sensitive microelectromechanical system (MEMS) accelerometers into head-mounted preamplifiers in rodents. Epochs (15 s) of behavioral video and EEG data formed training sets for the following states: Slow Wave Sleep, Rapid Eye Movement Sleep, Quiet Wakefulness, Feeding or Grooming, and Exploration. Multivariate linear discriminant analysis of EEG features with and without accelerometer features was used to classify behavioral state. A broad selection of EEG feature sets based on recent literature on state discrimination in rodents was tested. In all cases, inclusion of head acceleration significantly improved the discriminative capability. Our approach offers a novel methodology for determining the behavioral context of EEG in real time, and has potential application in automatic sleep-wake staging and in neural prosthetic applications for movement disorders and epileptic seizures.
Keywords: State, EEG, REM, slow wave, vigilance, classification, MEMS, accelerometer
INTRODUCTION
There is a long history of determining the state of vigilance for humans (Broughton, 1999) or animals (Robert et al., 1999) using EEG criteria. Nevertheless, there is considerable uncertainty when determining the state of vigilance using EEG alone. Therefore, EEG is typically augmented with simultaneous visual behavioral monitoring, and/or the incorporation of electromyogram (EMG) or electrooculogram (EOG) recordings.
We are developing the technical capability for discriminating state of vigilance in real time. Our objective is to provide contextual input for seizure prediction and control. It is readily accepted that the dynamics of EEG change remarkably in the different stages of wakefulness and sleep (Niedermeyer, 1999). Yet much of the current work in seizure detection and prediction (Mormann, et al., 2005) focuses on statistical or dynamical changes of the EEG with respect to a baseline defined without regard to state. Our end goal is to implement state-dependent seizure detection and control in medical devices suitable for human implantation during the activities of daily living, where continuous video monitoring would not be feasible and EMG or EOG electrodes might be invasive or cumbersome.
In this study, we explored combining head acceleration measurements with EEG in order to improve our ability to discriminate state of vigilance in rodent experiments. We incorporated biaxial DC-sensitive microelectromechanical system (MEMS) accelerometers into the head-mounted preamplifier circuit used for EEG recording. We used combined EEG and behavioral video to establish training and validation data sets, and then used EEG features with and without accelerometer features in a multivariate linear classifier. We tested a broad range of EEG feature sets based on those used in the recent literature for state discrimination in rodents (Robert et al., 1999). Our approach offers a novel methodology for determining the behavioral context of EEG in real time. Preliminary results of this investigation were previously reported (Peixoto et al., 2004, Sunderam et al., 2005).
METHODS
Surgical Implantation and Data Acquisition
Video (3 fps including visual and infrared sensitivity), EEG and head acceleration were recorded continuously from adult male Sprague-Dawley rats 200–300 g in weight (Harlan Ltd., New York) using a custom-made electronics and acquisition system (Labview, National Instruments Ltd.).
Head-mounted preamplifiers were constructed with integrated DC-sensitive biaxial MEMS accelerometers (ADXL 311, Analog Devices Ltd.; sensitivity of 312 mV per g, where g = acceleration due to gravity, at the reference voltage of ±5 V, range ±2 g, configured for 0–100 Hz response, Fig. 1). The MEMS chip and requisite elements for signal transduction (two capacitors and one resistor), occupy a small fraction of surface area on the circuit board shown in Fig. 1. The remainder includes the EEG preamplifier and additional elements for simultaneous electrical stimulation and recording. The minimum additional surface area required to incorporate such an accelerometer into a final production headstage is approximately 0.3 cm2. The head-mounted preamplifier was mechanically and electrically attached to the animal’s head through a Plastics-One (Roanoke, VA) 363 series connector. EEG was available from two cortical surface electrode (0–80 stainless steel screw) pairs (Bregma-referenced stereotaxic coordinates from Paxinos and Watson, 2004: ML ±3.0 mm, AP +0.5 and −0.75 mm) and two depth electrodes (bipolar pairs, 125 μm stainless steel wires, ends staggered by 300 μm) placed bilaterally in the dorsal hippocampus (AP −2.5 mm, ML ± 2.0 mm, DV −2.75 mm). Head acceleration was measured along orthogonal axes in the sagittal plane of the animal’s head by the accelerometer (Fig. 2). The EEG and acceleration signals were sampled at 2 kHz and stored as 16-bit signed integers in contiguous, one-hour long files.
Fig. 1.
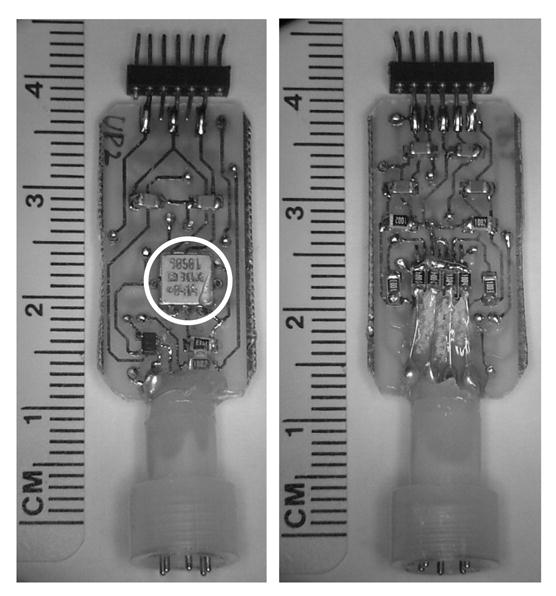
Front (left) and back (right) views of a head-mounted circuit for EEG preamplification with MEMS biaxial accelerometer (circled). Terminals at the bottom plug into a pedestal on the rat's head.
Fig. 2.

Schematic of accelerometer axis orientation with respect to animal’s head (upper) and Cartesian axes used to estimate angles of head tilt with respect to gravity (lower). Head acceleration variables A1 and A2 are measured along axes ê1 and ê2 in the plane of the MEMS chip surface which is in the sagittal plane of the rat’s head. The static components (f < 1 Hz) of A1 and A2 are due to gravity g⃑, which allows us to measure the angle Φ between the interaural axis ê3 and gravity, and the rotation angle Θ of the head about the interaural axis.
The animals were monitored for up to 7 days in a circular chamber (20 in. diameter) with free access to food and water. Artificial lighting followed a 12 hour on-off light-dark cycle, and was supplemented with infrared illumination at 940 nm from photodiode arrays, to allow for continuous video monitoring. We chose infrared illumination because rats are insensitive to light for wavelengths above 650 or 700 nm (see for example, Aggelopoulos and Meissl, 2000; or Jacobs et al., 2001), and video cameras sensitive to this wavelength are readily obtainable. All procedures were approved beforehand by the IACUC of George Mason University.
Visual Expert Scoring of State
An EEG expert (SLW) inspected video and EEG to label sequential, non-overlapping epochs of eleven hours of recording from two rats—identified as Rat I and Rat II—into the following Sleep-wake stages: 1. Slow Wave Sleep (SWS), 2. Rapid Eye Movement (REM) sleep, and 3. Awake. Awake motion was further classified according to visually observed motion to give a total of five Behavioral states: 1. SWS, 2. REM, 3. Quiet Wakefulness (QW), 4. Feeding or Grooming (FG), and 5. Exploration (EXP).
A fixed 15 s epoch duration was chosen to be consistent with existing literature on sleep and behavioral staging, in which the use of epochs of length up to 30 s has been reported (Robert et al., 1999). This length is a compromise between being long enough to properly discern a state and short enough to contain a predominantly single state.
Expert scoring was performed as follows: First, the video and EEG segment of each 15 s epoch was reviewed and scored as either Asleep, defined as immobile activity with oscillations <8 Hz in hippocampal EEG, or Awake. Awake states were then sub-classified to indicate the nature of motor activity. Sleep states were sub-classified as either SWS if there was moderate delta (1–4 Hz) oscillation in the cortex, or REM sleep if there was rhythmic theta oscillation (6–8 Hz) in hippocampal EEG. Motor and whisker activity were not used to distinguish sleep states. Epochs were classified as Indeterminate, if: 1) The animal was observed to be awake or asleep for less than 10 s, 2) Both EEG sleep patterns were seen during the epoch, or 3) Brief interruptions of a particular state occurred, including repositioning during sleep, as well as genuine transitions between different states. Indeterminate epochs (~10–20% of total, see Table I) were excluded from further analysis since they can be used neither for training nor validation of the classifier.
TABLE I.
Manually scored state statistics. Each 15 s epoch was assigned a Sleep-wake and an overall Behavioral state. SWS = Slow Wave Sleep, REM = Rapid Eye Movement sleep, FG = Feed/Groom, QW = Quiet Wake, EXP = Exploration, or Indeterminate if no particular state dominated the epoch.
| % of Total Epochs | |||||||
|---|---|---|---|---|---|---|---|
| Sleep-Wake State | |||||||
| SWS | REM | Awake | Indeterminate | Total | |||
| Rat I | 41.9 | 11.2 | 26.6 | 20.3 | 1188 | ||
| Rat II | 45.4 | 2.7 | 40.1 | 11.9 | 1426 | ||
| Behavioral State | |||||||
| SWS | REM | QW | EXP | FG | |||
| Rat I | 41.9 | 11.2 | 11.0 | 9.3 | 6.3 | 20.3 | 1188 |
| Rat II | 45.3 | 2.7 | 18.7 | 14.9 | 6.5 | 11.9 | 1426 |
Signal Processing and Data Analysis
Our objective was to compare the ability to discriminate state based on EEG plus head acceleration features with that based solely on EEG features. We used a classifier based on EEG that employs power in different frequency bands with different normalization methods as discrimination variables.
Data analysis was performed using Matlab (Mathworks Ltd.). Spectral power was computed for each of the four EEG and two acceleration channels for each 15 s epoch as follows: Non-overlapping 1 s windows were convolved with a Hamming window, the power spectrum computed, then averaged into 0.5 Hz wide bins. The results were then averaged over the 15 second epoch. The power was summed in different frequency ranges (see below) and used as input variables or features for the classification of epochs into the Sleep-wake and Behavioral states using multivariate linear discriminant analysis (LDA, Flury, 1997). The errors in classification were compared for different choices of EEG and acceleration features.
EEG features
Four representative choices of EEG spectral band limits and scaling used for sleep staging in the recent literature were employed as discrimination variables for detailed comparison as follows:
EEG1. Standard definition of EEG rhythms: Averaged total spectral power for each EEG channel measured in 4–8 Hz (θ), 8–13 Hz (α), 13–30 Hz (β) and 30–55 Hz (γ), each scaled by dividing by the power in the δ band (0.5–4 Hz).
EEG2. Spectral power ratios (0.5–4.5 Hz)/(0.5–9 Hz) and (0.5–20 Hz)/(0.5–55 Hz), based on Gervasoni et al. (2004). In the published method, the first principal component of each of these ratios over all EEG channels was used. Here we use the variables computed for all four channels. The choice not to use principal components in LDA is explained in the results section.
EEG3. Ratio of spectral power in δ (0.5–4 Hz) to θ (6–10 Hz) for each EEG channel, based on the work of Costa-Miserachs et al. (2003).
EEG4. Spectral power ratios (δ θ)/(β γ) and θ2/(δ α) of each EEG channel, where δ = 1.5–6 Hz, θ = 6–10 Hz, α = 10.5–15 Hz, β = 22–30 Hz and γ = 35–45 Hz, as published by Louis et al. (2004).
The transformation log(x) was applied to each power ratio variable to compress its dynamic range and make its probability distribution more symmetric. Algorithmically, we actually used the transformation log(x+ ε) to prevent numerical errors from taking the log of zero, where ε was chosen as 0.01 times the 2% smallest ranked non-zero value observed. The log transformation improved state discrimination for all four EEG variable sets and was therefore uniformly applied. Note that the variable sets use different frequency ranges to define the predominant brain rhythms δ, θ, α, β and γ. Many more possible variable sets are documented in the review by Robert et al. (1999), but a detailed comparison with and without accelerometer information is beyond the scope of this work. In some published cases, EMG or EOG was used as an additional feature (Louis et al., 2004). Finally, the published definitions of the states classified also varied to some extent but primarily represented SWS, REM and Awake.
Acceleration variables
The accelerometer was incorporated into the head-mounted preamplifier circuitry (Fig. 1). Its outputs were accelerations A1 and A2 in orthogonal directions ê1 and ê2 (hat denotes unit vector), where the e1e2 plane is the sagittal midplane of the rat’s head (Fig. 2). The coordinate direction ê3 is parallel to the interaural axis, which connects the ear canals. Both A1 and A2 have a roughly static component due to gravity in addition to a dynamic component due to motion and vibration. Features representative of different types of motion behavior were extracted from A1 and A2 for state discrimination as follows:
ACC0. No accelerometer data was used.
ACC1. Total power (1–55 Hz) for each accelerometer channel.
ACC2. Power within spectral band limits 1–5 Hz, 5–7 Hz, 7–10 Hz, 10–15 Hz, 15–20 Hz and 20–35 Hz for each accelerometer channel.
The log(x) transformation was applied to each acceleration power variable. The frequency bands used for ACC2 were based on signatures in acceleration power spectra associated with particular behaviors. Some specific examples, such as the signature associated with drinking, are discussed below.
The orientation of the rat’s head can also be extracted from the measurement of gravitational acceleration. The vector components of gravity g⃑ acting along the accelerometer plane are the static components of A1 and A2 (see Fig. 2). We extract the spherical angles Θ and Φ, which correspond respectively to a rotation angle about the interaural axis and the angle of the interaural axis with respect to gravity (lower panel, Fig. 2), by considering the components of gravity in the plane of the accelerometer, g⃑|| , and normal to it, g⃑⊥ , which are related by:
We then extract a1 and a2 from A1 and A2 by lowpass filtering at 1 Hz and normalizing by g. Examples of the evolution of Θ and Φ are presented in Fig. 3. Since Θ and Φ are not highly characteristic of behavior when averaged over a 15 s epoch, they were not used for state discrimination.
Fig. 3.

Dynamic (f > 1 Hz) head acceleration A1 and A2, head tilt angles Θ and Φ, and hippocampal (Hipp) and cortical (Cort) EEG for typical behaviors. (A) Drinking motion has a strong 6 Hz acceleration signature; (B) Grooming produces high amplitude 8–10 Hz bursts of acceleration, interrupted by head rotations; (C) REM sleep signatures include occasional brief twitching motions observed from the accelerometers and prolonged EEG theta oscillations (4–8 Hz) in both channels; and (D) Slow Wave Sleep has very little variation in dynamic acceleration or head tilt, but has delta rhythms (0.5–4 Hz) in both EEG channels.
Linear State Discrimination and Statistical Analysis
Fisher’s multivariate linear discriminant analysis (LDA; see Flury, 1997) was used to discriminate states for each combination of measured variables. A geometrical interpretation of Fisher’s methodology and its application to stage discrimination in the evolution of epileptic seizures from EEG were described by Schiff et al. (2005). In essence, linear combinations of the variables are formed that optimally separate clusters of training data points. The linear discriminant functions establish boundaries—hyperplanes in the feature space—between the clusters to classify samples into one of many groups.
We compared discriminability with and without head acceleration information based on three metrics of classification error: the leave-one-out error C0, the leave-half-out error C1, and the cross-validation error C2. The leave-one-out error is the average rate of misclassifying a sample point when it is excluded from the set of points used to construct the linear discriminant functions. The leave-half-out error C1 was computed by randomly selecting one-half of each set of scored points as a training set and then computing the classification error rate when applying the resulting classifier to the remaining half. Cross-validation error C2 estimates the rate of misclassifying a sample point when using a discriminant function computed from a training set from another animal. Algorithmically, we computed the classification error rate C2 when the same discriminant functions computed for estimating C1 for one animal were used to classify the full scored set from the other animal. C1 and C2 were computed by randomly selecting one half the total number of epochs from each animal as a training set. This procedure was repeated n = 100 times to estimate the error variability.
The statistical significance of each computed value of C0 was tested with a bootstrapping method. A likelihood estimate, Wilks’s lambda (Flury, 1997), was computed for the actual state allocation. Then a surrogate distribution of lambda was computed using 1000 random reassignments of state labels to the sample epochs. The significance (p value) of C0 was determined by the fraction of surrogates that have a lower value of lambda than the actual one.
Since C0 is expressed as the proportion of misclassified epochs when each is sequentially excluded from the training set, C0 values were compared in a pair-wise manner using a Z-test for difference in proportion. Error comparisons of C1 or C2 for the different combinations of EEG (EEG1–4) and ACC (ACC0–2) variable sets were made using two-way ANOVA. When p < 0.05, the Tukey-Kramer (multi-comparison significant differences) test was applied post hoc to determine which pair-wise differences – for instance, EEG3+ACC0 vs. EEG3+ACC2 – were significant.
This procedure (LDA with error rate analysis) was repeated for classification of both Sleep-wake state (3 possible states) and Behavioral state (5 possible states) for all 12 feature sets formed by the possible combinations of EEG (EEG1–4) and acceleration (ACC0–2) variable sets.
RESULTS
Manual Scoring Statistics
For each animal, the fraction of epochs in the training set manually scored as each individual state is recorded in Table I. Not counting Indeterminate epochs, the rats spent about 60% of the time in sleep, and over 80% of sleep in SWS. These values compare well with the literature (Gervasoni et al., 2004; Antle and Mistleberger, 2005) which indicates that this data set is representative of typical circadian behavior for rats.
Motion Signatures of States
The animal’s overall activity level was reflected in the total power in the dynamic acceleration (ACC1). The frequency content, duty cycle and evolution of the acceleration signals had characteristic signatures for particular behaviors, as illustrated in Fig. 3. The lapping of water from a tube had a strong 6 Hz rhythm, especially prominent in the dynamic acceleration A2 (Fig. 3A). Grooming behavior (Fig. 3B) was often accompanied by high energy bursts at ~10 Hz interrupted every few seconds by the rat tossing its head.
Head tosses were captured by changes in head tilt angles Θ and Φ. The quiet acceleration traces during REM sleep (Fig. 3C) are distinguished from that of SWS (Fig. 3D) by the observation of occasional brief twitches during REM and theta (6–8 Hz) rhythm in hippocampal EEG.
The temporal sequence of epoch by epoch classified state for a 60 min segment of training data (240 epochs) is shown in Fig. 4 in the form of a hypnogram accompanied by spectrograms of depth EEG and head acceleration. Note that complementary information is contained in the frequency spectra of the EEG and acceleration signals. For example, theta oscillations during REM and Awake behavior are very similar, but these states have significantly different acceleration spectra. These and other observations demonstrate the added utility of head acceleration measurements and influenced the choice of frequency bands used to compute acceleration variables ACC2 for use in the LDA.
Fig. 4.
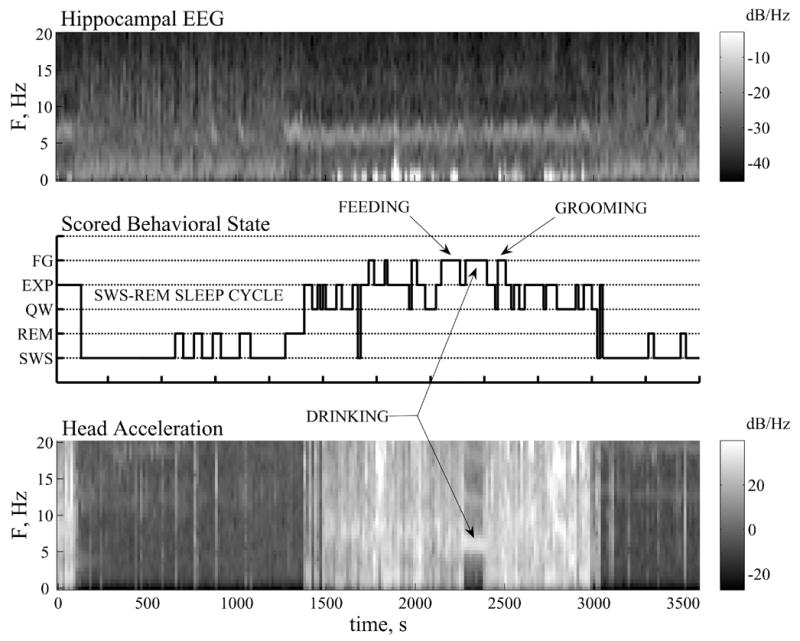
Hypnogram (Center) depicting the sequence of Behavioral states for scored training data, and spectrograms showing temporal changes in the frequency spectra of left hippocampal EEG (Top) and head acceleration A2 (Bottom) for a 60 min segment (240 epochs). In the hypnogram, indeterminate epochs have been relabeled with the nearest behavioral state. The instantaneous Behavioral state is best characterized by examining both EEG and acceleration spectra. For example, similar EEG theta power during REM and Awake states are distinguished by their acceleration spectra, which shows brief twitches (thin vertical bands) during REM and band-limited signatures distinctive of Awake behavior (e.g., 6 Hz for drinking).
State Discrimination Performance
The advantage of including acceleration variables in addition to EEG when using LDA to distinguish the Sleep-wake state is illustrated in Fig. 5. Here we show the positions of the points projected in the canonical state space (2 dimensions for 3 states) from discriminants computed both without (5A) and with (5B) accelerometer information. When accelerometer information is included (Fig. 5B) the different states fall into tighter clusters that have much less overlap. Especially notice that the REM and Awake cluster centers are further apart when acceleration is included (5B).
Fig. 5.

Linear discriminant analysis (LDA) of Sleep-wake states using EEG variables (EEG1) without (A) and with (B) acceleration variables (ACC2). Z1 and Z2 are canonical linear combinations of the input variables that yield the greatest separation between the samples of the three states. Inclusion of accelerometer variables greatly condenses and separates the clusters, and reduces the classifier error C0 from 8.0% to 4.0%. Dashed lines represent state discrimination boundaries.
We present the LDA classification errors for Sleep-wake state and Behavioral state discrimination for Rat I in Fig. 6 and for Rat II in Fig. 7.
Fig. 6.
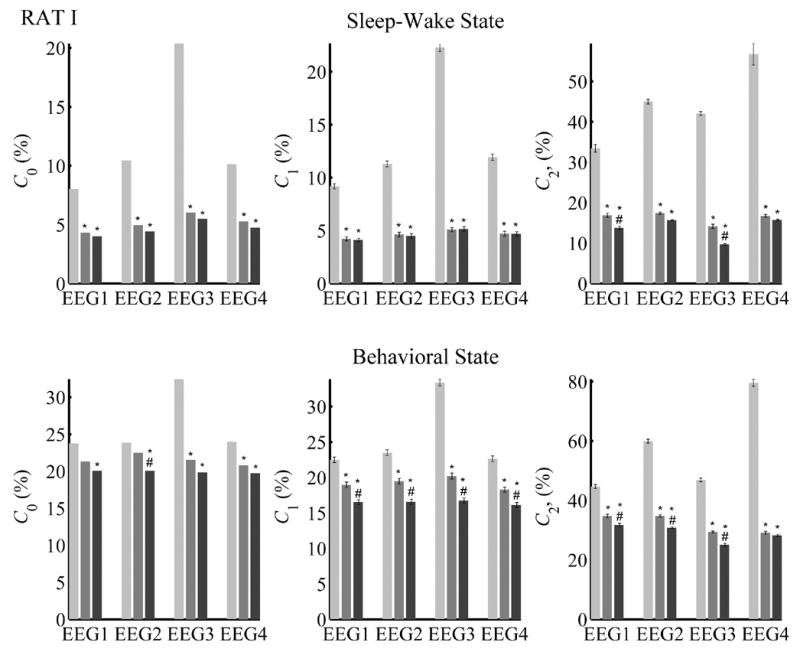
State classification error rates for Rat I with and without acceleration variables. Shown are Sleep-wake (Top row) and Behavioral state (Bottom row) classification errors using EEG variables alone (ACC0, light gray), EEG with ACC1 (medium gray), and EEG with ACC2 (black). C0 = Leave-one-out error rate; C1 = Leave-half-out error rate; C2 = Cross-validation error rate computed with classifier trained on data from the other animal. Error rates are expressed as a percentage. Statistical tests: '*' indicates significant difference (p < 0.05) from EEG+ACC0; '#' indicates significant difference (p < 0.05) from EEG+ACC1. C0 values were compared using the Z-test for differences in proportion. Error bars for C1 and C2 are the 99% confidence limits of the error rate. Comparisons based on C1 or C2 were made using two-way ANOVA with post hoc Tukey pair-wise comparisons. In general, for each EEG method, decreases from adding either ACC1 or ACC2 to EEG were significant. For C1 and C2, the training set comprised 50% of the epochs, randomly selected (n=100); for C1, testing was done on the remaining 50% of the epochs; for C2, testing was done using all epochs.
Fig. 7.

State classification error rates for Rat II with and without acceleration variables. Details as in Fig. 5. Statistical tests: '*' indicates significant difference (p < 0.05) from EEG+ACC0; '#' indicates significant difference (p < 0.05) from EEG+ACC1. In general, for each EEG method, decreases from adding either ACC1 or ACC2 to EEG were significant.
Sleep-wake state (Figs. 6 and 7, Top Row)
In the discrimination of Sleep-wake state (SWS, REM, Awake), the values of the leave-one-out error C0 were all individually found to be significant (p < 0.05). Comparisons of discrimination between variable sets yielded the following results: Without acceleration variables (ACC0), the leave-one-out error C0 averaged over all EEG sets was 12.3% for Rat I and 13.0% for Rat II (n = 4). When acceleration variables were included, C0 dropped significantly (p < 0.05) to a mean of 5.2% for Rat I and 2.3% for Rat II with ACC1 and 4.7% for Rat I and 2.0% for Rat II with ACC2. Although the errors were lower for ACC2 than with ACC1, the differences between these were not significant.
The “leave-half-out” error, C1, was in the same range as C0. Effects of ACC1 and ACC2 followed the same trend as for C0. In each case, both EEG+ACC1 and EEG+ACC2 were significantly lower than EEG+ACC0 (p < 0.05). The C1 error for EEG+ACC2 was lower than for EEG+ACC1 but the difference was not statistically significant except with EEG2 for Rat II.
When classification was done with EEG variables alone (ACC0), the cross-animal classification error C2 was quite high compared to C1, but inclusion of accelerometer information significantly decreased the error rates. Specifically, inclusion of ACC1 reduced C2 by more than half of its value with ACC0 (p < 0.05). In some instances (EEG1 and EEG3 for Rat I, EEG2 for Rat II), ACC2 further significantly reduced C2 (p < 0.05) relative to ACC1 (Figs. 6 and 7, Top).
In summary, when using LDA to differentiate SWS, REM and Awake states, the inclusion of accelerometer data always significantly reduced all error rates compared to using EEG alone. In addition, ACC2 sometimes performed significantly better than ACC1, especially during cross-validation.
Behavioral state (Figs. 6 and 7, Bottom row)
For Behavioral state (SWS, REM, QW, FG, EXP) discrimination the average leave-one-out error C0 using EEG variables alone (ACC0) was higher than for Sleep-wake state. The addition of ACC1 reduced C0 significantly (p < 0.05) with EEG3 and EEG4 for Rat I, and with any variable set for Rat II. Discrimination with ACC2 was always significantly (p < 0.05) better (lower C0) than ACC0.
For EEG+ACC0, C1 was about 25–40%. ACC1 reduced the error significantly (p < 0.05) by about 10%. Inclusion of ACC2 enabled a further significant reduction (p < 0.05) compared to ACC1 of about 2%.
The cross-animal discrimination error C2 computed using only EEG variables was 35% or larger. The use of acceleration variables ACC1 or ACC2 reduced the error significantly (p < 0.05), though the resulting error was still above 25%.
Comparisons between the choices of EEG variables 1–4 sometimes gave significant differences (p < 0.05), but the differences are tangential to the main goals of this study, which are to investigate the utility of acceleration measurements to improve the accuracy of automatic sleep-wake and behavioral state discrimination. The performance of a particular choice of EEG variables may vary depending on the data set and conditions of the recording. For these reasons, we do not comment further on comparisons of EEG feature sets.
EEG-Based State Discrimination is Sensitive to Variable Selection
Sleep-wake staging in animals is often conducted using signals from cortex alone (Robert et al., 1999). We repeated the discrimination analysis excluding the two hippocampal signals. To compare state discrimination from cortical EEG with and without accelerometer variables, we computed the leave-one-out discrimination error C0. We found that when using cortical EEG alone, C0 was higher (average error for EEG1–4, Sleep-Wake: 25.5% for Rat I, 26.5% for Rat II; Behavior: 34.8% for Rat I, 39.0% for Rat II) than when hippocampal EEG was included. However, including acceleration variables again significantly reduced C0 (average error for EEG1–4, Sleep-Wake: 7.1% for Rat I, 2.3% for Rat II; Behavior: 23.6% for Rat I, 23.3% for Rat II). When accelerometer variables were included with EEG, the error rates for inclusion and exclusion of hippocampal signals were not significantly different.
The variability in error, especially when classification is done out-of-sample, is a major concern for automatic sleep staging systems. Scaling of the variables—as done in each of the four chosen methods—reduces their vulnerability to changes in background signal power. In their analysis, Gervasoni et al. (2004) also reduced the number of variables by taking the first principal component of each scaled variable over all available channels, which they report accounted for over 80% of the variability in their data. They then classified states based on cluster analysis within this reduced dimension feature space.
Principal component analysis orients and ranks the axes along the directions of greatest variability in the data but not necessarily the directions of greatest differences between groups to be discriminated. In contrast, Fisher discriminant analysis orients and ranks axes in the data along directions that optimally separate the groups. Therefore, reducing dimensions or variables prior to finding those optimal directions can be counterproductive to LDA. We illustrate this effect in Fig. 8 by presenting the fractional changes in error rates for LDA based on variable set EEG2+ACC0 after different amounts of principal component dimension reduction. In each case, we have computed the principal components for each scaled variable over the four available channels, and reduced the dimension of the data input into the LDA to its projection along the first N largest principal components. Retaining all principal components is equivalent to rotation without dimension reduction. Only when most or all of the principal components are included does the performance reach that found without dimension reduction.
Fig. 8.

Effect of using principal component (PC) dimension reduction on Sleep-wake state LDA classification error. Principal components were computed over two hippocampal and two cortical channels for variable set EEG2, and then different numbers of PCs were used for discrimination. Presented is the increase in leave-one-out error ΔC0 when only the largest specified number of PCs are used, normalized by C0 when classification is done with no dimension reduction. As more PCs are included, performance improves but reaches the level of C0 only when most or all of the PCs are used.
Automatic Staging for Chronic Recordings
The LDA behavioral state classifier using EEG1+ACC2 variables was trained on the scored data and then applied to automatically stage ~3 days of recording each from rats I and II (total of 130 h). The overall state probabilities and state transition probabilities were computed for the chronic recordings and used to construct the transition map shown in Fig. 9. No attempt was made to distinguish intermediate or transitional states; these were classified as the most similar Behavioral state on the LDA feature space.
Fig. 9.
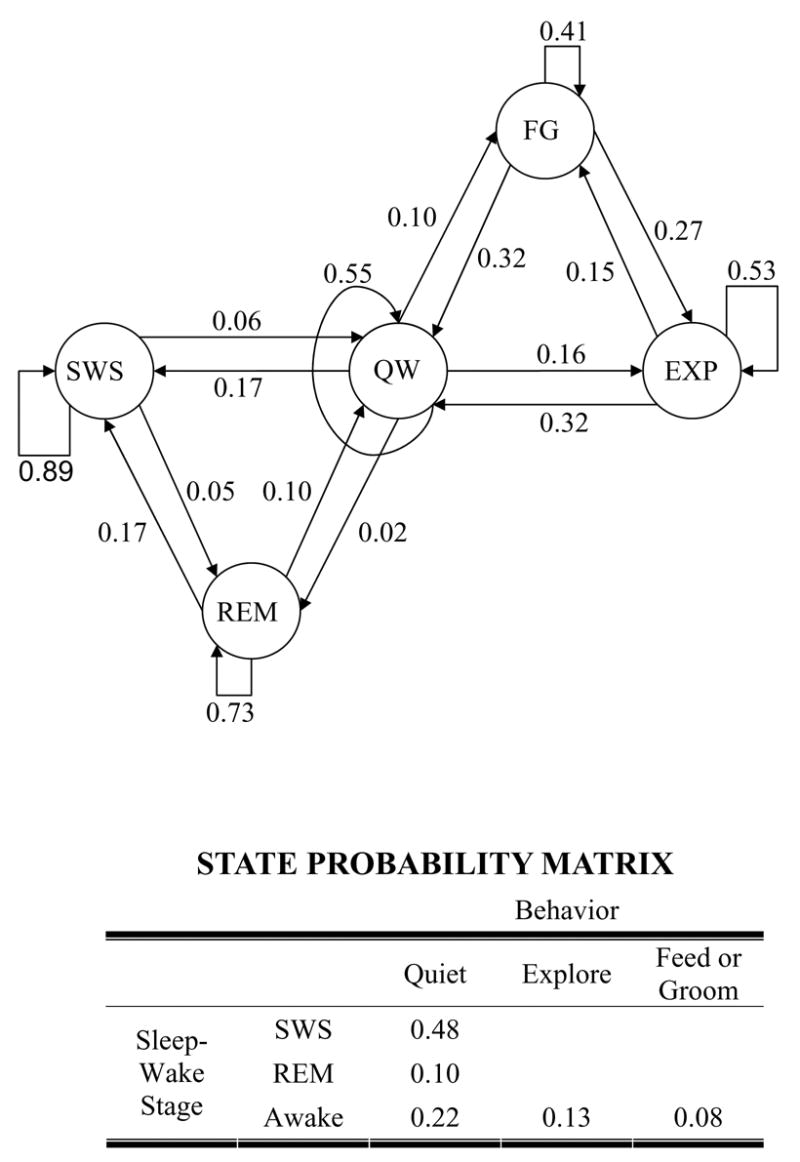
State transition map with transition probabilities (Graph) and probability matrix (Table) of the five Behavioral states. In the graph, the transition probabilities associated with leaving any particular state add up to unity; as do the individual state probabilities in the table. The probabilities were estimated by automatically scoring 130 hours of recording from Rats I and II in 15 s epochs and computing the relative frequencies of occurrence of states and transitions from them. Unlikely transitions, (e.g., between REM and EXP) are not depicted.
Comparisons between properties of the behavioral state transition map generated by LDA classification of extended data sets and the literature are favorable, and confirm that this approach is likely to be reliable enough for automated application.
The relative probabilities of Sleep-wake states are comparable to those reported in the literature (Robert et al., 1999; Costa-Miserachs et al., 2003; Gervasoni et al., 2004; Antle and Mistlberger, 2005). Probabilities of different awake behavioral states are not commonly reported, and when they are, the definitions of the states vary (Robert et al., 2003). Therefore, comparisons of behavioral state probabilities are difficult.
Only one report quantifying state transition probabilities was available (Gervasoni et al., 2004). The FG state was grouped along with QW to make a direct comparison possible. The predominant transitions (SWS to REM and QW, REM to SWS and QW, QW to SWS and EXP, and EXP to QW) and their probabilities for rats I and II were similar to those in Gervasoni et al. (2004), except that in their findings REM transitioned almost exclusively to QW and never back to SWS. In contrast, our results included transitions from REM to both SWS and QW with comparable frequency. Sleep sequences involving repeated cycling between REM and SWS have also been documented by others (Piscopo et al., 2001).
In a stochastic modeling study Gregory and Cabeza (2002) report that the distributions of REM episode durations and inter-REM episode waiting times for male Sprague-Dawley rats appeared to be bimodal in shape, with modal means of 18.6 s and 101.5 s for REM duration and 80–140 s and 400–700 s for inter-REM waiting times. Other estimates of average REM duration are ~23 s (Renger et al., 2004), 21±2 s (Shinomiya et al., 2004) and ~1–2 min (Tiba et al., 2003); the distributions were not specified. Although our 15 s epoch durations do not allow us to compare directly with the REM duration distribution of Gregory and Cabeza (2002), we find a mean REM duration of 55±2 s (median = 30 s), and a mean inter-REM waiting time of 314±13 s (median = 195 s), with distributions that could be bimodal.
DISCUSSION
We have demonstrated that the addition of head acceleration measurements to EEG spectral measurements significantly improves LDA use to automatically classify Sleep-wake and Behavioral state. With EEG alone, we observed wide variability in discrimination performance based on the set of EEG variables used (Costa-Miserachs et al., 2003; Gervasoni et al., 2004; Louis et al., 2004; Sunderam et al., 2005). The addition of acceleration improved and equalized their performance, and rendered the choice of EEG variables less critical.
In sleep-wake studies, the prominence of the theta rhythm both in REM sleep and during active awake behavior makes discrimination between these states difficult with EEG alone (Fig. 4). Although there are instances of EEG being used unaided for state discrimination (e.g., Gervasoni et al., 2004), auxiliary measurements of muscular (EMG) and ocular (EOG) activity are typically used to help differentiate these states (see review by Robert et al., 1999).
The advantage of using head acceleration over EMG or EOG is that it can be done noninvasively. Mundl and Malmo (1979) appear to have been the first to record head movements in animals using a custom-made movement transducer based on a weighted phono-stylus. Accelerometers have been used before to characterize behavior, either fixed to the base of the animal enclosure (Swerdlow et al., 1998) or strapped to the animal’s body (Hernandez-Gonzalez et al., 1997). Thus, accelerometers have been successfully used in the study of diverse behaviors, but the measurements reflected only the relative amplitude or pattern of motion. Modern MEMS accelerometers, which are inexpensive and have high sensitivity, can be integrated onto a single circuit with the head-mounted EEG recording preamplifiers or into the cable connector to the EEG electrodes, at the cost of approximately 0.3 cm2 surface area and 0.15 g. In our work, the DC acceleration sensitivity of the MEMS device gives static as well as dynamic acceleration. As we have shown above, the output can be conveniently processed to give accurate and instantaneous estimates of spatial orientation and acceleration. These capabilities can be employed to quantify motion and behavior more accurately than was previously possible.
In many state classification studies, time consuming human expert evaluation and validation of video records is required. Real-time video tracking of behavior using image processing is feasible but more computation-intensive than one-dimensional measurements such as acceleration. Discrimination of abnormal motor behavior during neonatal seizures (Karayiannis et al., 2005) and the presence of muscle tone during REM sleep behavior disorder (Mahowald and Schenck, 2005) are examples of clinical applications where continuous video tracking has been useful. To detect and study these conditions, continuous, real-time (30 Hz) video measurements for hours or days are required. Acceleration measurements are increasingly being used to detect potentially interesting behavior for retrospective video analysis and quantification in human motion studies (Garnier and Benefice, 2006; Hon et al., 2006).
In our results, including acceleration variables ACC1 or ACC2 always resulted in improved classification error over ACC0, but the improvement with ACC2 when compared to ACC1 was often not significant (28 of 48 comparisons in Figs. 6 and 7). It is well known that the variability in expert scoring of vigilance state is typically 5–10% (Costa-Miserachs et al., 2003; Louis et al., 2004), especially with the ambiguity inherent in classifying single states for 15 s long epochs. Since discrimination with ACC1 is already within the margin of inter-scorer reliability for several cases shown in Figs. 6 and 7, it is unlikely to be improved upon significantly by including ACC2.
Comparing Sleep-wake and Behavioral states, the classification error is greater by an order of magnitude for the latter. This is not simply an effect of the greater number of states to be classified (five versus three) as the error per state is still larger for Behavioral state. The discrepancy is resolved by examining the confusion matrix presented in Table II, which tabulates the errors from classified and actual states when using the LDA with EEG1+ACC2. While SWS and REM are classified with the same high accuracy (> 90%) whether Sleep-Wake or Behavioral states are considered, the sub-classification of awake behavior is relatively poor. FG is misclassified as QW or EXP about 40% of the time. Likewise, QW is often wrongly classified as EXP or FG. It appears that an important source of this error is the limited epoch resolution of 15 s. A particular behavior was scored as FG or EXP if it occurred at any time during an epoch, however brief the duration of the activity, and without regard to its vigor. When the power associated with this activity is averaged over 15 s, its magnitude is diluted and less distinguishable from QW. In addition, multiple behaviors can occur in the same 15 s epoch (e.g., FG followed by EXP), in which case the one with the longest duration in the epoch was used to assign a Behavior score.
TABLE II.
Confusion matrix for Sleep-wake and Behavioral state LDA classification with EEG1+ACC2 variables pooled from Rats I and II. Indeterminate epochs are excluded.
| Sleep-wake | |||||||
|---|---|---|---|---|---|---|---|
| Classified State (% of Total Epochs) | |||||||
| SWS | REM | Awake | Total | ||||
| Actual score | SWS | 97.9 | 0.9 | 1.2 | 1144 | ||
| REM | 0.6 | 92.4 | 7.0 | 171 | |||
| Awake | 1.3 | 0.8 | 97.9 | 888 | |||
|
| |||||||
| Behavior | |||||||
| Classified State (% of Total Epochs) | |||||||
|
|
|||||||
| SWS | REM | QW | EXP | FG | Total | ||
| Actual score | SWS | 97.9 | 0.9 | 1.1 | 0 | 0.1 | 1144 |
| REM | 0.6 | 90.1 | 6.4 | 0.6 | 2.3 | 171 | |
| QW | 3.0 | 1.5 | 63.8 | 19.6 | 12.1 | 398 | |
| EXP | 0 | 0 | 13.4 | 77.3 | 9.3 | 322 | |
| FG | 0 | 0 | 23.2 | 19.1 | 57.7 | 168 | |
We used in this study fixed 15 s epochs to benchmark LDA with accelerometer information against previous work on behavioral staging. The chosen epoch duration of 15 s makes proper evaluation of classifier performance with and without acceleration variables—the primary objective of this study—feasible using reliable visual scores.
We are now implementing these methods for real time use with better time-frequency descriptors, finer grained temporal delimiting of motion, and adaptive learning, to detect both state and state transitions. Since we have shown that the cross-animal validation error is significantly improved by the use of accelerometer variables, an adaptive learning system can use discriminant functions established on other animals as an initial condition for state discrimination.
CONCLUSION
We have shown significant improvement in state discrimination accuracy afforded by the addition of acceleration measurements to EEG. MEMS accelerometers are lightweight (0.15 gram) and inexpensive, less invasive than EMG or EOG, and the modifications in circuitry over that required for EEG acquisition are minimal. We intend to use this improved behavioral state detection capability to formulate and inform detection and feedback control algorithms for treating seizures.
Acknowledgments
This work was funded by National Institutes of Health grants R01EB001507, K02MH01493 and R01MH50006.
References
- Aggelopoulos NC, Meissl H. Responses of neurones of the rat suprachiasmatic nucleus to retinal illumination under photopic and scotopic conditions. J Physiol. 2000;523(Pt 1):211–22. doi: 10.1111/j.1469-7793.2000.t01-1-00211.x. [DOI] [PMC free article] [PubMed] [Google Scholar]
- Antle M, Mistlberger RE. Circadian Rhythms. In: Whishaw IQ, Kolb B, editors. The Behavior of the Laboratory Rat. Oxford University Press; New York: 2005. pp. 183–94. [Google Scholar]
- Broughton RJ. Polysomnography: principles and applications in sleep and arousal disorders. In: Niedermeyer E, Lopes da Silva F, editors. Electroencephalography Basic Principles, Clinical Applications and Related Fields. 4. Lippincott Williams and Wilkins; Baltimore: 1999. pp. 858–95. [Google Scholar]
- Costa-Miserachs D, Portell-Cortes I, Torras-Garcia M, Morgado-Bernal I. Automated sleep staging in rat with a standard spreadsheet. J Neurosci Meth. 2003;130:93–101. doi: 10.1016/s0165-0270(03)00229-2. [DOI] [PubMed] [Google Scholar]
- Flury B. A First Course in Multivariate Statistics. Springer-Verlag; New York: 1997. [Google Scholar]
- Garnier D, Benefice E. Reliable method to estimate characteristics of sleep and physical inactivity in free-living conditions using accelerometry. AEP. 2006;16:364–9. doi: 10.1016/j.annepidem.2005.07.057. [DOI] [PubMed] [Google Scholar]
- Gervasoni D, Lin SC, Ribeiro S, Soares ES, Pantoja J, Nicolelis MA. Global forebrain dynamics predict rat behavioral states and their transitions. J Neurosci. 2004;24:11137–47. doi: 10.1523/JNEUROSCI.3524-04.2004. [DOI] [PMC free article] [PubMed] [Google Scholar]
- Gregory GG, Cabeza R. A two-state stochastic model of REM sleep architecture in the rat. J Neurophysiol. 2002:2589–97. doi: 10.1152/jn.00861.2001. [DOI] [PubMed] [Google Scholar]
- Hernandez-Gonzalez M, Guevara MA, Morali G, Cervantes M. Computer programs to analyze brain electrical activity during copulatory pelvic thrusting in male rats. Physiol Behav. 1997;62:701–8. doi: 10.1016/s0031-9384(97)00006-1. [DOI] [PubMed] [Google Scholar]
- Hon KL, Lam MC, Leung TF, Kam WY, Lee KC, Li MC, Fok TF, Ng PC. Nocturnal wrist movements are correlated with objective clinical scores and plasma chemokine levels in children with atopic dermatitis. Br J Dermatol. 2006;154:629–35. doi: 10.1111/j.1365-2133.2006.07213.x. [DOI] [PubMed] [Google Scholar]
- Jacobs GH, Fenwick JA, Williams GA. Cone-based vision of rats for ultraviolet and visible lights. J Exp Biol. 2001;204(Pt 14):2439–46. doi: 10.1242/jeb.204.14.2439. [DOI] [PubMed] [Google Scholar]
- Karayiannis NB, Tao G, Xiong Y, Sami A, Varughese B, Frost JD, Jr, Wise MS, Mizrahi EM. Computerized motion analysis of videotaped neonatal seizures of epileptic origin. Epilepsia. 2005;46:901–17. doi: 10.1111/j.1528-1167.2005.56504.x. [DOI] [PubMed] [Google Scholar]
- Louis RP, Lee J, Stephenson R. Design and validation of a computer-based sleep-scoring algorithm. J Neurosci Meth. 2004;133:71–80. doi: 10.1016/j.jneumeth.2003.09.025. [DOI] [PubMed] [Google Scholar]
- Mahowald MW, Schenck CH. Insights from studying human sleep disorders. Nature. 2005;437:1279–85. doi: 10.1038/nature04287. [DOI] [PubMed] [Google Scholar]
- Mormann F, Kreuz T, Rieke C, Andrzejak RG, Kraskov A, David P, Elger CE, Lehnertz K. On the predictability of epileptic seizures. Clin Neurophysiol. 2005;116(3):569–87. doi: 10.1016/j.clinph.2004.08.025. [DOI] [PubMed] [Google Scholar]
- Mundl WJ, Malmo HP. An accelerometer for recording head movement of laboratory animals. Physiol Behav. 1979;23:391–3. doi: 10.1016/0031-9384(79)90383-4. [DOI] [PubMed] [Google Scholar]
- Niedermeyer E. Sleep and EEG. In: Niedermeyer E, Lopes da Silva F, editors. Electroencephalography Basic Principles, Clinical Applications and Related Fields. 4. Lippincott Williams and Wilkins; Baltimore: 1999. pp. 174–189. [Google Scholar]
- Paxinos G, Watson C. The New Coronal Set. 5. Elsevier; Amsterdam: 2004. The Rat Brain in Stereotaxic Coordinates. [Google Scholar]
- Peixoto N, Rubin G, Richardson KA, Chernyy N, Lovell R, Spencer RG, Weinstein SL, Schiff SJ, Gluckman BJ. Automated sleep-wake state discrimination in chronically implanted animals using electrophysiological and kinematic variables. Epilepsia. 2004;45 (S7):46. [Google Scholar]
- Piscopo S, Mandile P, Montagnese P, Cotugno M, Giuditta A, Vescia S. Identification of trains of sleep sequences in adult rats. Behav Brain Res. 2001;119(1):93–101. doi: 10.1016/s0166-4328(00)00339-9. [DOI] [PubMed] [Google Scholar]
- Renger JJ, Dunn SL, Motzel SL, Johnson C, Koblan KS. Sub-chronic administration of zolpidem affects modifications to rat sleep architecture. Brain Res. 2004;101:45–54. doi: 10.1016/j.brainres.2004.02.067. [DOI] [PubMed] [Google Scholar]
- Robert C, Guilpin C, Limoge A. Automated sleep staging systems in rats. J Neurosci Meth. 1999;88:111–22. doi: 10.1016/s0165-0270(99)00027-8. [DOI] [PubMed] [Google Scholar]
- Schiff SJ, Sauer T, Kumar R, Weinstein SL. Neuronal spatiotemporal pattern discrimination: The dynamical evolution of seizures. Neuroimage. 2005;28:1043–55. doi: 10.1016/j.neuroimage.2005.06.059. [DOI] [PMC free article] [PubMed] [Google Scholar]
- Shinomiya K, Shigemoto Y, Omichi J, Utsu Y, Mio M, Kamei C. Effects of three hypnotics on the sleep-wakefulness cycle in sleep-disturbed rats. Psychopharmacol. 2004;173:203–9. doi: 10.1007/s00213-003-1727-0. [DOI] [PubMed] [Google Scholar]
- Sunderam S, Peixoto N, Chernyy N, Mason JP, Weinstein SL, Schiff SJ, Gluckman BJ. Sleep-wake stage and behavior discrimination in rats using a combination of EEG and head acceleration measurements. Epilepsia. 2005;46(S8):303. [Google Scholar]
- Swerdlow NR, Varty GB, Geyer MA. Discrepant findings of clozepine effects on prepulse inhibition of startle: Is it the route or the rat? Neuropsychopharmacol. 1998;18:50–6. doi: 10.1016/S0893-133X(97)00110-3. [DOI] [PubMed] [Google Scholar]
- Tiba PA, Palma BD, Tufik S, Suchecki D. Effects of early handling on basal and stress-induced sleep parameters in rats. Brain Res. 2003;975:158–66. doi: 10.1016/s0006-8993(03)02630-1. [DOI] [PubMed] [Google Scholar]