

Abstract
The sterile α-motif (SAM) is a protein module ~70 residues long and mainly involved in the protein–protein interactions of cell signaling and transcriptional repression. The SAM domain of the yeast MAPKKK Ste11 has a well-folded dimeric structure in solution. Interestingly, the well-folded dimer of the Ste11 SAM undergoes a time-dependent self-assembly upon lowering of the pH, leading to the formation of high molecular weight oligomers. The oligomeric structures rapidly disassemble to the well-folded dimer upon reversal of the pH to close to neutral conditions. Circular dichroism (CD) and atomic force microscopy (AFM) experiments demonstrate that the oligomeric structure formed at pH 5.0 appears to be highly helical and has architecture akin to proto-fibrils. Residue-specific kinetics of pH-triggered oligomerization obtained from real-time 15N-1H HSQC experiments indicate that the dimer-oligomer transition appears to involve all residues of the well-folded dimeric structure of the Ste11 SAM. Very interestingly, the interactions of the Ste11 and Ste50 SAM domains also lead to the formation of non-homogeneous hetero-complexes with significant populations of high molecular weight aggregates. AFM imaging shows that the Ste11-Ste50 hetero-polymeric aggregates assume the shapes of circular nano-particles with dimensions of 50–60 nano-meters (nm), in contrast to the proto-fibrils formed by the Ste11 SAM domain alone. Such intrinsic propensity for dimer to oligomer transition of the Ste50-binding SAM domain of Ste11 may endow the MAPKKK Ste11 with unique functional properties required for efficient and high fidelity signal transduction in the budding yeast.
Keywords: SAM domain, Ste11, Ste50, MAPK
The sterile α-motif (SAM) domain is a protein–protein interaction module that was first discovered as part of the multi-domain signaling proteins from yeast and within transcription regulators of Drosophila (Ponting 1995). Up to now, SAM domains have been found in >250 regulatory proteins including tyrosine kinases, Ser/Thr kinases, adaptor proteins, and transcription factors (Ponting 1995; Schultz et al. 1997; Kim and Bowie 2003). Three dimensional structures of several SAM domains have been reported, showing a compact fold made of five helices (Slupsky et al. 1998; Chi et al. 1999; Smalla et al. 1999; Stapleton et al. 1999; Thanos et al. 1999; Kim et al. 2001, 2002; Mackereth et al. 2002; Bhattacharjya et al. 2004; Grimshaw et al. 2004; Kwan et al. 2004). These structural studies also revealed that some SAM domains can form higher order oligomeric structures through self-association. In particular, the SAM domain from the receptor tyrosine kinase EphB2 has been shown to self-associate in the crystal structure and at higher concentrations in solution (Smalla et al. 1999; Thanos et al. 1999). On the other hand, SAM domains of polyhomeotic (ph) and TEL proteins form helical filaments mediated by extensive self-association (Kim et al. 2001, 2002). The intrinsic self-association behavior of TEL and ph SAM domains has been implicated in cellular functions such as transcriptional repression (Golub et al. 1996; Poirel et al. 2000; Kim et al. 2001, 2002). In signal transduction cascades, formation of large protein assemblies would be a highly efficient way to transmit extracellular signals to the nucleus. Pawson et al. (2002, 2003) succinctly describe the very important role of protein-interaction domains in the formation of high-dimensional signaling networks or the “signalo-some” (Powson and Nash 2003; Pawson et al. 2002). Specifically, protein-interaction domains are bestowed with versatile binding properties, e.g., recognition of short sequence segments containing phosphorylated amino acids by SH2, SH3, and PDZ domains, and domain–domain interactions mediated by DD, DED, PDZ, BRCT, and SAM sequences (Pawson and Nash 2003). In contrast to the sequence recognition of SH2 and others, domain–domain interactions have the potential to generate much larger molecular assemblies.
We have been investigating the structures and stability of the SAM-like protein-interaction domain from the budding yeast Sacchromyces cerevisiae, which has been used extensively for functional analyses of mitogen activated protein kinase (MAPK) cascades regulating pheromone responses, filamentation, high-osmolarity growth (HOG), cell wall integrity, and sporulation (Herskowitz 1995). These MAPK pathways are strictly regulated by interactions between the MAPKKK Ste11 and its adaptor protein Ste50 (Schaeffer and Weber 1999; Wu et al. 1999). Recently, we have determined a dimeric solution structure of the Ste11 SAM domain (residues 37–104) that has binding interactions with the Ste50 SAM (Bhattacharjya et al. 2004). In this work, we report that the dimeric Ste11 SAM domain has an intrinsic tendency for oligomerization or formation of high molecular weight protein complexes. Our results again indicate that functions of some SAM domains are likely to be manifested by their unique abilities to form protein polymers, as suggested in previous studies (Kim et al. 2001, 2002).
Results
pH-dependent stability of the dimeric state of the Ste11 SAM domain
Figure 1 ▶ shows a set of 1H-15N HSQC spectra of the Ste11 SAM domain obtained at different time intervals after lowering the sample pH to 5.0. The well-dispersed 1H-15N HSQC spectrum indicates that the folded structure of the Ste11 SAM domain is largely retained immediately after lowering the pH. Almost all the HSQC peaks can be identified with the assignments made at pH 5.8 (Bhattacharjya et al. 2004). Strikingly, the majority of the HSQC cross-peaks underwent a gradual intensity decrease as a function of time. After 30–35 h, the 1H-15N HSQC spectrum is characterized predominantly by a few sharper cross-peaks with limited chemical shift dispersion. These HSQC cross-peaks were found to be from the unstructured amino- and carboxy-terminal residues of the protein. There were no visible signs of any precipitation in the protein sample. Moreover, the pH-induced structural transition could be reversed upon change of the sample pH to 6.8 (data not shown). Therefore, the gradual disappearance of the HSQC cross-peaks appeared to be a result of the formation of high molecular weight soluble polymeric species virtually invisible to NMR due to extremely large line widths. When further assessed by dynamic light scattering, the high molecular weight soluble aggregates showed a limited size distribution centered at a hydrodynamic radius (RH) of 25.2 nm (data not shown). The average molecular weight of the soluble aggregates were thereby estimated to be ~27.7 MDa.
Figure 1.

(A) 1H-15N HSQC spectra of the Ste11 SAM at pH 5.0 showing time dependent disappearance of the 1H-15N cross-peaks. The spectra were acquired immediately after changing pH to 5.0 in a buffer solution of 10 mM potassium phosphate containing 5 mM β-mercaptoethanol at a temperature of 288 K. Only partial assignments are shown for clarity purposes on the 0 h HSQC spectrum. The box indicates amide (NH2) side-chain resonances of Asn and Gln residues. Some cross-peaks that arise from the amino-terminal tag are assigned and subscripted with t as shown in the 30 h HSQC spectrum. The concentration of the Ste11 SAM domain was fixed at 0.5 mM. (B) Plot of the decay constants (kdecay/min) as a function of the residues of the Ste11 SAM domain estimated from the time-dependent loss of 1H-15N HSQC signals at pH 5.0. The bar indicates the average decay constant that has been calculated from the residues in the structured regions of the SAM domain. The decay constants were measured by fitting the intensities of the HSQC peaks for individual residues into a single exponential equation. The decay curve and fitting are shown for two representative residues (C). The amino acid sequence of the Ste11 SAM domain is shown on the top. Positions of the helical secondary structures are shown in (B).
The slow time course of the pH-induced aggregation made it possible to determine the kinetic rate constants for almost all residues except Q11, Q28, D41, and L60, by monitoring the loss of cross-peak intensities as a function of time in the 1H-15N HSQC spectra (Fig. 1B,C ▶). Much lower apparent decay rates were observed for the residues situated at the amino- and carboxy-termini, i.e., D1–D6 and Q67–R68 (Fig. 1B ▶). These residues therefore appear to be unstructured and dynamically flexible in both the dimeric and the oligomerized conformation of the Ste11 SAM domain. On the other hand, the remaining residues had significantly higher decay rates, ranging between 3.14 min−1 to 5.40 min−1, with an average value of 4.3 min−1 (Fig. 1B ▶). Therefore, all residues of the folded dimeric structure of the SAM domain appear to be involved in the formation of soluble aggregates upon lowering of pH. The rates of oligomer formation are essentially uniform for most of the residues, indicating that the polymerization/aggregation process could be highly cooperative (Fig. 1B ▶). Interestingly, a higher than average decay rate of ~5.0 min−1 was observed for some of the residues, including V10, Y22, S25, C29, N30, L45, L48, R61, K62, and S63, suggesting that these residues may participate in the initiation of the oligomerization process.
Circular dichroism and atomic force microscopy studies of the soluble oligomers of the Ste11 SAM domain
The conformations and morphological characteristics of the low pH polymeric structure of the Ste11 SAM domain were further characterized by use of far UV CD and atomic force microscopy (AFM). Figure 2, A and B ▶, show the far UV CD spectra of the Ste11 SAM domain at pH 5.0 after complete aggregation and at pH 5.8 in the dimeric state, respectively. The two intense CD bands at 225 nm and 210 nm for the native state of the Ste11 SAM (Fig. 2A ▶) are characteristic of a high content of helical structures, in exact agreement with the helical structure of the Ste11 SAM domain (Bhattacharjya et al. 2004). Remarkably, a very similar CD spectrum with diagnostic bands at ~225 nm and 210 nm was also obtained for the soluble aggregated form of the Ste11 SAM domain at pH 5.0, demonstrating the presence of “native-like” helical secondary structures (Fig. 2B ▶).
Figure 2.


Far UV-CD spectra of the Ste11 SAM domain in (A) the dimeric state at pH 5.8 and in (B) the polymeric state at pH 5.0. (C) AFM images and (D) section analysis of the polymeric state of the Ste11 SAM domain formed at pH 5.0. Sample concentrations for AFM experiments were the same as those used for far UV-CD, as detailed in Materials and Methods.
Atomic force microscopy (AFM) images were obtained for an aggregated sample of the Ste11 SAM domain at pH 5 deposited on mica (Fig. 2C ▶). These images show the formation of a number of individual long and thin filaments as well as areas with several intertwined filaments. Most of the filaments are in the range of several hundred nanometers in length, although a few shorter filaments were also present. Their random orientations on the mica indicate that they are quite flexible and that there are a number of areas where the individual filaments cross each other. Section analysis (Fig. 2D ▶) indicates that the filaments are 2.3 (±0.5) nanometers (nm) in height except for areas where two individual fibers cross or intersect where the measured height is ~4.5 nm. The measured width is ~23 (±4) nm, which is ~13 nm wider than the actual diameter of the filaments due to convolution effects with the AFM tip. The AFM images also show evidence for individual subunits that comprise the filaments. These appear to be reasonably uniform in size and spacing, as shown in the section analyses, which indicates a periodicity of ~18 nm. The overall morphology of the Ste11 SAM filaments resembles that of β-amyloid proto-fibrils, which precede the formation of amyloid fibrils and plaques (Ding and Harper 1999).
Interactions of the Ste11 SAM domain with Ste50 SAM
Previously, we have assessed binding between Ste11 SAM and Ste50 SAM by native PAGE, NMR, and H/D exchange experiments (Bhattacharjya et al. 2004). Severe broadening of NMR resonances and observation of disproportionate band shifts in the native PAGE indicated possible formation of high molecular weight soluble species. Dynamics Light Scattering (DLS), tryptophan fluorescence, and atomic force microscopy are utilized to gain further insight into the polymeric forms stabilized by the Ste11 and Ste50 SAM interactions. DLS experiments were performed to examine the size distribution of the molecular complexes formed by the Ste11 and Ste50 SAM fragments (Fig. 3 ▶). The isolated Ste11 and Ste50 SAM domains were homogeneously dispersed over closely related sizes centered on an average RH of ~2.3 nm for the Ste11 and 1.9 nm for the Ste50 SAM domains, respectively (Fig. 3A ▶). A dramatic increase in molecular sizes at higher RH values was observed as a result of interactions between the Ste11 and Ste50 protein fragments (Fig. 3B,C ▶). At a high stoichiometric ratio, e.g., 4:1, of the Ste50 and Ste11 SAM domains, there was limited formation of high molecular weight complexes with an RH ranging from 5–38 nm along with molecular species with lower RH values of 1.4–3.7 nm (Fig. 3B ▶). At a concentration ratio of 1:1, a much larger aggregate varying from 5–140 nm was observed (Fig. 3C ▶). It is also noteworthy that at any concentration ratio of the Ste11 and Ste50 SAM domains, molecular species possessing low RH values (1.8–4.8 nm), co-exist with the high molecular weight aggregates. In all, the light scattering data showed the formation of an apparently non-homogeneous complex between the Ste11 and Ste50 SAM domains distributed over many different types of oligomerization states.
Figure 3.

Plots (A,B,C) of the hydrodynamic radii (RH) versus percentage of scattered light obtained from the dynamic light scattering experiments for the free SAM domains and the Ste11 SAM-Ste50 SAM complexes formed at pH 6.8. (A) Free Ste11 SAM domain and free Ste50 SAM domain (A, inset), (B) the Ste11/Ste50 SAM complex at 4:1 ratio, and (C) the Ste11/Ste50 SAM complex at 1:1 ratio. (D) Plot showing change of intrinsic tryptophan fluorescence intensity (filled circles) and the position of emission maximum (λmax, open circles) of the Ste50 SAM domain as a function of increasing concentrations of the Ste11 SAM domain. Aliquots of the Ste11 SAM domain were added from a concentrated stock solution into a fixed concentration of 1 μM of the Ste50 SAM domain. An excitation wavelength of 295 nm was used and the emission spectra were scanned between 320–500 nm.
The lack of tryptophan residues in the primary sequence of the Ste11 SAM domain makes it possible to examine changes in intrinsic tryptophan fluorescence of the Ste50 SAM domain as a function of the concentration of its binding partner. Interactions with the Ste11 SAM did not cause appreciable changes in the position of the fluorescence emission maximum (at λmax = 345 nm) of the Ste50 SAM domain (Fig. 3D ▶), indicating the lack of binding-induced structural rearrangements of the Ste50 SAM domain. However, there were concomitant changes in the intensity of fluorescence with the addition of the Ste11 SAM domain. The addition of only 0.18–0.20 molar equivalent of the Ste11 SAM led to an enhancement of fluorescence intensity followed by a steady quenching with increasing concentrations of the Ste11 SAM (Fig. 3D ▶). The quenching of fluorescence intensities appear to be saturated at a ratio of 2:1 (Ste11:Ste50). The observed changes in tryptophan fluorescence of the Ste50 SAM domain can be rationalized by the formation of soluble aggregates as similarly observed in aggregate formation of β-amyloid peptides (Huang et al. 2000).
Atomic force microscopy (AFM) was used to more closely examine the sizes and morphologies of the soluble aggregates formed by the Ste11 and Ste50 SAM complexes. These aggregates appear to be roughly spherical with diameters varying from 13–50 nm (Fig. 4A,B ▶). We have also observed a sub-population of the molecular aggregates characterized by annular structures with somewhat larger diameters and increased height. It is conceivable that such morphological features arose as a result of the association of smaller spherical structures. AFM images of uncomplexed Ste11 (Fig. 4C ▶) and uncomplexed Ste50 (data not shown) at pH 7 showed no evidence of the formation of soluble spherical aggregates.
Figure 4.
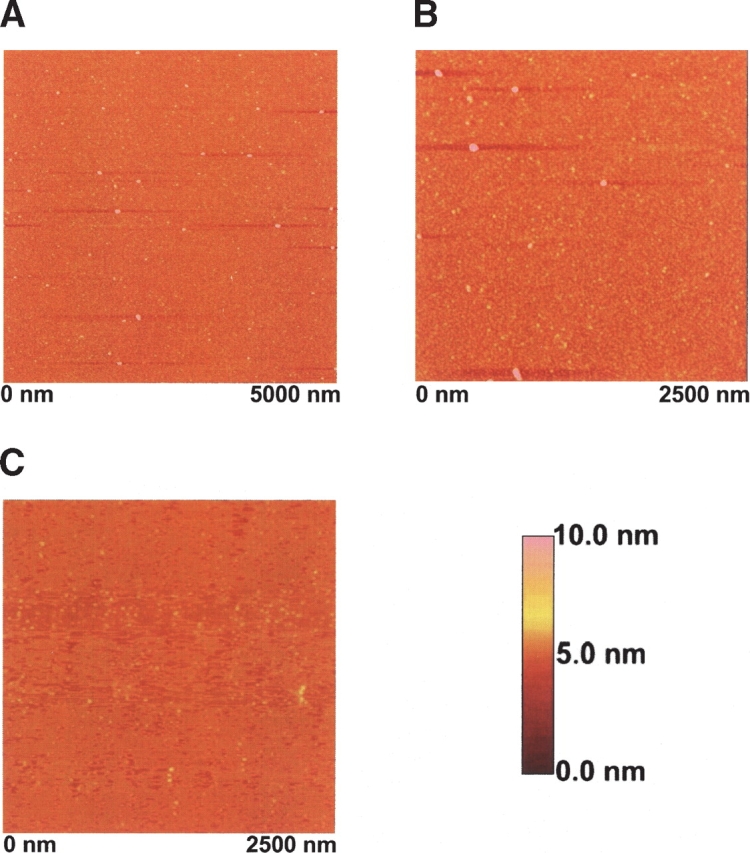
AFM images (A,B) of the Ste11 and Ste50 SAM complexes. AFM images showed small spherical particles of different sizes for a sample of the Ste11/Ste50 SAM complex as described in Figure 3 ▶. AFM image of the free (dimeric) Ste11 SAM domain (C) is also shown as a comparison.
Discussion
pH-induced oligomerization of the Ste11 SAM domain
The stability of the dimeric state of the Ste11 SAM domain appears to be critically dependent on the solution pH conditions. The dimeric structure shows remarkably long-term stability at pH 5.8 enabling extensive structural studies by use of NMR (Bhattacharjya et al. 2004). Surprisingly, only a slight lowering of pH toward acidic conditions dramatically reduces the stability of the dimer and induces a time-dependent polymerization/aggregation process. Polymerization occurring at pH 5.0 is inherently slow, appears to be highly cooperative, and goes to completion only after ~30–40 h. The polymeric state of the Ste11 SAM has well-defined helical secondary structures that assemble into long and thick helical filaments. Earlier studies have shown the formation of stable (irreversible) oligomers (dimers and polymers) by SAM domains of different sequences (Kim et al. 2001, 2002 and references cited therein). The pH-triggered reversible polymerization of the dimeric Ste11 SAM is therefore a novel observation. The pH-induced self-assembly of the Ste11 SAM domain is also structurally and mechanistically different from the acid-induced polymerization of proteins into insoluble aggregates or β-amyloids. Several studies have demonstrated that unfolding of folded proteins or protein domains is the prerequisite to the acid-induced formation of amyloid polymers (Chiti et al. 2001; Dobson 2004). In contrast, the polymeric state of Ste11 SAM stabilized at pH 5.0 is still rich in helical structures and highly soluble as opposed to the predominantly β-sheet structures of insoluble amyloid polymers (Dobson 2004). These aggregation properties of the Ste11 SAM again indicate that highly soluble helical polymers may represent active structural assemblies relevant for normal biological functions as proposed for other polymerizing SAM domains (Kim et al. 2001, 2002). In addition, the pH-induced assembly of the Ste11 SAM may occur in cellular compartments close to the membrane surface where negatively charged moieties from phospholipid bilayers may create a low pH environment (Bychkova et al. 1996). Interestingly, signaling complexes involving Ste11/Ste50 are indeed targeted to the membrane surface through membrane-anchored binding partners (Ramezani-Rad 2003). Such delicate pH-induced effects also appear to be operative for the conformational stability of the catalytically active structure of human ca-thepsin B (Song et al. 2000).
Hetero-complexes of the Ste11 and Ste50 SAM domains
The oligomerization activity of the Ste11/Ste50 SAM complex may be facilitated by the intrinsic polymerization propensity of the Ste11 SAM domain as observed at slightly acidic pH. As well, we did not detect any formation of soluble aggregates for the isolated Ste50 SAM domain under similar experimental conditions (S. Bhattacharjya and F. Ni, unpubl.). However, pH-induced polymers of the isolated Ste11 SAM domain differ in morphology and in size as compared to soluble aggregates formed after binding to the Ste50 SAM domain. The aggregated forms of the Ste11/ Ste50 SAM complex are much smaller with a diversity of size distributions (2–140 nm) and appear to be spherical in shape. On the other hand, the pH-stabilized polymeric state of the Ste11 SAM is larger with a filament-like architecture. In other words, the extent of polymerization induced at pH 5.0 is significantly larger than the one “catalyzed” by the formation of the Ste11 and Ste50 SAM complexes. Interestingly, a recent biophysical analysis of the interactions between the SAM domains of Byr2 and Ste4, homologues of Ste11 and Ste4, respectively, from the fission yeast Schizosaccharomyce pombe have shown a somewhat different binding scenario (Ramachander et al. 2002) than the one observed in this study. The isolated Byr2 and Ste4 SAM domains interact at a 1:1 ratio, forming a simple, low-affinity heterodimer. However, extension of the Ste4 SAM domain to include a leucine zipper domain (Ste4 SAM-LZ) has been shown to both augment the affinity of the interaction with the Byr2 SAM and shift the binding stoichiometry to 3:1 (Ste4:Byr2). The oligomeric hetero-complex formed by Byr2 and Ste4 SAM domains appears to be in a closed conformation without any polymer-like propensities. A similar leucine zipper motif has not been shown to exist in Ste50 of Sacchromyces cerevisiae, indicating different signaling mechanisms between the evolutionarily diversified budding and fission yeasts.
Biological implications
A growing amount of experimental evidence shows that the function of Ste50 is dominantly manifested by its interactions with Ste11 through the SAM domains. Our results demonstrate that physical interactions between the Ste11 and Ste50 SAM domains do not lead to major conformational changes (e.g., folding-unfolding); rather their interactions stimulate formation of higher-order molecular assemblies. However, the presence of such high molecular weight complexes involving intact Ste11 and Ste50 is yet to be detected in an in vivo cellular environment. Regardless, the formation of high molecular weight oligomeric Ste11 and Ste50 complexes may have several implications in optimizing and regulating transmission of cellular signals. Under limiting intracellular concentrations of the Ste11 and Ste50 proteins, oligomerization of Ste11 and Ste50 may lead to amplification of the transduced signals through increasing local concentrations of the Ste11 kinase and to efficient trans-phosphorylation and phosphorylation of downstream kinases. Secondly, the heterogeneous nature of the oligomeric Ste11/Ste50 complexes is an appealing target for ubiquitin-dependent degradation of Ste11 in the MAPK feedback pathway, since a ubiquitin-dependent rapid degradation of Ste11 has been shown to regulate the pheromone response pathway in budding yeast (Esch and Errede 2002). Most importantly, the higher-order oligomeric structures stabilized by the Ste11 and Ste50 SAM domains may also have immense potential to serve as a platform in recruiting other signaling proteins and building complex signaling networks as proposed for the functioning of intricate cellular machines (Pawson and Nash 2003).
Materials and methods
Expression and purification of the Ste11 and Ste50 SAM domains
DNA sequences corresponding to the SAM domains of Ste11 (D37–R104; numbering according to Swiss-Prot accession number P23561) and Ste50 (M27–Q131; numbering according to Swiss-Prot accession number P25344) were PCR amplified from the genomic DNA of the budding yeast and cloned into pET14b and pGEX-2T vectors with a thrombin-cleavable amino-terminal His6-tag (Qiagen) and GST-tag (Pharmacia), respectively. Both the fragments were overexpressed in Escherichia coli BL21 (DE3) pLysS, induced at an OD600 of 0.6–0.7 with 1 mM IPTG, and incubated for 6–12 h at 25°C for protein production. The cells were centrifuged and resuspended either in 20 mM tris-hydrochloride buffer or in phosphate buffered saline, pH 8.0. The cell solution was lysed by sonication and the supernatant was either applied onto a nickel-NTA column for His-tag based purification (Qiagen) or onto a glutathione sepharose column for GST-tag (Pharmacia) based purifications. Weakly bound proteins were removed from the column by extensive washing with appropriate buffers. Strongly bound target proteins were eluted from the resins either with 500 mM imidazole or 20 mM reduced glutathione for the Ste11 fragment and Ste50 fragment, respectively. The fusion proteins were digested with thrombin to remove the affinity tags (GST or His-tag). The protein containing fractions were pooled and extensively dialysed against 10 mM potassium phosphate solutions, containing 10 mM β-mercaptoethanol, adjusted to different pHs (6.8–5.0). For the production of uniformly labeled 15N protein, the expressing bacteria were grown in M9 minimal medium containing (15 NH4)2SO4. 2-D 15N-1H HSQC spectra were acquired in 10 mM potassium phosphate buffer, pH 5.8 or pH 5.0 at 288 K.
Dynamic light scattering, circular dichroism (CD) and fluorescence experiments
Light scattering experiments were performed with a DynaPro instrument (Protein Solutions) using a 12 μL quartz sample cuvette. Protein samples were centrifuged and passed through a filter to remove dust particles. Typical protein concentrations used for DLS measurement ranges from 20–50 μM in 10 mM potassium phosphate solution containing 10 mM β-mercaptoethanol at pH 6.8. The dynamicsTM 5.26.38 software was used for data collection, processing, and analysis.
Far UV-CD (250–200 nm) spectra were recorded on a JASCO 720 spectropolarimeter using cells with a pathlength of 1 mm at 288 K. Sample concentrations were fixed to 20 μM in 10 mM potassium phosphate solution, pH 5.8 (dimeric state) or pH 5.0 (polymeric state).
Fluorescence spectra were recorded using a Hitachi spectrofluorimeter using cells with a pathlength of 1 cm. The excitation and emission band passes were set to 10 nm. Protein samples were prepared in a solution of 10 mM potassium phosphate solution containing 5 mM β-mercaptoethanol at pH 6.8.
Atomic force microscopy (AFM) measurements
For AFM imaging of the pH-induced polymeric state of the Ste11 SAM domain, samples were initially prepared in 10 mM potassium phosphate solution containing 10 mM β-mercaptoethanol at pH 5.8, followed by carefully lowering of pH to 5.0 through step-wise addition of small amounts of 0.1 N HCl. The polymerizations were monitored over a period of 40–50 h by NMR spectroscopy and DLS. For imaging soluble aggregates of the Ste11 and Ste50 SAM complexes, samples were mixed immediately prior to experiments. Typically for AFM imaging, small aliquots (~5 μL) of the protein solutions were incubated on the surface of freshly cleaved mica for 60 sec. Following incubation, the samples were rinsed with Millipore water to remove excess unbound protein and buffer salts. The sample was dried under a gentle stream of nitrogen and imaged using a Digital Instruments Nanoscope III atomic force microscope (AFM) in tapping mode under ambient conditions. The J scanner (100 × 100 μm2) and silicon nitride cantilevers (TESP100) were used for all experiments. Imaging parameters such as set point and drive amplitude were adjusted so that a minimum force was applied. This procedure ensured that the samples could be imaged reproducibly without modifying or damaging the protein particles. All scans were done at room temperature. Several scans at macroscopically different locations on the sample were obtained to ensure reliability. Any background slope in the images was removed using the flatten function available with the DI software.
Article published online ahead of print. Article and publication date are at http://www.proteinscience.org/cgi/doi/10.1110/ps.041122105.
References
- Bhattacharjya, S., Xu, P., Gingras, R., Shaykhutdinov, R., Wu, C., Whiteway, M. and Ni, F. 2004. Solution structure of the dimeric SAM domain of MAPKKK Ste11 and its interactions with the adaptor protein Ste50 from the budding yeast: Implications for Ste11 activation and signal transmission through the Ste50-Ste11 complex. J. Mol. Biol. 344 1071–1087. [DOI] [PubMed] [Google Scholar]
- Bychkova, V.E., Dujsekina, A.E., Klenin, S.I., Tiktopulo, E.I., Uversky, V.N., and Ptitsyn, O.B. 1996. Molten globule-like state of cytochrome c under conditions simulating those near the membrane surface. Biochemistry 35 6058–6063. [DOI] [PubMed] [Google Scholar]
- Chi, S.W., Ayed, A., and Arrowsmith, C.H. 1999. Solution structure of a conserved C-terminal domain of p73 with structural homology to the SAM domain. EMBO J. 18 4438–4445. [DOI] [PMC free article] [PubMed] [Google Scholar]
- Chiti, F., De Lorenzi, E., Grossi, S., Mangione, P., Giorgetti, S., Caccialanza, G., Dobson, C.M., Merlini, G., Ramponi, G., and Bellotti, V. 2001. A partially structured species of β 2-microglobulin is significantly populated under physiological conditions and involved in fibrillogenesis. J. Biol. Chem. 276 46714–46721. [DOI] [PubMed] [Google Scholar]
- Ding, T.T. and Harper, J.D. 1999. Analysis of amyloid-assemblies using tapping mode atomic force microscopy under ambient conditions. In Methods in Enzymology (ed. R. Wetzel), Vol. 309, pp. 510–525. Academic Press, New York. [DOI] [PubMed]
- Dobson, C.M. 2004. Principles of protein folding, misfolding and aggregation. Semin. Cell Dev. Biol. 15 3–16. [DOI] [PubMed] [Google Scholar]
- Esch, R.K. and Errede, B. 2002. Pheromone induction promotes Ste11 degradation through a MAPK feedback and ubiquitin-dependent mechanism. Proc. Natl. Acad. Sci. 99 9160–9165. [DOI] [PMC free article] [PubMed] [Google Scholar]
- Golub, T.R., Goga, A., Barker, G.F., Afar, D.E., McLaughlin, J., Bohlander, S.K., Rowley, J.D. Witte, O.N., and Gilliland, D.G. 1996. Oligomerization of the ABL tyrosine kinase by the ETS protein TEL in human leukemia. Mol. Cell. Biol. 16 4107–4116. [DOI] [PMC free article] [PubMed] [Google Scholar]
- Grimshaw, S.J., Mott, H.R., Stott, K.M., Nielson, P.R., Evetts, K.A., Hopkins, L.J., Nietlispach, D., and Owen, D. 2004. Structure of the SAM domain of the S.cerevisiae MAPK pathway modulating protein STE50 and analysis of its interaction with STE11 SAM. J. Biol. Chem. 279 2192–2201. [DOI] [PubMed] [Google Scholar]
- Herskowitz, I. 1995. MAP kinase pathways in yeast: For mating and more. Cell 80: 187–197. [DOI] [PubMed] [Google Scholar]
- Huang, T.H.J., Yang, D., Plaskos, N.P., Go, S., Yip, C.M., Fraser, P.E., and Chakrabartty, A. 2000. Structural studies of soluble oligomers of the Alzheimer b-amyloid peptide. J. Mol. Biol. 297 73–78. [DOI] [PubMed] [Google Scholar]
- Kim, C.A. and Bowie, J.U. 2003. SAM domains: Uniform structure, diversity of function. Trends Biochem. Sci. 12 625–628. [DOI] [PubMed] [Google Scholar]
- Kim, C.A., Phillps, M.L., Kim, W., Gingery, M., Tran, H.H., Robinson, M.A., Faham, S. and Bowie, J.U. 2001. Polymerization of the SAM domain of TEL in leukemogenesis and transcriptional repression. EMBO. J. 20 4173–4182. [DOI] [PMC free article] [PubMed] [Google Scholar]
- Kim, C.A., Gingery, M., Pilpa, R.M., and Bowie, J.U. 2002. The SAM domain of polyhomeotic forms a helical polymer. Nat. Struct. Biol. 9 453–457. [DOI] [PubMed] [Google Scholar]
- Kwan, J.J., Warner, N., Pawson, T., and Donaldson, L.W. 2004. The solution structure of the S.cerevisiae Ste11 MAPKKK SAM domain and its partnership with Ste50. J. Mol. Biol. 342 681–693. [DOI] [PubMed] [Google Scholar]
- Mackereth, C.D., Scharpf, M., Gentile, L.N., and McIntosh, L.P. 2002. Chemical shift and secondary structure conservation of the PNT/SAM domains from the ets family of transcription factors. J. Biomol. NMR 24 71–72. [DOI] [PubMed] [Google Scholar]
- Pawson, T. and Nash, P. 2003. Assembly of cell regulatory system through protein interaction domains. Science 300 445–452. [DOI] [PubMed] [Google Scholar]
- Pawson, T., Raina, M. and Nash, P. 2002. Interaction domains: From simple binding events to complex cellular behavior. FEBS Lett. 513 2–10. [DOI] [PubMed] [Google Scholar]
- Poirel, H., Lopez, R.G., Lacronique, V., Della Valle, V., Mauchauffe, M., Berger, R., Ghysdael, J., and Bernard, O.A. 2000. Characterization of a novel ETS gene, TELB, encoding a protein structurally and functionally related to TEL. Oncogene 19 4802–4806. [DOI] [PubMed] [Google Scholar]
- Ponting, C.P. 1995. SAM: A novel motif in yeast sterile and Drosophila poly-homeotic proteins. Protein Sci. 4 1928–1930. [DOI] [PMC free article] [PubMed] [Google Scholar]
- Ramachander R., Kim C.A., Phillips, M.L., Mackereth, C.D., Thanos, C.D., McIntosh L.P., and Bowie, J.U. 2002. Oligomerization-dependent association of the SAM domains from Schizosaccharomyces pombe Byr2 and Ste4. J. Biol. Chem. 277 39585–39593. [DOI] [PubMed] [Google Scholar]
- Ramezani-Rad, M. 2003. The role of adaptor protein Ste50-dependent regulation of the MAPKKK Ste11 in multiple signalling pathways of yeast. Current Genetics 43 161–170. [DOI] [PubMed] [Google Scholar]
- Schaeffer, H.J. and Weber, M.J. 1999. Mitogen-activated protein kinases: Specific messages from ubiquitous messengers. Mol. Cell. Biol. 19 2435–2444. [DOI] [PMC free article] [PubMed] [Google Scholar]
- Schultz, J., Ponting, C.P., Hofmann, K., and Bork, P. 1997. SAM as a protein interaction domain involved in developmental regulation. Protein Sci. 6 249–253. [DOI] [PMC free article] [PubMed] [Google Scholar]
- Slupsky, C.M., Gentile, L.N., Donaldson, L.W., Mackereth, C.D., Seidel, J.J., Graves, B.J., and McIntosh, L.P. 1998. Structure of the Ets-1 pointed domain and mitogen-activated protein kinase phosphorylation site. Proc. Natl. Acad. Sci. 95 12129–12134. [DOI] [PMC free article] [PubMed] [Google Scholar]
- Smalla, M., Schmieder, P., Kelly, M., Ter-Laak, A., Krause, G., Ball, L., Wahl, M., Bork, P., and Oschkinat, H. 1999. Solution structure of the receptor tyrosine kinase EphB2 SAM domain and identification of two distinct homotypic interaction sites. Protein Sci. 8 1954–1961. [DOI] [PMC free article] [PubMed] [Google Scholar]
- Song, J., Xu, P., Xiang, H., Su, Z., Storer, A.C., and Ni, F. 2000. The active-site residue Cys-29 is responsible for the neutral-pH inactivation and the refolding barrier of human cathepsin B. FEBS Lett. 475 157–162. [DOI] [PubMed] [Google Scholar]
- Stapleton, D., Balan, I., Pawson, T., and Sicheri, F. 1999. The crystal structure of an Eph receptor SAM domain reveals a mechanism for modular dimerization. Nat. Struct. Biol. 6 44–49. [DOI] [PubMed] [Google Scholar]
- Thanos, C.D., Goodwill, K.E., and Bowie, J.U. 1999. Oligomeric structure of the human EphB2 receptor SAM domain. Science 283 833–836. [DOI] [PubMed] [Google Scholar]
- Wu, C., Leberer, E., Thomas, D.Y., and Whiteway, M. 1999. Functional characterization of the interaction of Ste50p with Ste11p MAPKKK in Saccharomyces cerevisiae. Mol. Biol. Cell 10 2425–2440. [DOI] [PMC free article] [PubMed] [Google Scholar]