

Abstract
Two-chain aggregation simulations using minimalist models of proteins G, L, and mutants were used to investigate the fundamentals of protein aggregation. Mutations were selected to break up repeats of hydrophobic beads in the sequence while maintaining native topology and folding ability. Data are collected under conditions in which all chain types have similar folded populations and after equilibrating the separated chains to minimize competition between folding and aggregation. Folding cooperativity stands out as the best single-chain determinant under these conditions and for these simple models. It can be experimentally measured by the width of the unfolding transition during thermal denaturation and loosely related to population of intermediate-like states during folding. Additional measures of cooperativity and other properties such as radius of gyration fluctuations and patterning of hydrophobic residues are also examined. Initial contact system states with transition-state characteristics can be identified and are more expanded than average initial contact states. Two-chain minimalist model aggregates are considerably less structured than their native states and have minimal domain-swapping features.
Keywords: protein aggregation, aggregation oligomers, folding cooperativity, aggregate structure, protein simulation
Undesirable protein aggregation is a major problem in many diseases and in industrial production of pharmaceuticals. Deposits of aggregates, often present as structured fibrils, are associated with neurological diseases such as Alzheimer’s, Creuzfeldt-Jacobs, Huntington’s, and Parkinson’s (Dobson 2001; Selkoe 2003). In some cases, such as Parkinson’s, it is unclear if the deposits themselves are toxic or are simply a byproduct of the disease state. The stability of fibrils suggests that they are relatively inert and, in concurrence, recent studies have found that early oligomeric states are likely more toxic (Bucciantini et al. 2002; Olofsson et al. 2002; Walsh et al. 2002; Kayed et al. 2003). Comparatively little is known about these low-molecular-weight species, but they may be micelle-like in structure (Lomakin et al. 1996). It is particularly important to understand the driving forces behind their formation so that preventative strategies can be developed.
Aggregation can also be a problem during industrial protein expression when proteins not native to the host organism are overexpressed (Clark 2001; Chi et al. 2003; Roberts 2003). These high-concentration-product proteins often aggregate and must be denatured from inclusion bodies, then renatured under kinetic and thermodynamic constraints while minimizing operation costs. Improved understanding of aggregation will increase our ability to design proteins and conditions to improve renaturation or to inhibit aggregation entirely.
Significant progress in understanding the aggregation process has been made experimentally using protein engineering techniques. Aggregation is thought to occur most easily through partially unfolded intermediates (Fink 1998; Horwich 2002). Under partially denaturing conditions, regions once forming intramolecular interactions instead switch to forming intermolecular contacts. Antibodies grown against P22 tailspike folding intermediates bind to aggregates but not denatured or folded states, suggesting that the aggregate forms through folding intermediates (Speed et al. 1997). Partially unfolded aggregation-prone conformations of transthyretin have been observed using NMR (Liu et al. 2000). Full denaturation inhibits aggregation, because denaturing conditions also disfavor condensed aggregates. Partially unfolded states can be favored by destabilizing the native state or reducing the barrier to unfolding. Work with lysozyme demonstrates that increased aggregation can result from mutations that either slow folding or that make unfolding easier (Dobson 2001). Similarly, kinetic destabilization of transthyretin tetramers leads to aggregation because it frees monomers (Hammarstrom et al. 2003).
It is intuitive and reasonably well accepted that more stable proteins tend to resist aggregation (Hurle et al. 1994), but the exact connections between protein properties and aggregation propensity are still blurred. A number of possible aggregation mechanisms are still being investigated (Kelly 2000; Thirumalai et al. 2003). In at least one case, protein regions important in determining the folding rate are distinct from those that determine the aggregation rate (Chiti et al. 2002). The aggregation-rate-determining regions of the same acylphosphatase protein are those that are most solvent-exposed and susceptible to protease degradation under partially denaturing conditions (Monti et al. 2004). Studies on the same protein produced determinants based on charge, β-strand secondary-structure propensity, and hydrophobicity that are successful in predicting the aggregation propensity of known disease-related mis-folders (Chiti et al. 2003). A similar, very recent study achieved similar success with an empirical correlation that also incorporated residue dipole moment, accessible surface area, and aromaticity (Tartaglia et al. 2004). Despite clear success, there is still 1–2 orders of magnitude scatter in their predictions and therefore a need for further understanding.
Results and Discussion
In this work, the entire process of two-chain aggregate formation is examined using a simplified computational model. Although more than two chains may be required to produce a structured aggregate or examine rate-limiting steps, examination of this simple case is important because all oligomers or aggregates must necessarily pass through a two-chain state. A number of mutations were made that significantly affect the aggregation propensity, and attention is paid to how single-chain properties relate to aggregation. The intention in this work is to search for additional factors beyond those found by Chiti et al. (2003) that control aggregation.
Single-chain realism and characteristics
Experimental studies have difficulty resolving atomic detail, and molecular dynamics simulations at the level of atomic detail cannot access long enough timescales to observe aggregation. To circumvent the timescale problem, other simulation studies have used lattice models (Broglia et al. 1998; Harrison et al. 1999; Istrail et al. 1999; Bratko and Blanch 2001 Bratko and Blanch 2003; Shimizu and Chan 2001; Dima and Thirumalai 2002) or multiple bead/residue discrete molecular dynamics simulations (Smith and Hall 2001; Ding et al. 2002) to investigate protein aggregation. Simulations with full atomic detail (Ma and Nussinov 2002a,b; Klimov and Thirumalai 2003) have been used to investigate components of the process.
In this work an intermediate resolution model with one bead per residue is used. It is an off-lattice cooperative folding model of the IgG binding B1 domain of protein G developed to study folding (Sorenson and Head-Gordon 1999, 2000, 2002; Brown et al. 2003). This model is free from the explicit inclusion of native-state tertiary fold information in the force field that the Go model possesses—it has specific bead types (hydrophobic, hydrophilic, and neutral) possessing fixed interaction properties. Torsion potentials are chosen to bias, but not fix, the secondary structure to match the crystal structure. While there is no rigid one-to-one mapping between a 20-letter amino acid sequence and the reduced letter code, the fixed bead types make mutations meaningful within the broad classification provided by the three bead flavors. The reduced complexity of the model allows fast simulation of folding and aggregation events and permits the statistics accumulation necessary to calculate ensemble thermodynamic properties.
Two related 56-bead sequences, representing proteins G and L, are taken to be “wild-type” reference points for mutation studies. These sequences are identical up to a reordering of bead types and thus have the same overall hydrophobicity. The torsion potentials responsible for biasing the secondary structure are also identical. Both sequences possess a nearly identical minimum energy folded “native” state. A comparison of the native structures for the two native sequences and the four mutants to be described is provided visually in Figure 1 ▶. The fold reproduces the secondary α/β crystal structure well and the tertiary structure up to the arrangement of the strands. Missing H-bonding interactions mean that the β-sheet is not flat, but rather bundle-like, giving an RMSD of 4.4 Å with respect to the crystal structure (Brown and Head-Gordon 2004). These native sequences were computationally evolved from a generic protein L/G model (Sorenson and Head-Gordon 2000, 2002) to give distinct folding pathways that qualitatively match current experimental knowledge (Brown et al. 2003). During folding, protein G is thought to proceed first through formation of the second β-hairpin while protein L forms the other β-hairpin first (for a complete discussion, see Brown and Head-Gordon 2004). In agreement with experiment, protein G forms a kinetic intermediate and is the slower folder of the two in computational studies.
Figure 1.

Alignment of native structures for the two wild-type sequences and the four mutants shows high structural similarity. Strand and β-hairpin identifiers are shown in top, bottom, and side views. The six corresponding bead sequences are given in terms of hydrophobic (B), hydrophilic (L), and neutral (N) condensed residue types. Mutations from the wild type are shown in red.
The strength and utility of the simple model described above are based on its ability to approximately reproduce the folding process and the hydrophobic driving forces. Because the chemical and shape-related intricacies of the full 20-letter amino acid code are largely missing, dissection of the results at the level of specific bead–bead contacts is avoided. Instead, examination of folding-relating effects and the influences of hydrophobic residue patterning on aggregation are emphasized.
Mutations of the two wild-type sequences were chosen to minimize aggregation under the hypothesis that sequential regions of hydrophobic (attractive) beads promote aggregation. For example, β-strand 3 of wild-type protein G model has an uninterrupted group of four hydrophilic beads (see Fig. 1 ▶). A large collection of both single and double mutations were made, and select sequences giving similar native structures and cooperative folding transitions were retained. All heat capacity curves have only single peaks. The heat capacity curves in Figure 2 ▶ and the temperature denaturation curves in Figure 3 ▶ show the variation in folding transition temperature and cooperativity. Primary mutations were chosen to break up hydrophobic regions by inserting a hydrophilic bead. To maintain the wild-type hydrophobicity, secondary mutations were made to change hydrophobic beads to hydrophilic and were chosen to give native-state energies similar to their wild-type precursors. Both primary and secondary mutations were made in strand regions to outward-facing beads forming relatively few contacts in the native state.
Figure 2.

Heat capacity curves for the wild-type protein G and L models and for their mutants.
Figure 3.

Temperature denaturation curves for the wild-type protein G and L models and for their mutants.
Simulation conditions
The simulation protocol is chosen to minimize competition between folding and aggregation by pre-equilibrating the chains prior to allowing aggregation. The simulation box size is chosen to give a concentration of 100 mg/mL assuming the molecular weight of protein L. This concentration is substantially higher than most experiments, but lower than the 200–300 mg/mL of protein present in cells (Ellis 2001; Minton 2001). All runs were performed at the structure-based folding temperature (TχF) defined such that folded and unfolded states (see Materials and Methods for formal definition) are equally populated. The relationship between the thermodynamic and structural folding temperatures is shown in Figure 4 ▶ for the case where they are most separated. Klimov and Thirumalai have also used two temperature measures of folding progression, but their definitions are different (Klimov and Thirumalai 1998). The temperature at maximum heat capacity (Cv) is termed the thermodynamic folding temperature here rather than the “collapse temperature” because much of the collapse occurs at higher temperatures for these models (see Rg in Fig. 4 ▶). This observation is consistent with lattice-model studies of protein folding (Dinner et al. 1999). Under these conditions, each wild-type or mutant sequence has the same degree of structural similarity to its native state. Furthermore, the state of each different chain type is comparable because the native states are nearly identical, as shown in Figure 1 ▶.
Figure 4.

Comparison of the structural (TχF) and thermodynamic (T Cv F ) measures of the folding temperature for the wild-type protein G model. The shifted radius of gyration (Rg) information is plotted on the same temperature scale to show that it begins to decay well above both folding temperatures.
Chains are said to be “aggregated” when they achieve an average of at least 50 interchain contacts for one million timesteps. Monitoring of interchain contacts during individual runs shows fluctuations from zero to the low to mid- 10’s, then a sustained plateau of at least 50 contacts. For comparison, the probability of chains separating once they have reached 50 contacts is about an order of magnitude lower than after 20 contacts. The duration of one million timesteps ensures that the trajectory is committed to the aggregated state basin. All other states possessing interchain contacts are termed “associated.” The single-chain specific force field and run details can be found in previous publications (Sorenson and Head-Gordon 1999, 2000, 2002; Brown et al. 2003). Modifications to allow simulations of multiple chains are given in Materials and Methods.
Single-chain determinants of aggregation
All mutants aggregate more slowly than their respective wild-type analogs. Mean times to aggregation for each wild-type sequence and important single-chain properties are given in Table 1. Aggregation times are two to 19 times slower than folding times. The success of the heuristics used to pick the mutations suggests that breaking up hydrophobic clusters in the sequences can inhibit aggregation. However, it should be noted that neglect of other interaction types, such as hydrogen bonding and polar electrostatics in the model, may overemphasize the importance of hydrophobic effects.
Table 1.
Comparison of mean aggregation times and important single-chain properties
| Changes of folding (Δ) | |||||||||
| Agg. time (τ) | Enative | Fold time (τ) | TχF | TCvF | TCvF −TχF | ΔA (TCvF) | ΔT (Cv) | ΔT (Pnat) | |
| wt G | 1.9 × 10⁴ | −28.8 | 8.1 × 10³ | 0.41 | 0.51 | 0.10 | 2.06 | 0.24 | 0.20 |
| G1 | 4.9 × 10⁴ | −24.5 | 5.2 × 10³ | 0.40 | 0.46 | 0.06 | 1.02 | 0.12 | 0.16 |
| G2 | 3.3 × 10⁴ | −28.5 | 1.3 × 10⁴ | 0.44 | 0.50 | 0.06 | 1.11 | 0.10 | 0.19 |
| wt L | 3.4 × 10⁴ | −26.9 | 5.5 × 10³ | 0.41 | 0.48 | 0.07 | 1.46 | 0.15 | 0.16 |
| L1 | 6.1 × 10⁴ | −23.1 | 3.1 × 10³ | 0.41 | 0.45 | 0.03 | 0.78 | 0.10 | 0.12 |
| L2 | 4.0 × 10⁴ | −26.8 | 9.2 × 10³ | 0.40 | 0.46 | 0.06 | 1.14 | 0.17 | 0.15 |
Native-state potential energy (Enative) and folding free energy [ΔA (TF Cv)] at the thermodynamic folding temperature are given in units of ɛH/kB. Simulations at alternative temperatures (data not shown) give an estimate for the aggregation time variability of ±0.2 × 10⁴ τ for every 0.01 temperature unit.
The best single-chain determinant appears to be the cooperativity of the folding process. Two measures of folding cooperativity are presented graphically in Figure 5 ▶. The width (in temperature units) of the folding transition measured during temperature denaturation (Fig. 3 ▶) gives one of the best correlations (R2 = 0.86). It is measured from 5% to 95% folded (using the χ definition) in temperature units. A leave-one-out analysis gives a minimum R2 value of 0.70 when the L1 point is omitted. The difference between the thermodynamic and the structural folding temperatures and the Cv peak width at half-height are also measures of co-operativity and determinants of aggregation rate (Table 1) (R2 = 0.87, R2 = 0.51, respectively).
Figure 5.

Correlation between aggregation resistance and folding cooperativity as measured by ΔAfolding at T CvF or ΔTfolding measured from 5% to 95% folded on the temperature denaturation curves.
The free energy change of folding at TCvF (ΔAfolding) is another reasonable correlant (R2 = 0.81) and is related to the temperature difference measures. A leave-one-out analysis gives a minimum R2 value of 0.72 when the wild-type G point is omitted. At the structural folding temperature (TχF), the free energy of folding is zero because the folded and unfolded states as defined are equally populated. Larger temperature difference measures of cooperativity mean that the thermodynamic folding temperature (TCvF ) is farther toward the fully unfolded state. If each chain is assumed to have a similar dependence of folding free energy on temperature, then a chain with a larger temperature difference measure of folding cooperativity will also tend to have a larger free energy of folding at the peak of the Cv curve (TCvF) because the free energy decreases monotonically away from the structural folding temperature. Jiang et al. (2000) have used an estimate of the entropy of folding to design cooperative folders. For the systems studied here, the free energy of folding, of which entropy is a component, appears to be a better correlant.
From a physical perspective, it seems reasonable to assume that high cooperativity means that fewer intermediate states are populated during the folding process. For example, it is known that the protein G model (wt G) has a folding intermediate (Brown and Head-Gordon 2004) and it is the least cooperative folder studied here. The correlation between cooperativity and aggregation resistance is thus compatible with the observation that proteins with folding intermediates tend to aggregate more easily.
Folding time is a poor determinant (Table 1) (R2 = 0.35), as originally expected because the simulation conditions were chosen to minimize folding competition with aggregation. However, the concept of folding cooperativity provides a link between a property that predicts a good folder and one that predicts aggregation resistance. Klimov and Thirumalai (1996) have shown that a difference between folding temperatures, similar to the one used in this work, divided by one of the folding temperatures is a good predictor of folding time. In their work, faster folding lattice-model proteins have lower values of this ratio and can therefore be viewed as more cooperative. It appears that optimizing the cooperativity of a protein leads to both improved folding and aggregation properties.
While stability can be quantified by the thermodynamic folding temperature, it cannot be clearly examined as a correlant here because the runs are at different temperatures. However, aggregation times of chains having similar structural folding temperatures and therefore run temperatures can be compared. If one examines wild-type G, G1, and wild-type L models (see Table 1), there appears to be a tendency for the chain with the highest thermodynamic folding temperature (most stable) to aggregate fastest. This is further support that it is the cooperativity of the folding process that is most important under these conditions.
The most counterintuitive relationship between aggregation time and a single-chain characteristic is the tendency for aggregation-resistant chains to have higher radii of gyration fluctuations. Figure 6 ▶ shows this relationship (R2 = 0.76, min 0.48 without L1). One might expect higher structural fluctuations to open the chain up and promote aggregation. Indeed, chains with such characteristics tend to have greater average hydrophobic exposure (data not shown), but actually aggregate more slowly. The apparent contradiction with experimental results that tie hydrophobicity to faster aggregation (Chiti et al. 2003) can be attributed to comparison of a static quantity derived only from the sequence to one influenced by structural fluctuations. Higher structural fluctuations may simply be related to the run temperatures and the folding cooperativity arguments already suggested. Figure 4 ▶ shows that the radii of gyration fluctuations are highest above the thermodynamic folding temperature (TCvF) and decrease steeply at lower temperatures. For more cooperative folders, the gap between the thermodynamic folding temperature (TCvF) and the run temperature (TχF) is smaller, meaning that from the shape of the curve, one expects more cooperative folders to have higher radii of gyration fluctuations.
Figure 6.

Trends in aggregation time with respect to the radius of gyration fluctuations for single chains and aggregates. For the aggregate, the fluctuations are calculated only during the initial contacts that lead to a final aggregated state.
Two-chain determinants of aggregation
Though less useful as predictors of aggregation propensity, examination of two-chain properties can yield insight into the aggregation process. The system state during formation of the first interchain contacts and the “preaggregate” subset of these states that proceed to form aggregates before the chains separate are particularly important. Contrasting the preaggregate states with others hints at properties that influence aggregation.
During the course of aggregation, each chain type undergoes similar structural changes, suggesting a crude general mechanism. Table 2 gives a progression of aggregate radii of gyration and the native-state similarity (χ) at few interchain contacts, during formation of preaggregate initial contacts, and in the final aggregate. At low interchain contact number, the chains are partially extended and have relatively high similarity to their native states. For the subset of initial association states leading to a final aggregate (preaggregate states), the chains are more extended and have consistently less native-state similarity. The final two-chain aggregates are comparatively collapsed and have minimal single-chain native-state similarity. Pronounced structural expansion and loss of native state contacts before interchain contact formation may be necessary to initiate aggregation.
Table 2.
Comparison of mean aggregation times and two-chain aggregate structural properties during the aggregation process
| Aggregate Rg | Mean chain χ in system | ||||||
| Agg. time (τ) | 1 ≤ Nc≤ 10 | Prea | Final | 1 ≤ Nc ≤ 10 | Prea | Final | |
| wt G | 1.9 × 10⁴ | 4.8 | 5.0 | 3.8 | 0.34 | 0.30 | 0.22 |
| G1 | 4.9 × 10⁴ | 4.9 | 5.2 | 4.2 | 0.34 | 0.27 | 0.20 |
| G2 | 3.3 × 10⁴ | 4.5 | 4.8 | 3.8 | 0.45 | 0.37 | 0.21 |
| wt L | 3.4 × 10⁴ | 5.1 | 5.5 | 5.0 | 0.37 | 0.31 | 0.21 |
| L1 | 6.1 × 10⁴ | 5.2 | 5.7 | 4.9 | 0.34 | 0.26 | 0.20 |
| L2 | 4.0 × 10⁴ | 4.8 | 5.4 | 4.3 | 0.40 | 0.26 | 0.20 |
Nc denotes the number of chain–chain contacts. The radii of gyration for the native states at the run temperature are 2.75 to 2.88 in reduced units (σ).
a Initial association leading to aggregation before separation of the chains.
The preaggregate initial association states can be expected to have important properties, such as transition-state-like character. They have substantially higher energies (6–12 kBT ) than initial association states that do not lead to aggregation, meaning that they have fewer intrachain contacts and in many cases are more open structurally. An attempt to estimate a pseudoactivation energy barrier by subtracting average preassociation potential energies from energies during preaggregate initial association gives estimates between 7 and 16ɛH. High pseudoactivation energies are clearly associated with aggregation resistance as shown in Figure 7 ▶.
Figure 7.

Two-chain systems with higher pseudoactivation energy barriers resist aggregation. The barrier estimate is calculated by subtracting the average system energy without interchain contacts from that during formation of initial contacts leading directly to aggregates. A best-fit line is shown as a guide to the eye and is not intended to suggest a linear relationship.
A comparison between the aggregate and single-chain radius of aggregation fluctuation correlations reveals strikingly opposite trends. The best yet still poor correlation (R2 = 0.42) between aggregate structural fluctuations and aggregation time is at the preaggregate initial association stage; this is shown in Figure 6 ▶. Fast-aggregating chains have high fluctuations in their preaggregate initial association states but comparatively low single-chain fluctuations.
Together the properties of the preaggregate states imply that chains must come together with a more extended and less native-state character in order to proceed to an aggregated state. The large differences in the activation energy estimate suggest that the chain sequence can play an important role in defining the properties of the preaggregate complex. Large structural fluctuations may be necessary to allow easy formation of the final aggregate or may simply be a characteristic of complexes that aggregate more quickly.
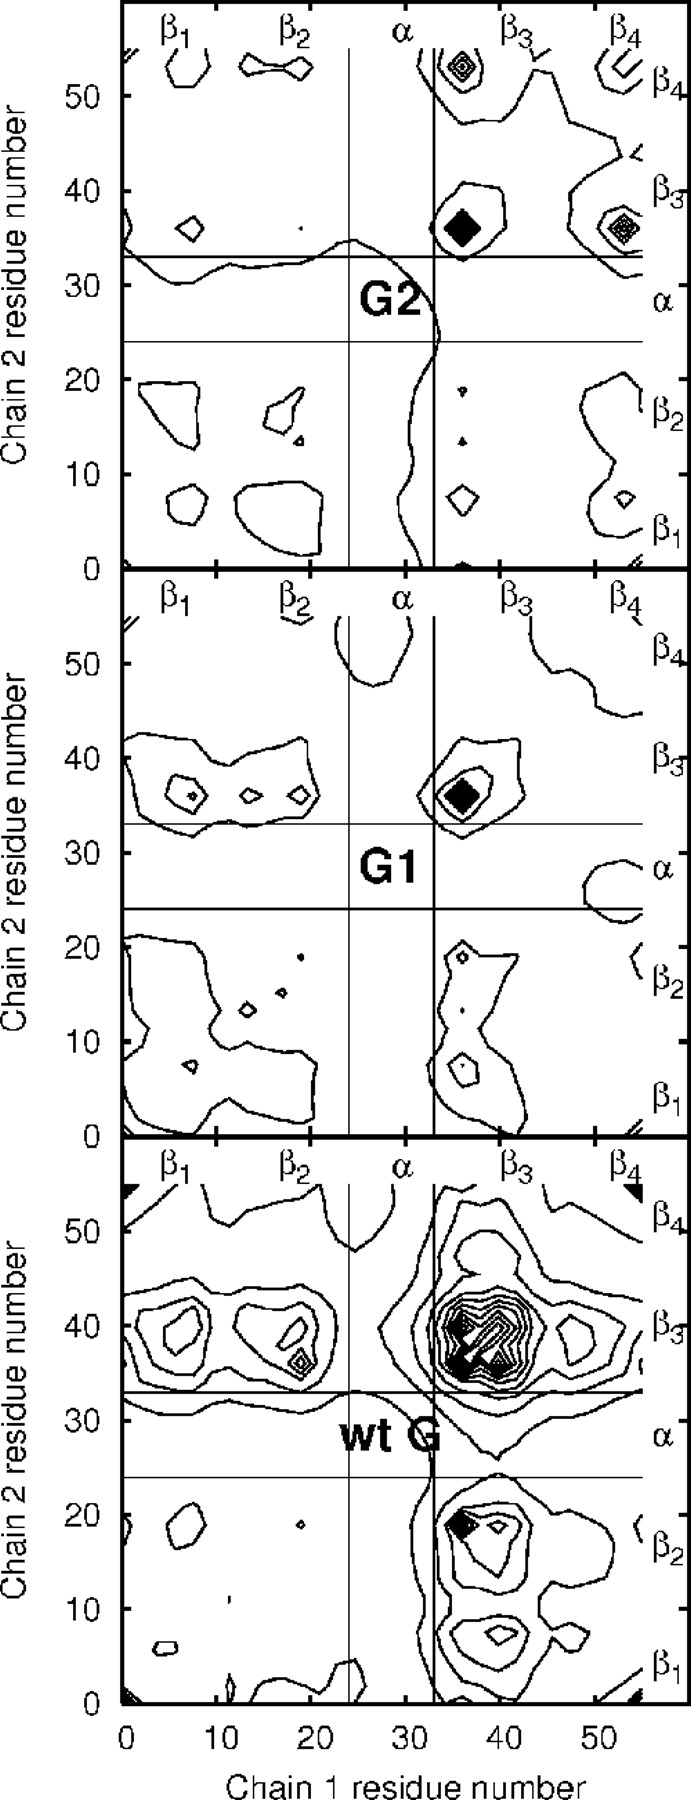
Examination of the aggregate structures yields little consistency even within aggregates of a single-chain type. The average contact maps for the aggregates are shown in Figures 8 ▶ and 9 ▶. If the contact maps are filtered by zeroing all contact pairs with average values lower than their standard deviations, all features except the stand3–strand3 peak in the protein G-type chains disappear. Attempts to find single structures with contact maps qualitatively matching all the features of the average contact map met with limited success. Two wild-type sequence aggregate structures are shown in Figure 10 ▶ as examples. The only constant factor appears to be the clustering of strands with high hydrophobicity. It is possible to find persistent states with contact patterns not found in the aggregate during single run trajectories, suggesting that metastable, off-pathway states may play a role in the aggregation process. Average contact patterns for initial association and preaggregate initial association states show no features not present in the aggregate state.
Figure 8.
A comparison of aggregate contact map contours for protein L type models shows that contacts are dominated by the most hydrophobic strands (2 and 4) and are largely unchanged by the mutations. The black-bordered bands contain contacts to the helical portions of the chains, which are comparatively sparse.
Figure 9.

A comparison of aggregate contact map contours for protein G type models shows that contacts are dominated by the most hydrophobic strand (3) and are largely unchanged by the mutations. The black-bordered bands contain contacts to the helical portions of the chains, which are comparatively sparse.
Figure 10.
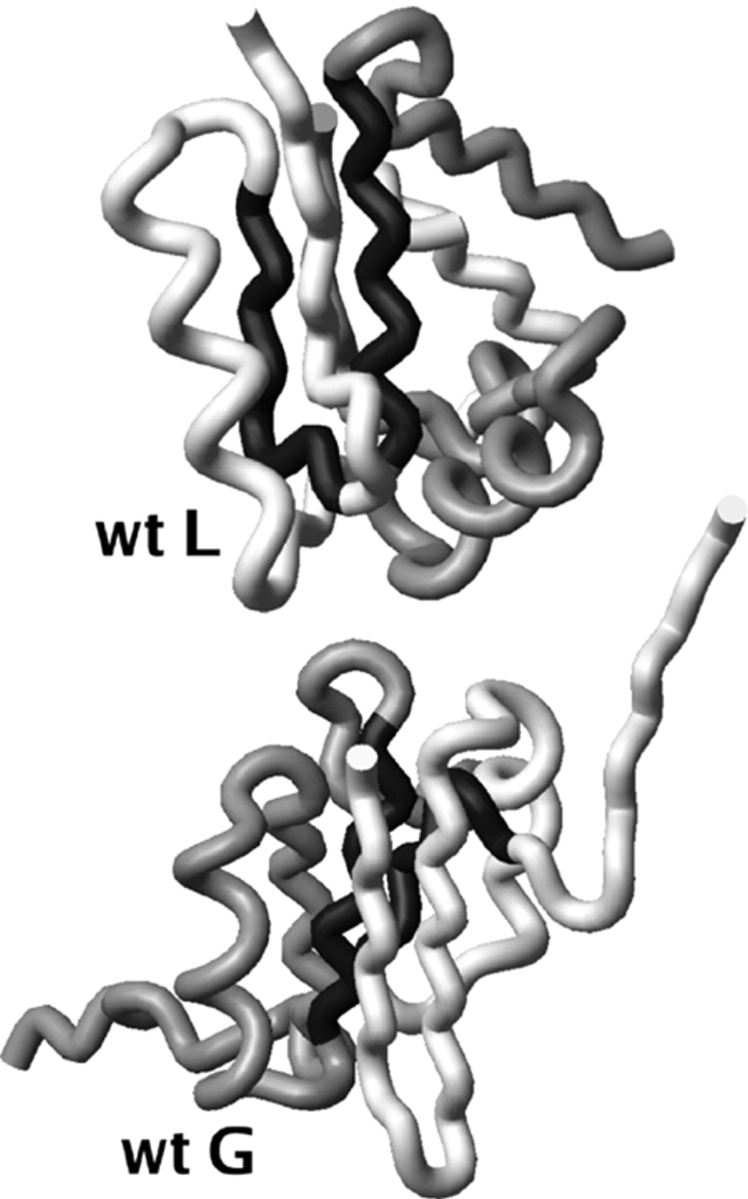
Representative two-chain aggregate structures for wild-type protein L (wt L) and wild-type protein G (wt G). The most hydrophobic strands (strand 2 in wt G, strand 3 in wt L) from the gray and white chains are colored in black to highlight their placement in the core of the aggregate.
It is possible that aggregates with more than two chains will have more regular structure. Formation of multichain aggregates may require a consistent association mechanism, such as the interchain β-sheet formation seen in amyloid fibers (Harrison et al. 2001). Transitions from α-helical to β-sheet structures have been observed experimentally after oligomer formation (Nettleton et al. 2000; Kirkitadze et al. 2001), suggesting that a critical mass of chains is needed before ordered aggregates form.
The interchain contact number distributions for the slowest aggregating chains suggest strategies for designing aggregation-resistant proteins. Figure 11 ▶ shows that in all cases the mutants shift the contact number distributions to lower values. Destabilizing the aggregate by making large numbers of interchain contacts more improbable is one way to minimize aggregation. The bimodal distributions suggest a distinction between associated and aggregated states and perhaps the presence of a barrier. Mutations, especially to the G-like sequence, tend to result in favoring the associated-only portion of the distribution. Another strategy for disfavoring the final progression to an “aggregated” state would be to design sequences to form associated states with high barriers to conversion into aggregated states. Associated chains would then be more likely to dissociate and independently fold.
Figure 11.

A comparison of the interchain contacts ( Nc) during the course of the aggregation runs. All mutants shift the average number of contacts to lower numbers and help to reduce the aggregate stability, preventing aggregation. Note that the distributions are not from equilibrium ensembles but were accumulated during the kinetics runs.
In the literature, there is speculation on the importance of domain swapping in the formation of aggregates. Domain swapping refers to the formation of interchain contacts that are identical to native intrachain contacts (Bennett et al. 1995). At least 20 domain-swapped dimer structures have been identified (Janowski et al. 2001), and it has been proposed that a similar mechanism could lead to multimers (Liu et al. 2001). Domain swapping has been identified in crystal structures of protein L dimers (O’Neill et al. 2001). In the simulations described here, threshold filtering of the average contact maps is used to reduce them to maps with a number of contacts equal to that in the native-state structure. Comparison with the native contact map then indicates that a fairly minimal 14% to 28% of contacts can be considered domain-swapped, depending on the sequence. It is possible that a more detailed model, such as one with highly specific interactions, would favor creation of native-like interchain contacts rather than more disordered contacts. Ding et al. (2002) observed domain-swapped dimers, but did not see propagational domain swapping in their simulations of the SH3 domain.
Conclusions
Use of a simplified protein model allows direct simulation of folding and two-chain aggregation processes. Six 56-bead sequences that all fold to highly similar native structures display mean times to aggregation that vary by almost a factor of 3. Within the constraints imposed by the realism of the model, a number of biophysical insights into the aggregation process can be gained.
Folding cooperativity is identified as a good single-chain determinant of aggregation time. Physically, lower cooperativity means a greater population of states that are neither folded nor unfolded during the folding transition. This is in agreement with the widely accepted idea that proteins with folding intermediates tend to aggregate more easily. Measures of folding cooperativity are the temperature width of the folding transition or the free energy of folding at the temperature where the heat capacity is maximum. The temperature width of the folding transition can be calculated from thermal denaturation experiments with sufficient definition. Measurements of aggregation rate on single mutants covering a range of cooperativities could be done to test this relationship.
Some properties of the two-chain aggregates are also good determinants of the aggregation time. It appears that the structure of the chains during initial association determines how likely they are to form final aggregates. Associated chains that progress to aggregates have significantly higher potential energies than average, form more extended complexes, and are composed of chains with less native-state similarity. Chains with sequences that must go through higher potential energy association states to aggregate do so more slowly, as one would expect from a transition-state-type model.
Within the limitations of the single-fold topology and the simple model, these findings increase understanding of the aggregation process and, most importantly, suggest possibilities for sequence design. Patterning of exposed residues appears to be very important because it controls the formation of initial contacts. Even the hydrophobic residue distribution alone is important, because those sequences that conserve overall hydrophobicity (four of the six studied) display diverse aggregation behavior. Breaking linear clusters of hydrophobic residues improves aggregation resistance. This agrees with simulations of Istrail et al. (1999) using a lattice model. Similarly, Broome and Hecht (2000) noted that nature avoids alternating patterns of hydrophilic and hydrophobic residues because they may promote aggregation. Patterning is also important in determining what type of aggregates can form and how many interchain contacts they can achieve.
Further work could explore the correlation between cooperativity and aggregation time for a wider range of topologies, model representations, and, most importantly, using experimental data. Exploration of temperature effects may also prove fruitful. Ding et al. (2002) noted a maximum aggregation rate at the folding temperature using a different type of model. It will be interesting to see if this holds for all systems and if temperature manipulations can be used to favor folding versus aggregation.
Materials and methods
In comparison with the single-chain case, simulation of multiple chains requires some modifications to deal with interchain interactions and concentration effects. Interchain interactions are handled in the simplest manner, by using the same set of bead–bead interactions that is used for intrachain interactions. In contrast to the Gō model, no additional assumptions are needed.
The degree of folding or ordering with respect to the minimum energy native state is measured using an order parameter designed to compare internal pairwise distances to those in the native state.
 |
(1) |
where rij is a pairwise distance, N is the number of bead pairs, h denotes the Heaviside function, and M is a normalization factor set to give χ= 1.0 for the native state. For χ-values >0.40, the protein is considered folded.
All simulations reported here are performed in reduced units with the basic units of mass (m), length (σ), energy (ɛH), and Boltzmann’s constant (kB) all set equal to 1. One length unit (σ) is equivalent to the length of a bead–bead bond and is taken to be 3.8 Å in nonreduced units. The energy, −ɛH, corresponds to the most attractive potential energy of interaction between two hydrophobic beads. Under this representation, temperature has units of ɛH/kB and time (τ) has units of
 |
One timestep is 0.005 τ.
Concentration effects are handled using the standard periodic boundary condition method (Allen and Tildesley 1987). The box size is chosen to be a cube with sides of 16.0 length units to give an approximate concentration of 100 mg/mL of protein L. At this box size, self-interaction of a chain with its image cannot be excluded. However, visualization of trajectories suggests that this is rare and likely similar to normal interactions with the environment at high concentration. The interaction cutoff is set at one-half of the box length (8.0 length units). At this cutoff the attractive interactions have decayed to lower than 1/100 of their well depth.
In order to calculate certain aggregate properties, such as radius of gyration, or to visualize aggregates, it is necessary to have a coordinate representation free of periodic boundary conditions. The coordinates free from periodic boundary mappings that are accumulated during dynamics runs are inadequate because they typically do not place the chains in physical contact. The problem is solved in an approximate and nonunique fashion by finding a single periodic mapping for each chain that puts their centers of mass as close together as possible. The result is a system coordinate set that typically produces a structure containing interchain contacts and interactions similar to those calculated from the minimum image convention.
Aggregation kinetics was determined using Langevin dynamics simulations in the low-friction limit. For each run, two chains are equilibrated without interchain attractions at the structural folding temperature (TχF), then these attractions are turned on and run statistics are accumulated. Initial configurations possessing interchain contacts were thrown out. In the absence of attractive interactions with the other chain, the chains would have no predisposition to change their degree of folding on average. Between 200 and 500 runs were done for a maximum of 20 million timesteps each and the resulting probability distributions were smoothed at longer times linearly to zero before averages were taken. Error bar estimates for the aggregation times are the standard deviations obtained from splitting the data into four parts.
Thermodynamic quantities are calculated directly from the densities of states obtained using the multihistogram method (Ferrenberg and Swendsen 1988; Ferguson and Garrett 1999). The same information was used to create the heat capacity and temperature denaturation curves. Average potential energies are calculated using the standard statistical thermodynamical expression for an expectation value. Helmholtz free energies are calculated from the temperature and the logarithm of the configurational partition function. Identification of folded structures (using the χ definition) allows the density to be split into folded and unfolded portions and a folding difference of any thermodynamic quantity to be obtained at a given temperature. Folding entropy is calculated from the definition of the Helmholtz free energy (ΔA = ΔU − TΔS).
Acknowledgments
I appreciate the computational resources provided by Biogen Idec, Inc., used to finish this work. The work was begun at the University of California, Berkeley, in the group of T. Head-Gordon. Insightful comments from Scott Brown, Troy Cellmer, Nicolas Fawzi, and Herman van Vlijmen are also appreciated.
Article published online ahead of print. Article and publication date are at http://www.proteinscience.org/cgi/doi/10.1110/ps.041017305.
References
- Allen, M.P. and Tildesley, D.J. 1987. Computer simulation of liquids. Clarendon Press, Oxford.
- Bennett, M.J., Schlunegger, M.P., and Eisenberg, D. 1995. 3D domain swapping—A mechanism for oligomer assembly. Protein Sci. 4 2455–2468. [DOI] [PMC free article] [PubMed] [Google Scholar]
- Bratko, D. and Blanch, H.W. 2001. Competition between protein folding and aggregation: A three-dimensional lattice-model simulation. J. Chem. Phys. 114 561–569. [Google Scholar]
- ———. 2003. On-lattice modeling of protein aggregation: The effect of secondary structure. J. Chem. Phys. 118 5185–5194. [Google Scholar]
- Broglia, R.A., Tiana, G., Pasquali, S., Roman, H.E., and Vigezzi, E. 1998. Folding and aggregation of designed proteins. Proc. Natl. Acad. Sci. 95 12930–12933. [DOI] [PMC free article] [PubMed] [Google Scholar]
- Broome, B.M. and Hecht, M.H. 2000. Nature disfavors sequences of alternating polar and non-polar amino acids: Implications for amyloidogenesis. J. Mol. Biol. 296 961–968. [DOI] [PubMed] [Google Scholar]
- Brown, S. and Head-Gordon, T. 2004. Intermediates and the folding of proteins L and G. Protein Sci. 13 958–970. [DOI] [PMC free article] [PubMed] [Google Scholar]
- Brown, S., Fawzi, N.J., and Head-Gordon, T. 2003. Coarse-grained sequences for protein folding and design. Proc. Natl. Acad. Sci. 100 10712–10717. [DOI] [PMC free article] [PubMed] [Google Scholar]
- Bucciantini, M., Giannoni, E., Chiti, F., Baroni, F., Formigli, L., Zurdo, J.S., Taddei, N., Ramponi, G., Dobson, C.M., and Stefani, M. 2002. Inherent toxicity of aggregates implies a common mechanism for protein misfolding diseases. Nature 416 507–511. [DOI] [PubMed] [Google Scholar]
- Chi, E.Y., Krishnan, S., Randolph, T.W., and Carpenter, J.F. 2003. Physical stability of proteins in aqueous solution: Mechanism and driving forces in nonnative protein aggregation. Pharmaceutical Res. 20 1325–1336. [DOI] [PubMed] [Google Scholar]
- Chiti, F., Taddei, N., Baroni, F., Capanni, C., Stefani, M., Ramponi, G., and Dobson, C.M. 2002. Kinetic partitioning of protein folding and aggregation. Nat. Struct. Biol. 9 137–143. [DOI] [PubMed] [Google Scholar]
- Chiti, F., Stefani, M., Taddei, N., Ramponi, G., and Dobson, C.M. 2003. Rationalization of the effects of mutations on peptide and protein aggregation rates. Nature 424 805–808. [DOI] [PubMed] [Google Scholar]
- Clark, E.D. 2001. Protein refolding for industrial processes. Curr. Opin. Struct. Biol. 12 202–207. [DOI] [PubMed] [Google Scholar]
- Dima, R.I. and Thirumalai, D. 2002. Exploring protein aggregation and self-propagation using lattice models: Phase diagram and kinetics. Protein Sci. 11 1036–1049. [DOI] [PMC free article] [PubMed] [Google Scholar]
- Ding, F., Dokholyan, N.V., Buldyrev, S.V., Stanley, H.E., and Shakhnovich, E.I. 2002. Molecular dynamics simulation of the SH3 domain aggregation suggests a generic amyloidogenesis mechanism. J. Mol. Biol. 324 851–857. [DOI] [PubMed] [Google Scholar]
- Dinner, A.R., Abkevich, V., Shakhnovich, E., and Karplus, M. 1999. Factors that affect the folding ability of proteins. Proteins 35 34–40. [DOI] [PubMed] [Google Scholar]
- Dobson, C.M. 2001. The structural basis of protein folding and its links with human disease. Phil. Trans. R. Soc. Lond. B 356 133–145. [DOI] [PMC free article] [PubMed] [Google Scholar]
- Ellis, R.J. 2001. Macromolecular crowding: An important but neglected aspect of the intracellular environment. Curr. Opin. Struct. Biol. 11 114–119. [DOI] [PubMed] [Google Scholar]
- Ferguson, D.M. and Garrett, D.G. 1999. Simulated annealing—Optimal histogram methods. In Advances in chemical physics, Monte Carlo methods in chemical physics (eds. D.M. Ferguson et al.), Vol. 105, pp. 311–335. John Wiley, New York.
- Ferrenberg, A.M. and Swendsen, R.H. 1988. New Monte Carlo technique for studying phase transitions. Phys. Rev. Lett. 61 2635–2638. [DOI] [PubMed] [Google Scholar]
- Fink, A.L. 1998. Protein aggregation: Folding aggregates, inclusion bodies and amyloid. Fold. Des. 3 R9–R23. [DOI] [PubMed] [Google Scholar]
- Hammarstrom, P., Wiseman, R.L., Powers, E.T., and Kelly, J.W. 2003. Prevention of transthyretin amyloid disease by changing protein misfolding energetics. Science 299 713–716. [DOI] [PubMed] [Google Scholar]
- Harrison, P.M., Chan, H.S., Prusiner, S.B., and Cohen, F.E. 1999. Thermodynamics of model prions and its implications for the problem of prion protein folding. J. Mol. Biol. 286 593–606. [DOI] [PubMed] [Google Scholar]
- Harrison, P.M., Chan, H.S., Prusiner, S.B., and Cohen, F.E. 2001. Conformational propagation with prion-like characteristics in a simple model of protein folding. Protein Sci. 10 819–835. [DOI] [PMC free article] [PubMed] [Google Scholar]
- Horwich, A. 2002. Protein aggregation in disease: A role for folding intermediates forming specific multimeric interactions. J. Clin. Invest. 110 1221–1232. [DOI] [PMC free article] [PubMed] [Google Scholar]
- Hurle, M.R., Helms, L.R., Li, L., Chan, W.N., and Wetzel, R. 1994. A role for destabilizing amino-acid replacements in light-chain amyloidosis. Proc. Natl. Acad. Sci. 91 5446–5450. [DOI] [PMC free article] [PubMed] [Google Scholar]
- Istrail, S., Schwartz, R., and King, J. 1999. Lattice simulations of aggregation funnels for protein folding. J. Comp. Biol. 6 143–162. [DOI] [PubMed] [Google Scholar]
- Janowski, R., Kozak, M., Jankowska, E., Grzonka, Z., Grubb, A., Abrahamson, M., and Jaskolski, M. 2001. Human cystatin c, an amyloidogenic protein, dimerizes through three-dimensional domain swapping. Nat. Struct. Biol. 8 316–320. [DOI] [PubMed] [Google Scholar]
- Jiang, X., Farid, H., Pistor, E., and Farid, R.S. 2000. A new approach to the design of uniquely folded thermally stable proteins. Protein Sci. 9 403–416. [DOI] [PMC free article] [PubMed] [Google Scholar]
- Kayed, R., Head, E., Thompson, J.L., Mcintire, T.M., Milton, S.C., Cotman, C.W., and Glabe, C.G. 2003. Common structure of soluble amyloid oligomers implies common mechanism of pathogenesis. Science 300 486–489. [DOI] [PubMed] [Google Scholar]
- Kelly, J.W. 2000. Mechanisms of amyloidogenesis. Nat. Struct. Biol. 7 824–826. [DOI] [PubMed] [Google Scholar]
- Kirkitadze, M.D., Condron, M.M., and Teplow, D.B. 2001. Identification and characterization of key kinetic intermediates in amyloid β-protein fibrillogenesis. J. Mol. Biol. 312 1103–1119. [DOI] [PubMed] [Google Scholar]
- Klimov, D.K. and Thirumalai, D. 1996. Criterion that determines the foldability of proteins. Phys. Rev. Lett. 76 4070–4073. [DOI] [PubMed] [Google Scholar]
- ———. 1998. Cooperativity in protein folding: From lattice models with sidechains to real proteins. Fold. Des. 3 127–139. [DOI] [PubMed] [Google Scholar]
- ———. 2003. Dissecting the assembly of Aβ (16–22) amyloid peptides into antiparallel β sheets. Structure 11 295–307. [DOI] [PubMed] [Google Scholar]
- Liu, K., Cho, H.S., Lashuel, H.A., Kelly, J.W., and Wemmer, D.E. 2000. A glimpse of a possible amyloidogenic intermediate of transthyretin. Nat. Struct. Biol. 7 754–757. [DOI] [PubMed] [Google Scholar]
- Liu, Y.S., Gotte, G., Libonati, M., and Eisenberg, D. 2001. A domain-swapped RNase a dimer with implications for amyloid formation. Nat. Struct. Biol. 8 211–214. [DOI] [PubMed] [Google Scholar]
- Lomakin, A., Chung, D.S., Benedek, G.B., Kirschner, D.A., and Teplow, D.B. 1996. On the nucleation and growth of amyloid β-protein fibrils: Detection of nuclei and quantitation of rate constants. Proc. Natl. Acad. Sci. 93 1125–1129. [DOI] [PMC free article] [PubMed] [Google Scholar]
- Ma, B.Y. and Nussinov, R. 2002a. Stabilities and conformations of Alzheimer’s β-amyloid peptide oligomers (Aβ 16–22, Aβ 16–35, and Aβ 10–35): Sequence effects. Proc. Natl. Acad. Sci. 99 14126–14131. [DOI] [PMC free article] [PubMed] [Google Scholar]
- ———. 2002b. Molecular dynamics simulations of alanine rich β-sheet oligomers: Insight into amyloid formation. Protein Sci. 11 2335–2350. [DOI] [PMC free article] [PubMed] [Google Scholar]
- Minton, A.P. 2001. The influence of macromolecular crowding and macromolecular confinement on biochemical reactions in physiological media. J. Biol. Chem. 276 10577–10580. [DOI] [PubMed] [Google Scholar]
- Monti, M., Garolla di Bard, B.L., Calloni, G., Chiti, F., Amoresano, A., Ramponi, G., and Pucci, P. 2004. The regions of the sequence most exposed to the solvent within the amyloidogenic state of a protein initiate the aggregation process. J. Mol. Biol. 336 253–262. [DOI] [PubMed] [Google Scholar]
- Nettleton, E.J., Tito, P., Sunde, M., Bouchard, M., Dobson, C.M., and Robinson, C.V. 2000. Characterization of the oligomeric states of insulin in self-assembly and amyloid fibril formation by mass spectrometry. Biophys. J. 79 1053–1065. [DOI] [PMC free article] [PubMed] [Google Scholar]
- Olofsson, A., Ostman, J., and Lundgren, E. 2002. Amyloid: Morphology and toxicity. Clin. Chem. Lab. Med. 40 1266–1270. [DOI] [PubMed] [Google Scholar]
- O’Neill, J.W., Kim, D.E., Johnsen, K., Baker, D., and Zhang, K.Y.J. 2001. Single-site mutations induce 3D domain swapping in the B1 domain of protein l from Peptostreptococcus magnus. Structure 9 1017–1027. [DOI] [PubMed] [Google Scholar]
- Roberts, C.J. 2003. Kinetics of irreversible protein aggregation: Analysis of extended Lumry-Eyring models and implications for predicting protein shelf life. J. Phys. Chem. B 107 1194–1207. [Google Scholar]
- Selkoe, D.J. 2003. Folding proteins in fatal ways. Nature 426 900–904. [DOI] [PubMed] [Google Scholar]
- Shimizu, S. and Chan, H.S. 2001. Statistical mechanics of solvophobic aggregation: Additive and cooperative effects. J. Chem. Phys. 115 3424–3431. [Google Scholar]
- Smith, A.V. and Hall, C.K. 2001. Protein refolding versus aggregation: Computer simulations on an intermediate-resolution protein model. J. Mol. Biol. 312 187–202. [DOI] [PubMed] [Google Scholar]
- Sorenson, J.M. and Head-Gordon, T. 1999. Redesigning the hydrophobic core of a model β-sheet protein: Destabilizing traps through a threading approach. Proteins 37 582–591. [DOI] [PubMed] [Google Scholar]
- ———. 2000. Matching simulation and experiment: A new simplified model for simulating protein folding. J. Comp. Biol. 7 3–4. [DOI] [PubMed] [Google Scholar]
- ———. 2002. Protein engineering study of protein l by simulation. J. Comp. Biol. 9 35–54. [DOI] [PubMed] [Google Scholar]
- Speed, M.A., Morshead, T., Wang, D.I., and King, J. 1997. Conformation of P22 tailspike folding and aggregation intermediates probed by monoclonal antibodies. Protein Sci. 6 99–108. [DOI] [PMC free article] [PubMed] [Google Scholar]
- Tartaglia, G.G., Cavalli, A., Pellarin, R., and Caflisch, A. 2004. The role of aromaticity, exposed surface, and dipole moment in determining protein aggregation rates. Protein Sci. 7 1939–1941. [DOI] [PMC free article] [PubMed] [Google Scholar]
- Thirumalai, D., Klimov, D.K., and Dima, R.I. 2003. Emerging ideas on the molecular basis of protein and peptide aggregation. Curr. Opin. Struct. Biol. 13 146–159. [DOI] [PubMed] [Google Scholar]
- Walsh, D.M., Klyubin, I., Fadeeva, J.V., Cullen, W.K., Anwyl, R., Wolfe, M.S., Rowan, M.J., and Selkoe, D.J. 2002. Naturally secreted oligomers of amyloid β protein potently inhibit hippocampal long-term potentiation in vivo. Nature 416 535–539. [DOI] [PubMed] [Google Scholar]