

Abstract
Recent years have seen the publication of both empirical and theoretical relationships predicting the rates with which proteins fold. Our ability to test and refine these relationships has been limited, however, by a variety of difficulties associated with the comparison of folding and unfolding rates, thermodynamics, and structure across diverse sets of proteins. These difficulties include the wide, potentially confounding range of experimental conditions and methods employed to date and the difficulty of obtaining correct and complete sequence and structural details for the characterized constructs. The lack of a single approach to data analysis and error estimation, or even of a common set of units and reporting standards, further hinders comparative studies of folding. In an effort to overcome these problems, we define here a “consensus” set of experimental conditions (25°C at pH 7.0, 50 mM buffer), data analysis methods, and data reporting standards that we hope will provide a benchmark for experimental studies. We take the first step in this initiative by describing the folding kinetics of 30 apparently two-state proteins or protein domains under the consensus conditions. The goal of our efforts is to set uniform standards for the experimental community and to initiate an accumulating, self-consistent data set that will aid ongoing efforts to understand the folding process.
Keywords: two-state, protein folding, kinetics, chevron plots, equilibrium
The folding kinetics of dozens of proteins have been reported to date (e.g., Jackson 1998). The conditions under which these data were obtained, however, vary widely in terms of temperature (e.g., reference temperatures ranging from 10°C–41°C) (Ferguson et al. 1999; Spector and Raleigh 1999), pH, ionic strength, and data reduction methods. Similarly, the relevant raw kinetic data are rarely made available, and the relevant structural data for the characterized construct are often difficult to obtain unambiguously. As a consequence, no systematic, fully detailed database is available with which to define and develop quantitative, testable models of folding kinetics. In an effort to overcome this problem, we describe here a set of experimental conditions, data analysis methods, and reporting standards that we hope will provide a benchmark for the experimental folding community. We argue strongly for the adoption of a standard reference temperature of 25°C, and on the prominent, clear, and complete reporting of other conditions (pH, denaturant, experimental approach, etc.). We place equal importance on the availability of raw kinetic data and on providing the sequence and structural information required for a complete description of the characterized construct.
In the following sections, we describe “consensus” conditions, fitting algorithms, error estimation methods, and structural data that we believe represent the minimum complete description of any new experimental folding system. Lastly, we describe the folding of some 30 apparently two-state single-domain proteins or isolated protein domains, the folding kinetics of seven of which have not previously been reported, under the herein recommended conditions.
Standard conditions
Protein folding rates are sensitive to a wide variety of environmental conditions, including temperature, pH, buffer, ionic strength, and the concentration and nature of any residual denaturant. Here we propose standard values for each of these parameters, and we encourage researchers in the field to use these values whenever possible. Naturally, if for some proteins the adoption of one of the standards significantly complicates the experimentalist’s task, departure from these conditions is reasonable. Excluding temperature, for which we believe that reporting values at the consensus temperature is very strongly preferred, we believe it is more important to report the conditions employed as prominently and fully as the results themselves than to adhere to these necessarily somewhat arbitrary standards. Instead we offer these consensus conditions in the hope that they will be employed whenever possible, so as to reduce the number of variables contributing to the available kinetic data and thus simplify the comparison of folding data obtained by different laboratories.
Temperature
Protein folding rates display a strong dependence on temperature. Folding reactions commonly exhibit activation enthalpies of 10–20 kJ/mol (e.g., Jackson and Fersht 1991b; Plaxco et al. 1998a; Main et al. 1999), corresponding to a temperature sensitivity of ∼1.5%–3% per degree Celsius. We thus strongly encourage researchers in the field to report the folding kinetics observed at a single consensus temperature. Arguments can be made for consensus temperature as low as 10°C, where rates are slower and there are fewer artifacts associated with cavitation and degassing, and as high as 37°C, which is at or near the physiological temperature of mammals, birds, and many experimentally important prokaryotes. The present investigators have agreed on a compromise experimental temperature of 25°C based on three arguments: First, 25°C is slightly above room temperature and thus easily maintained via thermostatically controlled heating. Second, these conditions are far enough above the freezing point that they are an acceptable endpoint for most temperature-jump approaches. Third, 25°C is the most commonly employed temperature in the previous folding literature and is near the second most commonly employed temperature, 22°C; the forward adoption of this standard thus maximizes backward compatibility with the literature. We thus strongly recommend that folding kinetic studies report rates measured at 25°C whenever possible.
Chemical denaturants
In the majority of folding kinetics experiments, chemical denaturants—typically urea or guanidinium salts—are employed to destabilize the native state. Rates are then measured in the presence of varying amounts of these denaturants. Because ionic strength is a potentially confounding variable and linear extrapolation is generally less applicable to guanidinium salts (Makhatadze 1999), we recommend urea as a denaturant. However, since many small proteins do not unfold in saturated urea solutions at 25°C, an alternative denaturant, such as guanidinium chloride or guanidinium thiocyanate, may be required. Where the use of guanidinium salts is known to complicate the analysis of folding kinetics because of ionic strength effects, simultaneous pH- and urea concentration–jump techniques should be employed (Went et al. 2004). The precise mode of denaturation should be identified as prominently as the experimental results themselves.
Solvent conditions
Folding rates are sensitive to solvent conditions, such as pH, buffer composition, and ionic strength, and thus a consensus set of solvent conditions would be helpful for purposes of comparing results obtained from different laboratories. Identifying a single set of conditions suitable for the characterization of all proteins, however, is not possible. For example, whereas pH 7.0 has been widely employed in the previous literature, is not suitable for some experiments (e.g., some hydrogen exchange experiments) and some proteins (e.g., those that are poorly soluble at neutral pH). Nevertheless, in an effort to reduce unnecessary complexity in interlaboratory comparisons and maximize backward compatibility with the literature, we recommend that pH 7.0 buffers be employed as a standard unless otherwise justified. It is similarly difficult to recommend a single buffer that is universally applicable to all protein folding experiments. We suggest, however, that 50 mM phosphate (although its pKa is somewhat ionic strength dependent, and it binds some proteins, thereby altering their folding) (Chiti et al. 1998) or 50 mM HEPES is a reasonable choice that buffers well at neutral pH. Lastly, proteins are polyelectrolytes, and thus their stability and folding rates are a function of the solvent ionic strength (e.g., Went et al. 2004). Folding rates might ideally be determined under physiological ionic strength, but this is problematic as physiological conditions vary in different organisms. Additionally, high concentrations of salts render some experiments, such as far-UV CD, difficult. We thus adopt the standard that, unless otherwise justified, no salt will be added beyond that provided by the buffer. For ease and accuracy in cross-group comparisons, the pH at which the experiments are conducted and the buffer system employed (including any additional salts) should be reported as clearly and prominently as the experimental results themselves.
Data reporting
The experimental folding community long ago adopted a de facto set of parameters to describe most protein folding reactions. Here we review these parameters and encourage their accurate and consistent reporting. We also argue that the pertinent structural characteristics of the experimental construct be clearly and completely described.
Folding phases exhibiting linear chevron diagrams
The estimated forward and backward rate constants for the kinetically-resolvable phases are extrapolated to estimate rate constants in the absence of denaturant. For phases that do not appear to exhibit kinetic rollover (phases for which the arms of the chevron plot are linear), a simple linear extrapolation, as described below, is appropriate. For experiments employing chemical denaturants and for which the arms of the chevron are linear, the so-called m-value (Pace and Shaw 2000) should be reported. This folding (or unfolding) m-value is the derivative of the natural logarithm of the folding (or unfolding) rate constant with respect to the denaturant concentration. Fitted values have historically been reported in units of kJ/mol/M for ease in comparison to equilibrium parameters. We recommend this practice be adopted as standard.
Folding phases exhibiting nonlinear chevron diagrams
Proteins that exhibit kinetic rollover are a significant complication. Rollover can arise due to the formation of stable on-pathway intermediates (e.g., Capaldi et al. 2002), the formation of stable off-pathway intermediates (e.g., Mogensen et al. 2004), a denaturant-induced shift between alternative pathways or change in the nature of the barrier (transition-state movement) (e.g., Otzen et al. 1999; Hedberg and Oliveberg 2004), ionic strength effects when guanidinium salts are used (e.g., Went et al. 2004; de los Rios and Plaxco 2005), or aggregation (e.g., Silow and Oliveberg 1997; Went et al. 2004). Clearly there is no universal fitting approach that is appropriate for all nonlinear chevrons. For this reason we suggest a fair default position for nonlinear chevrons would be to report both second-order polynomial extrapolations of the full data set (described below) and linear extrapolations of the linear regions close to the midpoint; both parameter sets should be clearly labeled as such. The existence of multiple, mutually exclusive mechanisms for roll-over, however, suggests that it is also important to report the raw kinetic data [e.g., ln(kobs)] as a function of denaturant concentration) in numerical (tabular) form so that future researchers can refit the data as new models arise. We realize that the latter suggestion is effectively unprecedented in the literature, but as our understanding of the spectrum of folding mechanisms improves, the reporting of raw kinetic data represents an increasingly important contribution to the field. Such data can often be posted online as supplementary material, as is done here.
Non–two-state proteins
While progress has been made in terms of empirically or theoretically predicting two-state folding rates (such as via relationships between rates and native state topology) (e.g., Plaxco et al. 1998b), similar relationships between folding rates and equilibrium properties for non–two-state folding have generally not been found (for counter-examples, see the work of Ivankov et al. 2003, Kamagata et al. 2004). This no doubt at least partly results from the lack of a large, consistent, and complete data set of non–two-state folding kinetics. Moreover, since many different mechanisms can be used to describe such data, the physical nature of each of the phases in non–two-state folding is often unclear, further clouding any putative relationships between the equilibrium and kinetic properties of non–two-state proteins. Obviously there is no simple solution to this problem, but we believe that improvements in data reporting would provide an excellent opportunity to create a more useful data set for such studies. We thereby suggest that, for non–two-state proteins, investigators clearly and concisely identify the method via which the phase was observed (and the given rate obtained) and indicate, if possible, the proposed molecular origins of the phase and the range of conditions under which it was observed. In addition, the estimated (extrapolated) rate in the absence of denaturant and the denaturant m-value for each phase should be reported as described per two-state proteins.
Equilibrium parameters
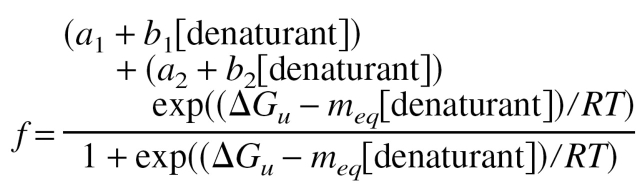
A measure of whether the reported kinetic phases capture the entire folding and unfolding process is provided by a recapitulation of the folding free energy and overall energetic m-value as derived from a chevron plot with the values determined from equilibrium experiments. Thus, we consider it important that kinetic data are reported in conjunction with folding free energies and m-values derived via equilibrium unfolding experiments conducted under conditions identical to those employed in the kinetic study or from the end-point signals from kinetic amplitude analysis. The de facto community standard for fitting equilibrium unfolding curves is described in detail by Santoro and Bolen (1988) and repeated here for convenience. Spectroscopic signals, f, (e.g., from fluorescence or CD) as a function of denaturant should be fitted to the following expression:
 |
(1) |
where ΔGu is the free energy of unfolding; meq is the equilibrium m-value; a1 and a2 are the spectroscopic signals of the folded and unfolded states, respectively, in absence of denaturant; and b1 and b2 are the changes in the signals of the folded and unfolded states as function of denaturant concentration and account for sloped baselines.
Units
The rates of unimolecular folding reactions are conveniently reported in sec−1. As described below, however, rate data are better fitted as the logarithm of observed rates. We thus suggest reporting natural logarithm (loge or ln) of folding rate (in units of sec−1) with the corresponding estimated errors in this parameter. With regard to protein stability and m-values, our consensus is that it is probably time that folding studies began to employ IUPAC (International Union of Pure and Applied Chemistry)-approved units appropriate for physical chemistry, namely, kJ/mol and kJ/mol/M, rather than kcal/mol and kcal/mol/M. Again, we believe that clearly indicating the units employed is far more critical than using any particular set of units. We note that the problem of ambiguously defined units (and the base of any logarithms employed) has historically been particularly acute in figure legends and labels.
Structural description
Given the importance of empirical and theoretical relationships between folding rates and structural characteristics such as length and topology, we believe that it is of the utmost importance to unambiguously describe the structure of the protein construct characterized. At a minimum, the full length (and, preferably, sequence) of the actual construct under investigation should be reported. This is most important in light of the fact that it has recently been shown that the addition of even small amino- or carboxyl-terminal tags can affect unfolding and refolding kinetics (Hamill et al. 1998; Went et al. 2004). It is also of value to denote the length of the “structured” region of this construct (i.e., the length excluding terminal tails that are “unstructured” in the native state). Lastly, it is of great utility to direct readers to the most relevant crystallographic or NMR-based structure file in the Protein Data Bank, as well as to indicate the appropriate chain designator and the residue numbers of the first and last structured residues in the file that are also in the characterized construct.
Data reduction
Estimated folding and unfolding rate constants in water, as well as m-values, are fitted parameters derived from experimental observations. The precise values of these fitted parameters depends on the fitting algorithms employed. After careful consideration, we recommend the following fitting procedures.
Determination of rates and m-values for linear chevrons via chemical denaturation
The most appropriate method of data analysis would be a simultaneous fitting of all of the observed signals (fluorescence, far-UV CD, etc.) as a function of time and denaturant concentration. However, this approach is so cumbersome that it has only rarely (Zitzewitz et al. 1995; Raschke et al. 1999) been employed. Instead, fitted relaxation rate constants (kobs) are themselves typically fitted as a function of denaturant concentration (the so-called chevron plot, which is the plot of ln(kobs) versus denaturant concentration at a given temperature, pH, etc) to one of several well-established relationships. For chevrons with linear folding and unfolding arms, we recommend fitting ln(kobs) to the following equation:
 |
(2) |
where mf and mu are the kinetic folding and unfolding m-values (the slopes of the two arms of the chevron, measured in kJ/mol/M) and A = ln(kf0) and B = ln(ku0), where kf0 and ku0 are the folding and unfolding rate constants, respectively, in the absence of denaturant. While fitting kobs (the sum of two exponentials) is superficially equivalent to fitting ln(kobs) (the log of a sum), the two approaches are not mathematically equivalent. Because kobs is an exponential function of denaturant concentration, parameters estimated by directly fitting kobs are very heavily influenced by the most rapid observed rates. Because of technical limitations, however, errors in kobs tend to be roughly proportional to kobs, and thus the most rapid rates are usually the most poorly defined. By instead fitting ln(kobs) rather than kf, we put the experimental errors on a common scale and reduce the influence of the most poorly measured data on the parameter estimates. Moreover, since most current theoretical models predict ln(kf) (i.e., barrier heights) rather than kf, fitting to A = ln(kf0) and B = ln(ku0) provides direct estimates of the relevant parameters and their associated errors. For these reasons we believe it is more appropriate to fit ln(kobs) than to fit kobs.
Determination of rate constants and m-values for chevrons with rollover
Some proteins exhibit significantly nonlinear behavior in the chevron diagram. A generic approach for fitting these nonlinear chevrons is not obvious, since the extracted parameters will be model dependent. As described above, a simple, if perhaps unsatisfying, solution is to fit only the linear regions of the chevron close to the midpoint. We believe this should be done if a linear, two-state model is supported by the data over this range of denaturant concentrations; e.g., if RTln(ku/kf) is within error of the equilibrium unfolding-derived ΔGu. Parameters obtained from polynomial fittings of the entire data set
 |
(3) |
can also be reported to describe the shape of the chevron plot. On the other hand, while equation 3 provides an empirical fit to the chevron data, it lacks a physical justification and thus probably should be employed with caution. More generally, we encourage the reporting of the raw ln(kobs) versus denaturant concentration values (published here as Supplemental Material) so that alternative mechanistic models of nonlinearity can be readily tested.
Error analysis
Standard errors, which quantify the uncertainty in parameter estimates, should also be reported. This will enable future researchers to appropriately weight folding observations by their estimated error when, for example, ln(kf) is used as a dependent variable in an association study such as those relating folding rates to measures of protein topology. In addition, many other statistics can be derived from the raw data. Given that, under many circumstances, more detailed statistical analysis is required, we reiterate our strong recommendation that raw folding data be reported. Lastly, given that most theories estimate ln(kf) rather than kf, it is the estimate of the former parameter, and its standard error, that should be determined and reported.
Results
In an effort to support our recommendations with concrete action, we report here the kinetic and equilibrium folding parameters for 30 apparently two-state, single-domain proteins or protein domains (excised from larger proteins) characterized under the consensus conditions (Table 1). The folding kinetics of seven of these have not previously been reported. For many others, the folding kinetics have not been reported under the conditions recommended here. As per our recommendations, we also report the full structural details of the characterized constructs (Table 2), the full sequence of the characterized construct (Supplemental Material), and the data from which the kinetic parameters were derived (Supplemental Material). We report these data in tabular formats that we suggest efficiently convey all the key structural data, experimental conditions, and kinetic and equilibrium results that will be of interest to researchers in the folding field.
Table 1.
Two-state data set
| Protein | ln (kf) | ln (ku) | mf kJ/mol/M | mu kJ/mol/M | ΔGu kJ/mol | meq kJ/mol/M | Conditionsa |
| Abp1 SH3 | 2.46 ± 0.06 | −2.72 ± 0.08 | −6.36 ± 0.17 | 0.83 ± 0.04 | 13.0 ± 0.8 | −6.9 ± 0.3 | Phosphate/GuHCl/0.1 M NaCl |
| ACBP | 6.96 ± 0.04 | −3.86 ± 0.02 | −9.74 ± 0.09 | 4.80 ± 0.09 | 23.7 ± 0.7 | −13.1 ± 0.3 | HEPES/GuHCl |
| ADAh2 | 6.80 ± 0.12 | −0.42 ± 0.18 | −3.12 ± 0.13 | 1.12 ± 0.05 | 17.1 ± 0.4 | −3.9 ± 0.1 | Phosphate/urea |
| Apo-azurin | 4.91 ± 0.09 | −4.02 ± 0.23 | −8.03 ± 0.23 | 5.06 ± 0.19 | 29.2 ± 1.5 | −17.6 ± 0.9 | 5 mM phosphate/GuHCl |
| CheW | 7.44 ± 0.31 | −12.05 ± 0.29 | −8.92 ± 0.29 | 5.01 ± 0.16 | 50.2 ± 0.6 | −14.6 ± 0.2 | Phosphate/GuHCl |
| C12 | 5.75 ± 0.17 | −10.33 ± 0.56 | −5.70 ± 0.18 | 4.20 ± 0.25 | 32.5 ± 1.4 | −8.3 ± 0.3 | Phosphate/GuHCl |
| CTL9 | 3.27 ± 0.06 | −7.85 ± 0.37 | −3.09 ± 0.04 | 1.38 ± 0.10 | 27.2 ± 0.3 | −4.4 ± 0.1 | 20 mM phosphate/pH 8/0.1 M NaCl/urea |
| EC298 | 9.08 ± 0.12 | 4.49 ± 0.61 | −8.16 ± 0.27 | 5.95 ± 0.37 | 11.4 ± 1.6 | −14.1 ± 1.9 | Phosphate/GuHCl/T-jump |
| FKBP12 | 1.60 ± 0.09 | −8.10 ± 0.29 | −5.07 ± 0.14 | 2.20 ± 0.11 | 23.4 ± 0.9 | −6.3 ± 0.2 | Phosphate/urea |
| Fyn SH3 | 4.88 ± 0.17 | −4.34 ± 0.37 | −4.92 ± 0.21 | 1.68 ± 0.17 | 20.3 ± 1.4 | −6.1 ± 0.4 | Phosphate/GuHCl |
| GW1 | 3.98 ± 0.17 | −1.66 ± 0.18 | −10.12 ± 0.84 | 4.63 ± 0.18 | 15.5 ± 0.3 | −13.9 ± 0.3 | Phosphate/0.1 M NaCl/1mM DTT |
| Im7* | 7.20 ± 0.05 | 2.34 ± 0.04 | −4.68 ± 0.09 | 0.53 ± 0.02 | 11.7 ± 0.6 | −4.7 ± 0.2 | Tris/urea |
| Im9* | 7.33 ± 0.02 | −1.87 ± 0.05 | −4.53 ± 0.01 | 0.26 ± 0.02 | 20.9 ± 0.6 | −4.4 ± 0.1 | Tris/urea |
| λ-repressor | 10.38 ± 0.28 | 3.21 ± 0.19 | −7.34 ± 0.52 | 2.86 ± 0.16 | 21.2 ± 1.9 | −10.1 ± 0.4 | 20 mM phosphate/pH 8/GuHCl |
| L23 | 2.02 ± 0.06 | −3.88 ± 0.07 | −3.46 ± 0.09 | 1.17 ± 0.02 | 11.3 ± 1.1 | −3.3 ± 0.5 | Phosphate/urea |
| mAcP | −1.58 ± 0.18 | −9.00 ± 0.35 | −1.27 ± 0.08 | 4.12 ± 0.10 | 20.4 ± 0.2 | −5.3 ± 0.5 | Tris/urea |
| NTL9 | 6.55 ± 0.02 | 0.08 ± 0.13 | −1.84 ± 0.04 | 0.71 ± 0.04 | 17.3 ± 0.2 | −2.6 ± 0.0 | 20 mM Tris/0.1 M NaCl/urea |
| Protein G | 6.30 ± 0.08 | −1.72 ± 0.17 | −7.03 ± 0.15 | 1.38 ± 0.12 | ND | ND | HEPES/pH 7.5/GuHCl |
| Protein L | 4.10 ± 0.09 | −3.25 ± 0.10 | −6.38 ± 0.19 | 2.08 ± 0.05 | 19.9 ± 0.9 | −8.1 ± 0.4 | Phosphate/GuHCl |
| raf RBD | 8.36 ± 0.12 | −2.77 ± 0.65 | −3.39 ± 0.09 | 1.03 ± 0.20 | 26 ± 3 | −4.1 ± 0.5 | Phosphate/urea/1 mM DTT |
| S6 | 6.07 ± 0.21 | −8.28 ± 0.49 | −7.04 ± 0.28 | 3.13 ± 0.22 | 34.7 ± 0.4 | −10.0 ± 0.1 | Phosphate/GuHCl |
| Sho1 SH3 | 2.11 ± 0.23 | −2.49 ± 0.20 | −6.60 ± 0.86 | 3.09 ± 0.13 | 9.4 ± 0.9 | −13.1 ± 1.1 | Phosphate/GuHCl/0.1 M NaCl |
| Spectrin SH3 | 1.05 ± 0.01 | −4.83 ± 0.07 | −2.27 ± 0.01 | 0.55 ± 0.02 | 13.9 ± 0.3 | −2.7 ± 0.1 | Phosphate/urea |
| SrcSH2 | 8.74 ± 0.21 | −3.48 ± 0.29 | −4.25 ± 0.12 | 0.89 ± 0.09 | 31.0 ± 0.4 | −5.6 ± 0.1 | 20 mM imidizole/0.1 mM TCEP/urea |
| Src SH3 | 4.36 ± 0.07 | −1.27 ± 0.13 | −4.19 ± 0.16 | 1.70 ± 0.07 | 15.9 ± 2.5 | −6.7 ± 0.8 | Phosphate/GuHCl |
| Tm1083 | 6.85 ± 0.59 | −5.26 ± 0.44 | −5.79 ± 1.08 | 3.28 ± 0.19 | 38.2 ± 0.2 | −9.8 ± 0.7 | Phosphate/0.1 M NaCl/GuHCl |
| U1A | 4.62 ± 0.05b | −11.72 ± 0.58b | −4.75 ± 0.15c | 4.13 ± 0.16c | 34.8 ± 1.5 | 8.6 ± 0.7 | Phosphate/GuHCl |
| Ubiquitin | 7.33 ± 0.06 | −6.84 ± 0.34 | −5.66 ± 0.08 | 3.43 ± 0.15 | 34.2 ± 0.4 | −9.1 ± 0.1 | 20 mM acetate/pH 5/GuHCl |
| Urml | 2.58 ± 0.04 | −3.30 ± 0.08 | −2.72 ± 0.07 | 2.04 ± 0.03 | 13.0 ± 1.9 | −4.2 ± 0.5 | Phosphate/urea |
| VlsE | 2.03 ± 0.24 | −8.47 ± 0.25 | −9.27 ± 0.60 | 5.24 ± 0.17 | 23.7 ± 0.7 | −14.7 ± 0.4 | 5 mM phosphate/urea |
* Folding/unfolding rate in water estimated from extrapolation to zero denaturant. Linear extrapolations unless otherwise noted (see footnotes c and d).
a All experiments were conducted at 25°C; Other conditions were as follows unless otherwise noted: 50 mM buffer, no additional salts added. Lastly, all data were collected via stopped-flow dilution experiments unless otherwise noted.
b Extrapolated rate in water estimated using a polynomial fit (Equation 3) due to significant curvature.
cm-Values derived from the linear regions of a rather curved chevron plot.
Table 2.
Structural information
| Structure | |||||
| Residue numberc | |||||
| Protein | PDB filea | Chain/modelb | Start | Stop | Length of constructd |
| ABP1SH3 | 1JO8 | 1 | 58 | 68 | |
| ACBP | 1NTI | 1 | 86 | 86 | |
| ADAh2 | 1O6X | 1 | 1 | 81 | 81 |
| Apo-azurin | 1E65 | 1 | 128 | 128 | |
| CheW | 1K0S | 1 | 9 | 151 | 151 |
| CI2 | 2CI2 | 1 | 20 | 83 | 64 |
| CTL9 | 1DIV | 58 | 149 | 92 | |
| EC0298 | 1JYG | — | 1 | 69 | 89 |
| FKBP | 1FKF | 1 | 107 | 110 | |
| FynSH3 | 1AVZ | C | 85 | 141 | 78 |
| GW1 | 1M9S | 391 | 466 | 85 | |
| Im7* | 1AYI | 2 | 87 | 94 | |
| Im9* | 1IMQ | 2 | 86 | 93 | |
| λ-repressor | 1LMB | 6 | 85 | 80 | |
| L23 | 1N88 | 1 | 96 | 96 | |
| mAcP | 1APS | — | 1 | 98 | 99 |
| NTL9 | 1DIV | 1 | 56 | 56 | |
| Protein G | 3GB1 | 1 | 56 | 62 | |
| Protein L | 2PTL | 1 | 18 | 77 | 79 |
| raf RBD | 1RFA | 1 | 55 | 132 | 80 |
| S6 | 1RIS | 1 | 97 | 101 | |
| Sho1 SH3 | NA | ND | ND | 76 | |
| Spectrin SH3 | 1SHG | 6 | 62 | 62 | |
| SrcSH2 | 1SPR | A | 2 | 104 | 110 |
| SrcSH3 | 1RLQ | 9 | 64 | 61 | |
| Tm1083 | NA | ND | ND | 124 | |
| U1A | 1URN | 2 | 97 | 102 | |
| Ubiqutin | 1UBQ | 1 | 76 | 76 | |
| Urm1 | NA | ND | ND | 101 | |
| VlsE | 1L8W | B | 23 | 335 | 338 |
a The Protein Data Base (PDB) file most relevant to the characterized construct.
b Which chain in the PDB file (for files containing more than one polymer chain) is relevant or judged most representative.
c PDB file residue numbers for the first and last “structured” (i.e., showing a unique, well-defined conformation in the crystallographic or solution-phase structure) amino acids that are also present in the characterized construct.
d The full length of the characterized construct, including unstructured amino– or carboxy–terminal tails (e.g., uncleaved his-tags).
Discussion
Here we have suggested a set of experimental conditions that we propose the field should, so far as practical, employ as “default” conditions for quantitative biophysical studies of protein folding. We describe each parameter (with justification), preferred units, fitting algorithms, error estimation methods, and a minimal structural description that we believe should be reported when describing experimental folding results. We also describe here the folding of 30 apparently two-state proteins and isolated protein domains (Table 1), including their complete structural description (Table 2), the sequences of the characterized constructs, and the experimental data from which the kinetic parameters were derived (both as Supplemental Material). We hope that this work and the establishment of this like-minded group of experimental protein folding investigators (a “foldeomics consortium” spanning 17 laboratories in seven countries) will serve as a first step in an ongoing effort to compile a data set of the folding properties of a large number of reversibly folding proteins.
We should note that, because the conditions described here were specifically chosen to maximize backward compatibility with the literature, our recommendations generally only lead to relatively small changes in the reported folding rates of most of the previously characterized proteins. For example, 13 of the proteins characterized here were included in an earlier 24-protein data set that was used to illustrate the relationship between an empirical measure of topology termed relative contact order and two-state folding rates (Plaxco et al. 2000). Many of the rates reported here are effectively unchanged between this work and the previous report, with the median rate variation being 24%, the mean variation 80%, and the largest variation a factor of six. Thus it is perhaps not surprising that the correlation between relative contact order and the ln(kf) tabulated here, r = 0.85, is effectively indistinguishable from the r = 0.86 relationship derived using the originally reported rates (data not shown). Nevertheless, given the rather minimal effort required to adopt the recommended set of conditions, we believe that setting even (necessarily) arbitrary standards is appropriate even if the experimental variability the effort seeks to minimize is, itself, relatively small. More generally, we hope that adherence to a standardized, and less model-dependent, system for measuring and reporting experimental results will stimulate and unify ongoing efforts to understand folding.
Materials and methods
The kinetic and thermodynamic characterizations were conducted under the conditions and by using the data reduction methods described above. Specific details regarding the production and characterization of the various proteins and isolated domains are described below, as are the initials of the specific investigators responsible for each individual data set.
SrcSH2 and SrcSH3
Both proteins were expressed with amino-terminal 6-his tags followed by a TEV protease site and were purified according to standard protocols (Qiagen). The tag was removed by overnight digestion with TEV protease at room temperature followed by a second passage over a Ni-NTA column. The SH2 domain was characterized under the conditions described (Table 1), which included 1 mM tris(2-carboxyethyl)phosphine (TCEP) (Pierce), to prevent the intermolecular disulfide bond formation. The SH3 domain was characterized under standard consensus conditions (Table 1). Kinetics of both proteins were determined by using a Biologic SFM 4 stopped-flow coupled to a Fluoromax 3 fluorimeter, with excitation at 290 nm and emission recorded between 310 and 330 nm. A slow, denaturant-independent refolding phase (kf = ∼0.05 sec−1) accounting for ∼5% of the total amplitude of the SH2 domain folding was assumed to represent proline isomerization and ignored (data not shown). A slow phase (∼0.02 sec−1) observed in the folding of the srcSH3 domain and previously assigned (Grantcharova and Baker 1997) to proline isomerization was also ignored (D.W., S.M.).
NTL9 and CTL9
The proteins were expressed and purified as described (Sato et al. 2001) and characterization under the conditions reported (Table 1) as described (Kuhlman et al. 1998; Sato 2002; Sato and Raleigh 2002). CTL9 was studied at pH 8.0 because the stability and folding rate are strongly pH dependent between pH 5.0 and pH 7.5. The protein is most stable above pH 7.5 (Sato 2002; Sato and Raleigh 2002). The chevron plot represents the faster of two phases. Previous reports indicate that the slower phase reflects proline isomerism (Sato 2002; Sato and Raleigh 2002) (J.H., D.P.R.).
U1A and L23
U1A was expressed in Escherichia coli (C41) and purified on CM-Sepharose (Amersham Pharmacia) and S100 (Amersham Pharmacia). L23 was expressed in E. coli (BL21 DE3) and purified on SP-Sepharose (Amersham Pharmacia) and S100 (Amersham Pharmacia) and characterized as described (Hedberg and Oliveberg 2004). Stopped-flow measurements were carried out on an Applied Photophysics stopped-flow fluorimeter (SX17MV). Equilibrium fluorescence data were collected on J-810 JASCO spectrometer (excitation 280 nm, emission >300 nm) (L.H., M.O.).
raf RBD
This protein was expressed, purified, and characterized as previously described (Vallée-Bélisle et al. 2004), save the characterization was performed under the conditions described (Table 1). The most rapid refolding phase, which accounts for ∼40% of the total amplitude at low denaturant concentrations, was well fitted to a two-state folding transition. Three additional slower phases are resolved at below 3 M urea. These exhibit rates, amplitudes, and denaturant dependencies similar to those previously (Vallée-Bélisle et al. 2004) observed in GuHCl. In this previous study, rapid unfolding/refolding double-jump experiments suggested that the third and fourth transitions could be attributed to non-prolyl and proline residues isomerizations, respectively. However, the nature of the second transition remains to be conclusively determined, since its amplitude remains constant even when the delay between unfolding and refolding is insufficient to equilibrate the cis-trans isomers of the unfolded state (S.W.M., A.V.B.).
Urm1
The Saccharomyces cerevisiae protein was cloned from yeast genomic DNA into a prSET expression vector containing a 6-his affinity tag and a thrombin cleavage site. The protein was expressed in E. coli (C41), purified by Ni-NTA affinity column and thrombin cleaved at room temperature on the column. The cleaved protein was polished on a HiLoad 26/60 Superdex 75 (Amersham Pharmacia). Equilibrium data were acquired on an Aminco-Bowman Luminescence Spectrophotometer; final protein concentration was 1 μM. Freshly thawed Urm1 was titrated into urea and 50 mM sodium phosphate (pH 7.0) and incubated for 4 h before measurement. Equilibrium and kinetic fluorescence measurements were monitored via tryptophan fluorescence by using an excitation wavelength of 280 nm. Kinetic data were acquired on an Applied Photophysics stopped-flow fluorimeter (SX-17MV); protein was at a final concentration of 1 μM. Data were acquired above a wavelength of 320 nm by using a glass cut-off filter. Six traces were collected for each denaturant concentration, and data were first averaged and then fit to a single-exponential equation including a linear drift. Coincidence of equilibrium and kinetic data indicates that this protein folds via a two-state process (data not shown) (A.G.B., S.E.J.).
CheW
The protein, from Thermotoga maritima, was cloned into a modified pET15b vector and expressed with an amino-terminal 6-his tag followed by a TEV protease site and purified according to standard protocols (Qiagen). The tag was removed by overnight digestion with TEV protease at room temperature followed by a second passage over a Ni-NTA column. Unfolding and refolding rates were determined under standard consensus conditions by using an AVIV 202SF stopped-flow CD spectrometer. Equilibrium parameters were determined on an AVIV 62 CD spectrometer using a Microlab titrator (D.W., S.M.).
ACBP
Bovine ACBP was obtained as previously described (Thomsen et al. 2002). Stopped-flow kinetic experiments were performed using a Biologic SFM-400 attached to a Jasco J-810. Excitation was at 280 nm, and fluorescence was measured with a 305-nm long-pass filter. The experiments were performed at 10 μM protein concentration under the conditions reported (Table 1). Equilibrium unfolding data were collected under the same conditions using a Perkin-Elmer LS-50b fluorimeter with excitation and detection at 280 nm and 356 nm, respectively (K.T., B.B.K., F.M.P.).
S6
A 100-μM stock of Thermus thermophilus S6, obtained as previously described (Miller et al. 2002), was diluted into buffered GuHCl solutions under the conditions listed (Table 1) using a Biologic SFM-4, and fluorescence emission at 350 nm using 280 nm excitation was recorded using a Jobin-Yvon Horiba Fluoromax 3. Data collected below 2.02 M GuHCl were fit to a double exponential, and the major refolding phase was used to fit the chevron. Similar results have been observed for S6 previously (Otzen et al. 1999). All other points fit well to a single exponential equation (E.J.M., S.M.).
mAcP
The human protein was expressed and purified as described previously (Taddei et al. 1996). Kinetic unfolding/refolding was followed by using a Biologic SFM-3 stopped-flow fluorimeter, with excitation at 280 nm and a bandpass filter to monitor emitted fluorescence >320 nm under conditions listed (Table 1). Equilibrium urea denaturation was observed by monitoring the intrinsic fluorescence of 30 samples equilibrated in urea concentrations ranging from 0–8 M using a Perkin-Elmer LS 55 spectrofluorimeter with excitation wavelength at 280 nm and emission at 335 nm. Tris buffer was used rather than the recommended phosphate and HEPES because both bind to the native state of this protein with consequent alteration of its stability and kinetics (Chiti et al. 1998) (F.B., F.C.).
CI2
Stopped-flow kinetic folding and unfolding were performed with a Biologic SFM4 machine. Rate constants were determined by monitoring the change in the fluorescence signal. The excitation wavelength was 280 nm, and emission was collected at 320 nm. The faster measurable kinetic phase, which appears to represent a two-state, non–proline-limited phase (Jackson and Fersht 1991a), was used in this analysis. The equilibrium unfolding of the protein was characterized with an Aviv titrating CD spectrometer set at 220 nm. Equilibration time was 2 min. Solvent conditions were as described (Table 1) (N.-D.V., Y.B., M.A.R., K.W.P.).
Im7* and Im9*
These homologs were prepared, and their folding and unfolding kinetics and thermodynamics were measured as previously described (Capaldi et al. 2002; Friel et al. 2003) save under the conditions described here (Table 1). Each protein contains the amino-terminal tag ME(H)6, which is denoted by the asterisk (i.e., Im7* and Im9*). Under the conditions employed, the folding of both proteins appear two-state (Fig. 1 ▶). A mild nonlinearity in the urea dependence of ln(ku), which was previously noted (Ferguson et al. 1999) in the folding of Im7, was also observed under these consensus conditions (C.T.F., S.E.R.).
Figure 1.
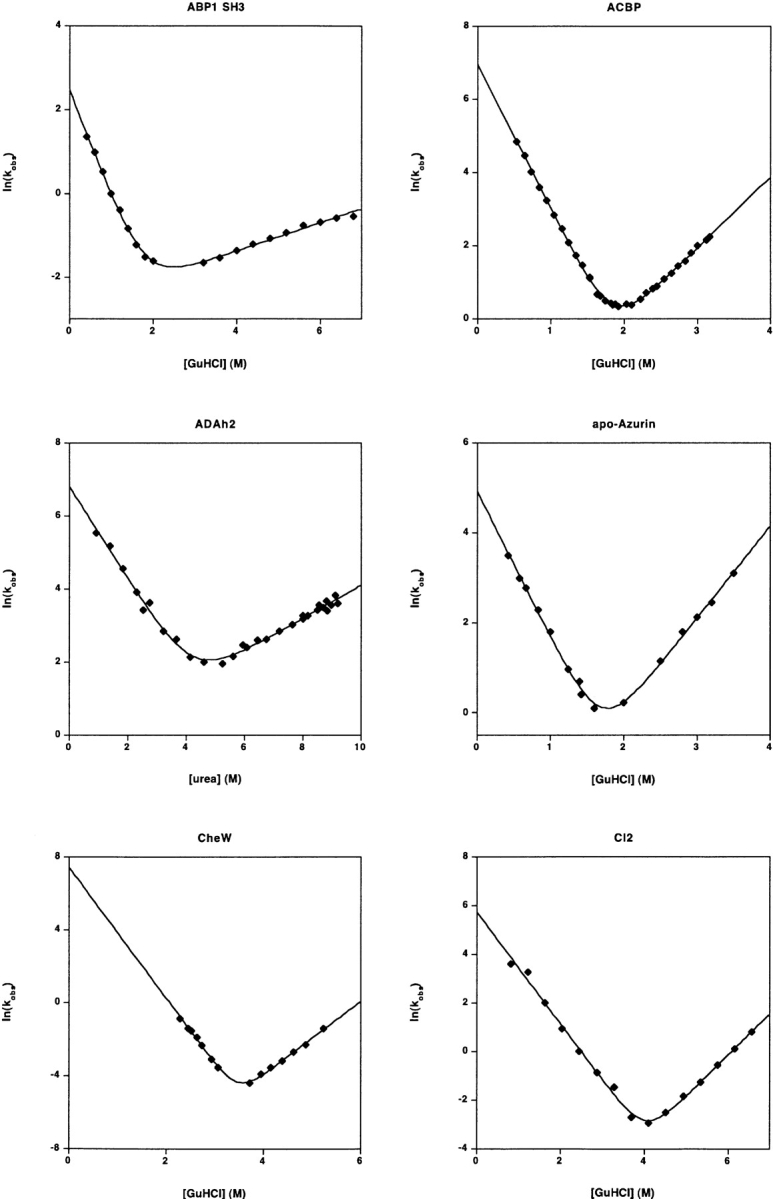
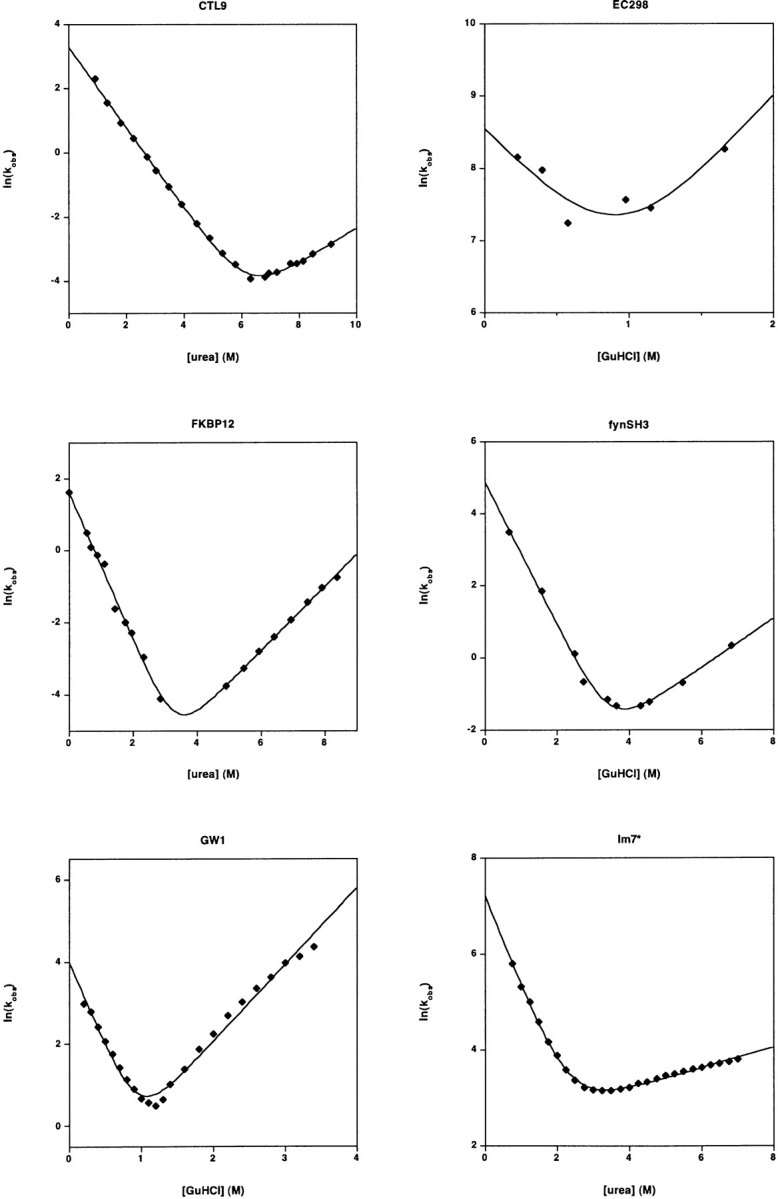
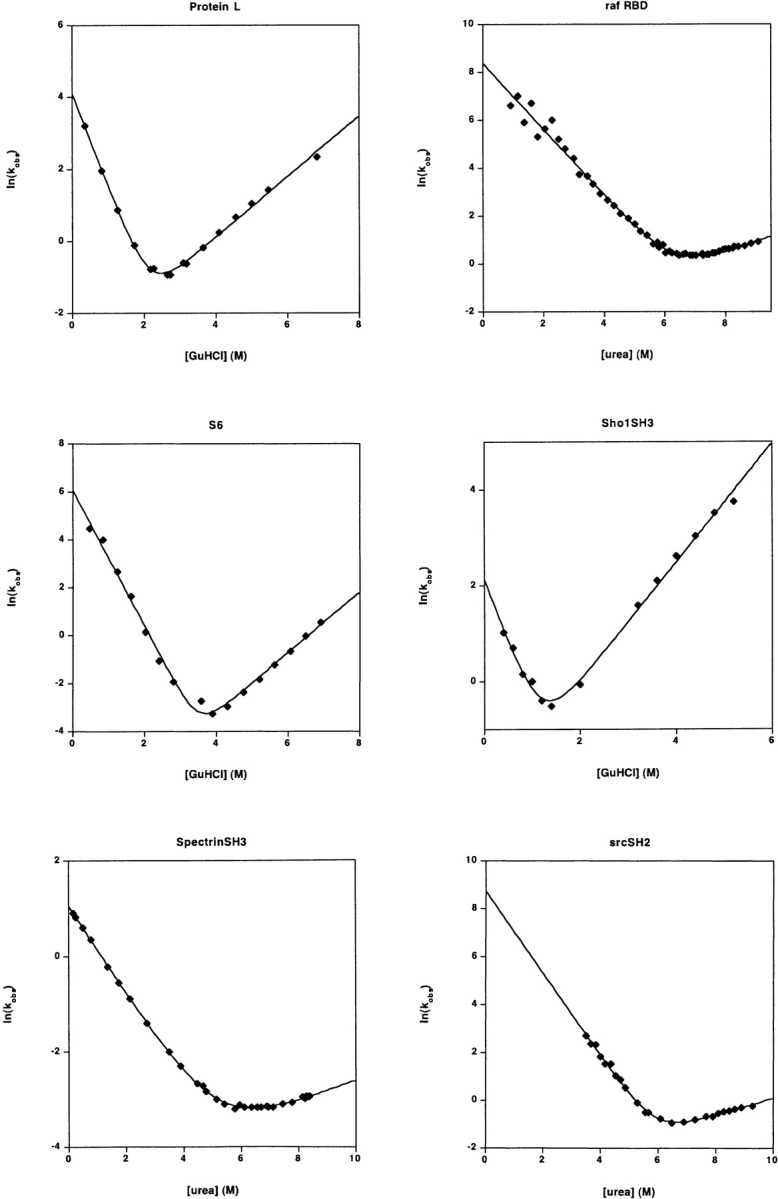
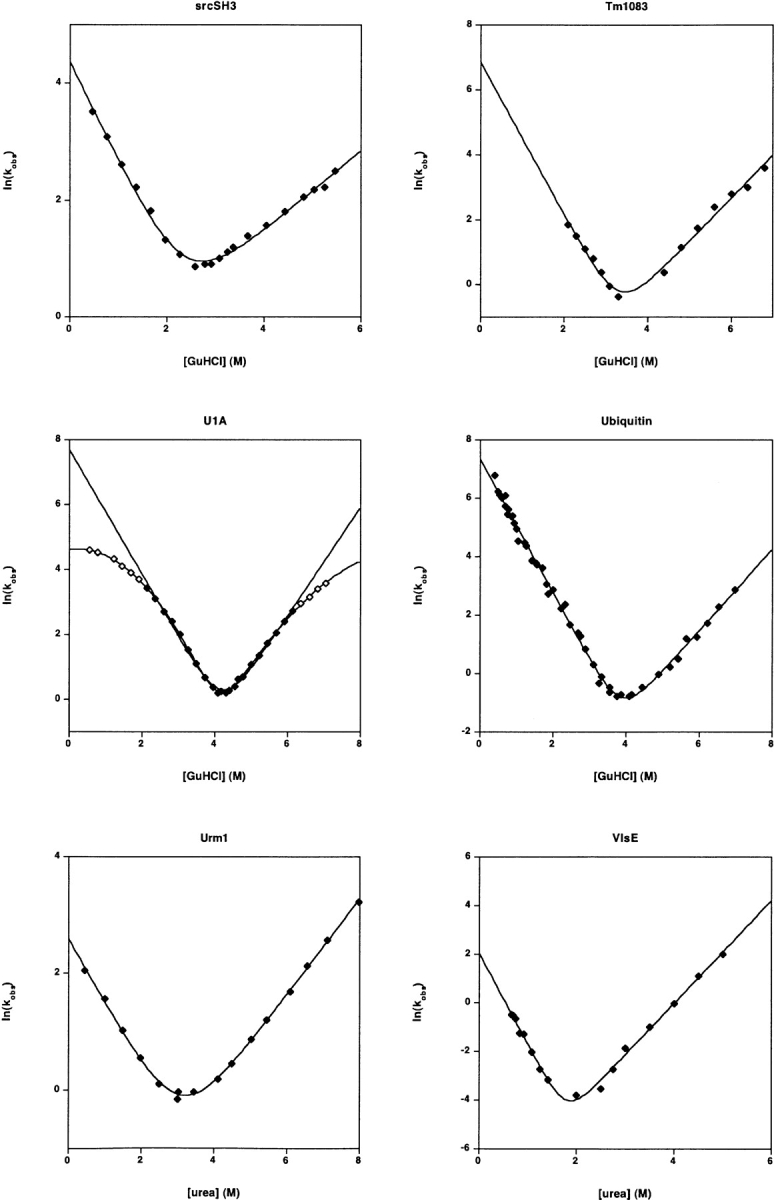
The refolding and unfolding kinetics of 30 small proteins and isolated protein domains. All but one fold with rates that are well-fitted (r2 > 0.97) by linear-arm chevrons (equation 2) and appear to represent two-state folding under these conditions (as judged by the equivalence of the folding free energy as determined from kinetic and equilibrium chemical melts) (Table 1). The protein U1A exhibits significantly curved folding and unfolding arms under the conditions employed here (and other conditions)) (Otzen et al. 1999). Fitting the apparently linear region of the U1A chevron (r2= 0.994) produces an estimated ln(kf) in water of 7.68 ± 0.18; fitting all of the data to a second order polynomial chevron (r2 = 0.9995) produces the significantly lower estimate ln(kf) = 4.62 ± 0.05. Several other proteins appear to exhibit curvature in their unfolding arms. But because these data are also well-fitted by equation 2, this curvature was ignored in the illustrated fits and in the data reported in Table 1. Note that the X- and Y-axis ranges vary significantly from plot to plot in this figure.
EC0298
The protein was cloned into pet15B (which has a thrombin cleavage site) and expressed and purified as previously described (Maxwell et al. 2003). Folding/unfolding rates were determined under the conditions described (Table 1) by laser T-jump fluorescence spectroscopy (Qiu et al. 2002). Equilibrium free energy was obtained from a GuHCl titration as monitored by CD. As monitored by the coincidence of the kinetically and equilibrium-derived folding free energy, this protein folds via an apparently two-state process (L.Q., D.B., K.L.M., S.J.H.).
FKBP12
This protein was purified and characterized as described previously (Main et al. 1999) save under the conditions described (Table 1) (E.R.G.M., S.E.J.).
Protein L and FynSH3
These proteins were expressed and purified as previously described (Scalley et al. 1997; Maxwell and Davidson 1998) and employed without cleavage of the his-tag. Kinetics were monitored via tryptophan fluorescence (excitation 280 nm, emission >320 nm) on an APP stopped-flow fluorimeter. Equilibrium unfolding was monitored via CD at 220 nm on an Aviv titrating CD spectrometer with a 2-min equilibration time. Buffer conditions were as described (Table 1). Both proteins have previously been established to fold via an apparently two-state process (Scalley et al. 1997; Plaxco et al. 1998a) (M.A.R., K.W.P.).
Abp1 SH3, Sho1 SH3, GW1, and TM1083
The proteins were expressed in E. coli BL21* and purified under denaturing conditions (6M GuHCl) using nickel affinity chromatography by analogy to previous reports (Maxwell and Davidson 1998). The purified proteins were subsequently folded through dialysis in 50 mM phosphate buffer/100 mM NaCl and used as such without cleaving the tag. Folding and unfolding rates were obtained on a Biologic SFM-4 stopped-flow fluorimeter, with excitation at 295 nm and detection of total fluorescence >309 nm. Traces were fit to appropriate single exponentials. At each concentration of GuHCl, at least five separate shots of 3–5 μM protein were averaged. Equilibrium melts were monitored using 1 μM protein on an Aviv Spectrofluorometer ATF 105 monitoring fluorescence emission at 340 nm with excitation at 295 nm (A.Z.A., A.R.D.).
λ Repressor and protein G
These proteins were expressed, purified, and characterized as previously described (Krantz et al. 2002) save under the conditions described (Table 1). The pH employed for λ-repressor was raised slightly to improve its fluorescence properties (T.R.S.).
Ubiquitin
Data adopted from previously reported work (Krantz and Sosnick 2000) (T.R.S.).
SpectrinSH3 and ADAh2
Data for these proteins were adopted from previous work (Viguera et al. 1996; Villegas et al. 1998) and refitted as described here (L.S.).
Apo-azurin and VlsE
Apo-azurin is the metal (copper)-free version of native azurin. The data for both proteins were adopted from previous studies (Jones et al. 2001; Pozdnyakova and Wittung-Stafshede 2001; Pozdnyakova et al. 2002; Jones and Wittung-Stafshede 2003) (P.W.S.).
Electronic supplemental material
We present as supplemental materials the full sequences of each of the constructs characterized in this study and the kinetic “chevron data” used to generate the reported kinetic parameters.
Acknowledgments
We acknowledge support from the following: the NIH via grants GM62868-01A2 (K.W.P.), GM59663 (P.W.-S.), GM50945 (S.M.), GM70941 (D.P.R.), and GM55694 (T.R.S.); the NSF via grant MCB-0347124 (S.J.H.); the Ontario Research and Development Challenge Fund (A.E.M.); the Canadian Institutes of Health Research (A.R.D.); and a faculty innovation award from the Johns Hopkins University (I.R.). S.E.R. and C.T.F. are members of the Astbury Centre for Structural Molecular Biology and also acknowledge the BBSRC and the Wellcome Trust for financial support. S.E.R. is a BBSRC Professorial Fellow. S.E.J. acknowledges support from the Welton Foundation and BBSRC. S.W.M. acknowledges support from the Natural Sciences and Engineering Research Council of Canada (NSERC) and is the Canada Research Chair in Integrative Genomics. E.R.G.M. holds a Tucker Prize Research Fellowship, Girton College, Cambridge. A.G.B. holds an EPSRC studentship. B.B.K., F.M.P., and K.T. acknowledge support from the John and Birthe Meyer Foundation and the Danish Research Council’s Biotechnology Programme. K.L.M. is supported by a CIHR fellowship, and A.Z.A. is supported by an Ontario Graduate Student Scholarship.
Note added in proof
An updated version of the data presented here is also available online at http://www.foldeomics.org.
Abbreviations
GuHCl, guanidine hydrochloride
tris, tris hydroxymethylaminoethane
HEPES, 4-(2-hydroxyethyl)-1-piperazineethanesulfonic acid
TCEP, tris(2-carboxyethyl)phosphine
CD, circular dichroism
Article published online ahead of print. Article and publication date are at http://www.proteinscience.org/cgi/doi/10.1110/ps.041205405.
Supplemental material: see www.proteinscience.org
References
- Capaldi, A.P., Kleanthous, C., and Radford, S.E. 2002. Im7 folding mechanism: Misfolding on a path to the native state. Nat. Struct. Biol. 9 209–216. [DOI] [PubMed] [Google Scholar]
- Chiti, F., Taddei, N., van Nuland, N.A., Magherini, F., Stefani, M., Ramponi, G., and Dobson, C.M. 1998. Structural characterization of the transition state for folding of muscle acylphosphatase. J. Mol. Biol. 283 893–903. [DOI] [PubMed] [Google Scholar]
- de los Rios, M. A., and Plaxco, K.W. 2005. Apparent Debye-Huckel electrostatic effects in the folding of a simple, single domain protein. Biochemistry (in press). [DOI] [PubMed]
- Ferguson, N., Capaldi, A.P., James, R., Kleanthous, C., and Radford, S.E. 1999. Rapid folding with and without populated intermediates in the homologous four-helix proteins Im7 and Im9. J. Mol. Biol. 286 1597–1608. [DOI] [PubMed] [Google Scholar]
- Friel, C.T., Capaldi, A.P., and Radford, S.E. 2003. Structural analysis of the rate-limiting transition states in the folding of lm7 and lm9: Similarities and differences in the folding of homologous proteins. J. Mol. Biol. 326 293–305. [DOI] [PubMed] [Google Scholar]
- Grantcharova, V.P. and Baker, D. 1997. Folding dynamics of the src SH3 domain. Biochemistry 36 15685–15692. [DOI] [PubMed] [Google Scholar]
- Hamill, S.J., Meekhof, A.E., and Clarke, J. 1998. The effect of boundary selection on the stability and folding of the third fibronectin type III domain from human tenascin. Biochemistry 37 8071–8079. [DOI] [PubMed] [Google Scholar]
- Hedberg, L. and Oliveberg, M. 2004. Scattered Hammond plots reveal second level of site-specific information in protein folding:φ’ β†. Proc. Natl. Acad. Sci. 101 7606–7611. [DOI] [PMC free article] [PubMed] [Google Scholar]
- Ivankov, D.N., Alm, E., Plaxco, K.W., Baker, D., and Finkelstein, A.V. 2003. Contact order revisited: The influence of protein size on folding rates. Protein Sci. 12 2057–2062. [DOI] [PMC free article] [PubMed] [Google Scholar]
- Jackson, S.E. 1998. How do small single-domain proteins fold? Fold. Des. 3 R81–R91. [DOI] [PubMed] [Google Scholar]
- Jackson, S.E. and Fersht, A.R. 1991a. Folding of chymotrypsin inhibitor-2, 1: Evidence for a two-state transition. Biochemistry 30 10428–10435. [DOI] [PubMed] [Google Scholar]
- ———. 1991b. Folding of chymotrypsin inhibitor-2, 2: Influence of proline isomerization on the folding kinetics and thermodynamic characterization of the transition-state of folding. Biochemistry 30 10436–10443. [DOI] [PubMed] [Google Scholar]
- Jones, K. and Wittung-Stafshede, P. 2003. The largest protein observed to fold by two-state kinetic mechanism does not obey contact-order correlation. J. Am. Chem. Soc. 125 9606–9607. [DOI] [PubMed] [Google Scholar]
- Jones, K., Guidry, J., and Wittung-Stafshede, P. 2001. Characterization of surface antigen from Lyme disease spirochete Borrelia burgdorferi. Biochem. Biophys. Res. Commun. 289 389–394. [DOI] [PubMed] [Google Scholar]
- Kamagata, K., Arai, M., and Kuwajima, K. 2004. Unification of the folding mechanisms of non–two-state and two-state proteins. J. Mol. Biol. 339 951–965. [DOI] [PubMed] [Google Scholar]
- Krantz, B.A. and Sosnick, T.R. 2000. Distinguishing between two-state and three-state models for ubiquitin folding. Biochemistry 39 11696–11701. [DOI] [PubMed] [Google Scholar]
- Krantz, B.A., Srivastava, A.K., Nauli, S., Baker, D., Sauer, R.T., and Sosnick, T.R. 2002. Understanding protein hydrogen bond formation with kinetic H/D amide isotope effects. Nat. Struct. Biol. 9 458–463. [DOI] [PubMed] [Google Scholar]
- Kuhlman, B., Luisi, D.L., Evans, P.A., and Raleigh, D.P. 1998. Global analysis of the effects of temperature and denaturant on the folding and unfolding kinetics of the N-terminal domain of the ribosomal protein L9. J. Mol. Biol. 284 1661–1670. [DOI] [PubMed] [Google Scholar]
- Main, E.R., Fulton, K.F., and Jackson, S.E. 1999. Folding pathway of FKBP12 and characterisation of the transition state. J. Mol. Biol. 291 429–444. [DOI] [PubMed] [Google Scholar]
- Makhatadze, G.I. 1999. Thermodynamics of protein interactions with urea and guanidinium hydrochloride. J. Phys. Chem. B 103 4781–4785. [Google Scholar]
- Maxwell, K.L. and Davidson, A.R. 1998. Mutagenesis of a buried polar interaction in an SH3 domain: Sequence conservation provides best prediction of stability effects. Biochemistry 37 16172–16182. [DOI] [PubMed] [Google Scholar]
- Maxwell, K.L., Bona, D., Liu, C., Arrowshmith, C.H., and Edwards, A.M. 2003. Refolding out of guanidine hydrochloride is an effective approach for high-throughput structural studies of small proteins. Protein Sci. 12 2073–2080. [DOI] [PMC free article] [PubMed] [Google Scholar]
- Miller, E.J., Fischer, K.F., and Marqusee, S. 2002. Experimental evaluation of topological parameters determining protein-folding rates. Proc. Natl. Acad. Sci. 99 10359–10363. [DOI] [PMC free article] [PubMed] [Google Scholar]
- Mogensen, J.E., Ipsen, H., Holm, J., and Otzen, D.E. 2004. Elimination of a misfolded folding intermediate by a single point mutation. Biochemistry 43 3357–3367. [DOI] [PubMed] [Google Scholar]
- Otzen, D.E., Kristensen, O., Proctor, M., and Oliveberg, M. 1999. Structural changes in the transition state of protein folding: Alternative interpretations of curved chevron plots. Biochemistry 38 6499–6511. [DOI] [PubMed] [Google Scholar]
- Pace, C.N. and Shaw, K.L. 2000. Linear extrapolation method of analyzing solvent denaturation curves. Proteins 4 (Suppl.) 1–7. [DOI] [PubMed] [Google Scholar]
- Plaxco, K.W., Guijarro, J.I., Morton, C.J., Pitkeathly, M., Campbell, I.D., and Dobson, C.M. 1998a. The folding kinetics and thermodynamics of the FynSH3 domain. Biochemistry 37 2529–2537. [DOI] [PubMed] [Google Scholar]
- Plaxco, K.W., Simons, K.T., and Baker, D. 1998b. Contact order, transition state placement and the refolding rates of single domain proteins. J. Mol. Biol. 277 985–994. [DOI] [PubMed] [Google Scholar]
- Plaxco, K.W., Simons, K.T., Ruczinski, I., and Baker, D. 2000. Sequence, stability, topology and length: The determinants of two-state protein folding kinetics. Biochemistry 39 11177–11183. [DOI] [PubMed] [Google Scholar]
- Pozdnyakova, I. and Wittung-Stafshede, P. 2001. Copper binding before poly-peptide folding speeds up formation of active holo: Pseudomonas aeruginosa azurin. Biochemistry 40 13728–13733. [DOI] [PubMed] [Google Scholar]
- Pozdnyakova, I., Guidry, J., and Wittung-Stafshede, P. 2002. Studies of Pseudomonas aeruginosa azurin mutants: Cavities in β-barrel do not affect refolding speed. Biophys. J. 82 2645–2651. [DOI] [PMC free article] [PubMed] [Google Scholar]
- Qiu, L.L., Pabit, S.A., Roitberg, A.E., and Hagen, S.J. 2002. Smaller and faster: The 20-residue Trp-cage protein folds in 4 μs. J. Am. Chem. Soc. 124 12952–12953. [DOI] [PubMed] [Google Scholar]
- Raschke, T.M., Kho, J., and Marqusee, S. 1999. Confirmation of the hierarchical folding of RNase H: A protein engineering study. Nat. Struct. Biol. 6 825–831. [DOI] [PubMed] [Google Scholar]
- Santoro, M.M. and Bolen, D.W. 1988. Unfolding free energy changes determined by the linear extrapolation method, 1: Unfolding of phenylmethanesulfonyl α-chymotrypsin using different denaturants. Biochemistry 27 8063–8068. [DOI] [PubMed] [Google Scholar]
- Sato, S. 2002. “Folding of ribosomal protein L9 and its isolated N- and C-terminal domains.” Ph.D. thesis, Department of Chemistry, State University of New York at Stony Brook, Stony Brook, NY.
- Sato, S. and Raleigh, D.P. 2002. pH-dependent stability and folding kinetics of a protein with an unusual α-β topology: The C-terminal domain of the ribosomal protein L9. J. Mol. Biol. 318 571–582. [DOI] [PubMed] [Google Scholar]
- Sato, S., Xiang, S., and Raleigh, D.P. 2001. On the relationship between protein stability and folding kinetics: A comparative study of the N-terminal domains of RNase HI, E. coli and Bacillus stearothermophilus L9. J. Mol. Biol. 312 569–577. [DOI] [PubMed] [Google Scholar]
- Scalley, M.L., Yi, Q., Gu, H.D., McCormack, A., Yates, J.R., and Baker, D. 1997. Kinetics of folding of the IgG binding domain of peptostreptoccocal protein L. Biochemistry 36 3373–3382. [DOI] [PubMed] [Google Scholar]
- Silow, M. and Oliveberg, M. 1997. Transient aggregates in protein folding are easily mistaken for folding intermediates. Proc. Natl. Acad. Sci. 94 6084–6086. [DOI] [PMC free article] [PubMed] [Google Scholar]
- Spector, S. and Raleigh, D.P. 1999. Submillisecond folding of the peripheral subunit-binding domain. J. Mol. Biol. 293 763–768. [DOI] [PubMed] [Google Scholar]
- Taddei, N., Stefani, M., Magherini, F., Chiti, F., Modesti, A., Raugei, G., and Ramponi, G. 1996. Looking for residues involved in the muscle acylphosphatase catalytic mechanism and structural stabilization: Role of Asn 41: Thr 42 and Thr 46. Biochemistry 35 7077–7083. [DOI] [PubMed] [Google Scholar]
- Thomsen, J.K., Kragelund, B.B., Teilum, K., Knudsen, J., and Poulsen, F.M. 2002. Transient intermediary states with high and low folding probabilities in the apparent two-state folding equilibrium of ACBP at low pH. J. Mol. Biol. 318 805–814. [DOI] [PubMed] [Google Scholar]
- Vallée-Bélisle, A., Turcotte, J.-F., and Michnick, S.W. 2004. raf RBD and ubiquitin proteins share similar folds, folding rates and mechanisms despite having unrelated amino acid sequences. Biochemistry 43 8447–8458. [DOI] [PubMed] [Google Scholar]
- Viguera, A.R., Wilmanns, M., and Serrano, L. 1996. Different folding transition states could result in the some native structure. Nat. Struct. Biol. 3 874–880. [DOI] [PubMed] [Google Scholar]
- Villegas, V., Martinez, J.C., Aviles, F.X., and Serrano, L. 1998. Structure of the transition state in the folding process of human procarboxypeptidase A2 activation domain. J. Mol. Biol. 283 1027–1036. [DOI] [PubMed] [Google Scholar]
- Went, H.M., Benitez-Cardoza, C.B., and Jackson, S.E. 2004. Is there an intermediate populated on the folding pathway of ubiquitin? FEBS Lett. 567 333–338. [DOI] [PubMed] [Google Scholar]
- Zitzewitz, J.A., Bilsel, O., Luo, J.B., Jones, B.E., and Matthews, C.R. 1995. Probing the folding mechanisms of a leucine-zipper peptide by stopped-flow circular-dichroism spectroscopy. Biochemistry 34 12812–12819. [DOI] [PubMed] [Google Scholar]