

Abstract
Cytokines of the interleukin-6 (IL-6)-type family all bind to the glycoprotein gp130 on the cell surface and require interaction with two gp130 or one gp130 and another related signal transducing receptor subunit. In addition, some cytokines of this family, such as IL-6, interleukin-11, ciliary neurotrophic factor, neuropoietin, cardiotrophin-1, and cardiotrophin-1-like-cytokine, interact with specific ligand binding receptor proteins. High- and low-affinity binding sites have been determined for these cytokines. So far, however, the stoichiometry of the signaling receptor complexes has remained unclear, because the formation of the cytokine/cytokine-receptor complexes has been analyzed with soluble receptor components in solution, which do not necessarily reflect the situation on the cellular membrane. Consequently, the binding affinities measured in solution have been orders of magnitude below the values obtained with whole cells. We have expressed two gp130 extracellular domains in the context of a Fc-fusion protein, which fixes the receptors within one dimension and thereby restricts the flexibility of the proteins in a fashion similar to that within the plasma membrane. We measured binding of IL-6 and interleukin-b receptor (IL-6R) by means of fluorescence-correlation spectroscopy. For the first time we have succeeded in recapitulating in a cell-free condition the binding affinities and dynamics of IL-6 and IL-6R to the gp130 receptor proteins, which have been determined on whole cells. Our results demonstrate that a dimer of gp130 first binds one IL-6/IL-6R complex and only at higher ligand concentrations does it bind a second IL-6/IL-6R complex. This view contrasts with the current perception of IL-6 receptor activation and reveals an alternative receptor activation mechanism.
Keywords: gp130, cytokine, confocal fluorescence correlation spectroscopy, interleukin-6
The interleukin-6 (IL-6) family of cytokines acts via multimeric receptor complexes that contain at least one molecule of the signal transducing protein gp130 (Taga and Kishimoto 1997). The family consists of IL-6, interleukin-11 (IL-11), ciliary neurotrophic factor (CNTF), cardiotrophin-1 (CT-1), cardiotrophin-like cytokine (CLC), leukemia inhibitory factor (LIF), oncostatin M (OSM), and neuropoietin (NPN) (Taga and Kishimoto 1997; Derouet et al. 2004). On target cells, IL-6, IL-11, CLC, NPN, and CNTF first bind to specific receptors, and these complexes associate with a homodimer of gp130 in the case of IL-6 and IL-11 or, alternatively, with a heterodimer of gp130 and the related protein LIF receptor (LIF-R) in the case of CNTF, CLC, and NPN (Taga and Kishimoto 1997; Rose-John 2001). OSM and LIF first bind directly to gp130 and LIF-R, respectively, and form heterodimers with LIF-R and gp130. An alternative OSM receptor has been described that can heterodimerize with gp130 (Mosley et al. 1996). CT-1 has been described to bind directly to the LIF-R, thereby inducing gp130/LIF-R heterodimer formation, but a CT-1 specific glycosylphosphatidylinositol-anchored receptor for CT-1 may also exist on neuronal cells (Pennica et al. 1996). Interestingly, recently the crystal structure of LIF in complex with the cytokine-binding-region of gp130 has been solved, demonstrating that these domains of gp130 exhibit a remarkable plasticity to accommodate nine different ligands (Boulanger et al. 2003a).
Gp130 is expressed by all cells in the body, whereas IL-6R is mainly expressed by hepatocytes, monocytes/macrophages, and some leukocytes. A naturally occurring soluble form of the IL-6R (sIL-6R), which has been found in various body fluids, is generated by two independent mechanisms, limited proteolysis of the membrane protein and/or translation from an alternatively spliced mRNA (Lust et al. 1992; Rose-John and Heinrich 1994; Müllberg et al. 2000; Hundhausen et al. 2003). Interestingly, the sIL-6R together with IL-6 stimulates cells, which only express gp130 (Taga et al. 1989; Mackiewicz et al. 1992), a process that has been named transsignaling (Rose-John and Heinrich 1994; Peters et al. 1998; Müllberg et al. 2000). Recently, it has been shown that the sIL-6R strongly sensitizes target cells (Peters et al. 1996). Embryonic stem cells (Rose-John 2002), early hematopoietic progenitor cells (Peters et al. 1997, 1998), many neural cells (März et al. 1998, 1999), smooth muscle cells (Klouche et al. 1999), and endothelial cells, among others, are only responsive to IL-6 in the presence of sIL-6R (Jones and Rose-John 2002).
There is an ongoing debate with regard to the exact stoichiometry of the signaling IL-6 receptor complexes. Using biophysical methods, IL-6 has been detected in a soluble hexameric receptor complex containing two molecules of IL-6, IL-6R, and gp130 (Ward et al. 1996). Moreover, IL-6 has been shown to co-precipitate with one molecule of IL-6 and with two molecules of IL-6R and soluble gp130 (Paonessa et al. 1995), respectively. Furthermore, IL-6 has recently been crystallized in a hexameric complex containing two molecules each of IL-6, IL-6R, and gp130 (Boulanger et al. 2003b). On the other hand, we have developed an alternative activation model for the gp130 receptor complex that is based on a tetrameric gp130 receptor complex (Grötzinger et al. 1999) and that is supported by several structure function analyses of gp130 or gp130 cytokines (Kallen et al. 1999; Pflanz et al. 2000). Each gp130 molecule has two distinct binding sites for IL-6, one located in the N-terminal Ig-like domain and the second in the cytokine-binding module. As a consequence, there are four such sites in the signaling-competent gp130 homodimer, enabling the binding of two IL-6 molecules in a symmetrical manner. Mutagenesis of one of the two sites in gp130 is sufficient to abrogate signaling and binding (Horsten 1997; Kurth et al. 1999). Most interestingly, cotransfection of two signaling-incompetent muteins with one compromised IL-6 binding site in each gp130 protein into the same cell restores biological activity, suggesting that only one of the two IL-6 binding sites in the gp130 homodimer is sufficient for induction of the signaling cascade (Pflanz et al. 2000). Of note we have recently observed that LIF and Hyper-IL-6 show completely different dose-response curves on murine embryonic stem cells. While LIF responses reach a plateau at high concentrations, Hyper-IL-6 exerts inhibitory activities when applied at the high nanomolar range. This can be explained by the fact that LIF interacts with two different receptor chains, namely, gp130 and LIFR, whereas Hyper-IL-6 acts via a homodimer of gp130 (Viswanathan et al. 2002), which at high ligand concentrations accommodates a dimer of Hyper-IL-6.
The interaction between single molecules can be detected by confocal fluorescence correlation spectroscopy (FCS). The feasibility of detecting molecular number fluctuations by FCS was first demonstrated by Magde et al. (1972). The implementation of confocal detection optics (Koppel et al. 1976; Rigler and Widengren 1990) and the use of silicon photo detectors were important milestones in the development of this technology, opening the doors to a detection limit at the single molecule level (Rigler et al. 1993).
Parameters such as diffusion time (τdiff/μsec) or molecular brightness (q/kHz) are influenced by the interaction of the fluorescent molecule with a corresponding binding partner. The observed changes can be utilized as a direct measure of the molecular interaction. FCS and other confocal fluorescence spectroscopy methods have been used to study a wide range of biological interactions including protein–DNA, protein–peptide, and others (Gradl et al. 1999) (see Table 1▶).
Table 1.
FCS and related methods
| Method | Readout parameters |
|---|---|
| Fluorescence correlation spectroscopy (FCS) | Translational diffusion time |
| Fluorescence intensity distributions analysis (FIDA) | Molecular brightness |
| Two-dimensional fluorescence intensity distributions analysis (2D-FIDA) | Molecular rotation |
| Fluorescence intensity multiple distributions analysis (FIMDA) | Translational diffusion time, molecular brightness |
| FxCS | Coincidence |
The theoretical background of fluorescence intensity multiple distribution analysis (FIMDA) has previously been published (Palo et al. 2000). Using FIMDA, fluorescent molecules are characterized not only by their diffusion time as with FCS or by their molecular brightness as with fluorescence intensity distributions analysis (FIDA), but by both parameters simultaneously. Thereby it is possible to characterize and differentiate populations of fluorescent species, which cannot be resolved using FCS or FIDA separately. Having characterized the single components of a biological system by their molecular brightness and diffusion time, their concentration in a reaction mixture can directly be quantified.
For our analysis we used a fusion protein of IL-6 and sIL-6R, called Hyper-IL-6 (HIL-6), which has been shown to mimic the natural IL-6/IL-6R complex (Fischer et al. 1997). The advantage of Hyper-IL-6 is that the IL-6/IL-6R complex, which naturally consists of two separate molecules, is now a single molecule and dissociation between IL-6 and IL-6R need not be considered during the analysis. The Hyper-IL-6 protein used in our analysis is labeled by fluorescence. Furthermore, we used a fusion protein of gp130 with the constant part (Fc) of a human IgG1 antibody (Jostock et al. 2001) called sgp130Fc. This protein contains two disulfide-linked extracellular portions of gp130 and thereby mimics a dimeric cell surface-exposed gp130 receptor.
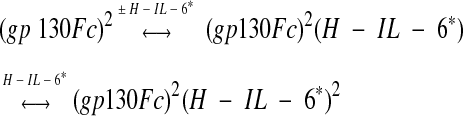
Here we analyze the stepwise formation of two putative Hyper-IL-6–sgp130Fc complexes (equation 1), which cannot be analyzed using only the diffusion time as a readout parameter since the difference in the molecular weight between the (sgp130Fc)(Hyper-IL-6) (310kDa) and the (sgp130Fc) (Hyper-IL-6)2 (380kDa) complex is too small. However, there should be a significant difference in the molecular brightness of the two complexes since the 310-kDa complex carries one and the 380-kDa complex carries two labeled Hyper-IL-6 molecules.
 |
(1) |
We show here that the dimeric gp130 molecule first binds one IL-6/IL-6R complex. At intermediate gp130 concentrations, a second IL-6/IL-6R protein is bound, which, however, is lost at even higher gp130 concentrations. These results are not compatible with the hexameric (IL6)2(IL-6R)2(gp130)2 paradigm.
Results
Purification and characterization of sgp130Fc
Sgp130Fc was isolated by affinity chromatography from the supernatant of CHO cells stably transfected with the cDNA coding for the fusion protein. Analysis of the eluted fractions by SDS-PAGE revealed some minor impurities of smaller proteins (Fig. 1A▶). In order to remove these impurities and to assure a monodisperse solution of the fusion protein, these fractions were pooled and subjected to size-exclusion chromatography (Fig. 1B▶). The sgp130Fc protein eluted in two peaks (a, b) from the column. The first (peak a) corresponds to the void volume and therefore most likely contains multimeric or aggregated sgp130Fc protein (Fig. 1B▶). The second (peak b) elutes at a position corresponding to the expected size of the sgp130Fc fusion protein (186 kDa). To further characterize the sgp130Fc protein, we recorded a circular dichroism (CD) spectrum. The measured CD spectrum is indicative of a protein in a folded state (Fig. 1C▶). Secondary structure analysis of the recorded far-UV CD spectrum reflects the β-sheet character of the sgp130Fc protein (α-helix, 11%; β-sheet, 30%; turn, 19%; remainder, 40%) (Sreerama and Woody 1994).
Figure 1.
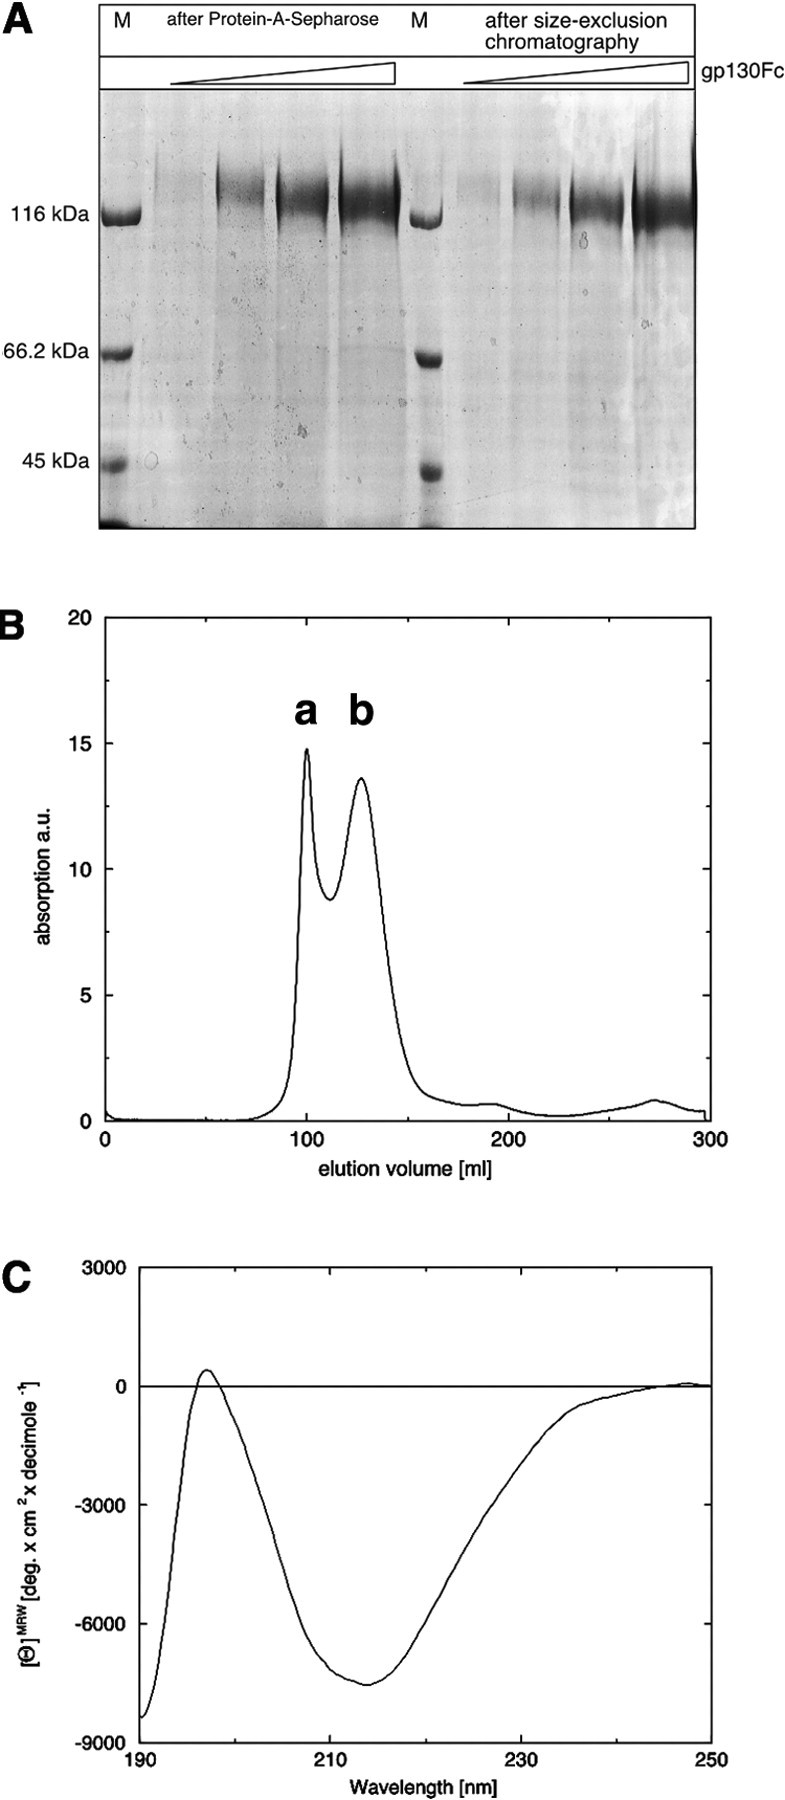
Purification and characterization of the recombinant gp130-Fc fusion protein. (A) Analysis of the different purification steps by SDS PAGE. M, molecular weight marker. Three different sgp130Fc concentrations were used. (B) Size-exclusion chromatography elution profile of the recombinant gp130-Fc fusion protein monitored at 280 nm. The void volume is denoted by a, and fraction b corresponds to the expected size of the sgp130Fc. The absorption is given in arbitrary units (au). (C) CD spectrum of the gp130-Fc fusion protein in the far UV.
Fluorescence labeling of Hyper-IL-6
The Hyper-IL-6 protein was labeled using the AffiTag EVOblue 50 protein labeling technology as described in Materials and Methods, yielding Hyper-IL-6*. After removal of the free dye and the unlabeled protein fraction, diffusion time measurements were carried out (Fig. 2▶). The free dye shows a short diffusion time typical for a small molecule. In contrast the labeled Hyper-IL-6 showed the expected diffusion time of a 80-kDa protein (see Table 2▶).
Figure 2.

Fluorescence labeling of Hyper-IL-6. H-IL-6 was labeled using the affinity labeling dye EVOblue50. The diffusion times of the pure labeling dye and two labeled H-IL-6 fractions are shown.
Table 2.
Fluorescent labeling of Hyper-IL-6, diffusion times of the conjugate in comparison to the free dye
| Fluorescent label/protein | Diffusion time (μsec) |
|---|---|
| Labeling dye (EVOblue50) | 104.3 ± 2.31 |
| Hyper-IL-6 fraction 2/1.04 μM | 567.7 ± 15.12 |
| Hyper-IL-6 fraction 3/1.12 μM | 561.7 ± 20.23 |
Values were calculated on the basis of triplicate measurements.
Analyzing the affinity of Hyper-IL-6 to sgp130Fc by fluorescence-correlation spectroscopy
The key to single molecule analysis of a biological system is the labeling of one reaction partner with a fluorescent dye. The FCS analysis of the labeled protein is used to determine the protein diffusion time, which is proportional to the cubic root of its molecular weight (equation 2). The binding of an interaction partner results in a changed molecular weight, hence a changed diffusion time.
 |
(2) |
A standard experiment for the analysis of such an interaction is the titration of the labeled molecule with a known binding partner. The resulting binding curve reflects the mutual affinity of both reaction partners and can directly be used to calculate the corresponding KD value.
FCS measurements were used to determine the binding constant of the sgp130Fc Hyper-IL-6 interaction. For this purpose, titration experiments were carried out, keeping the Hyper-IL-6 concentration constant at 0.5 nM while sgp130Fc was subjected to titration (0.01, 0.1, 0.3, 0.5, 1, 2, 3, 5, 10, and 30 nM). Data acquisition time was 30 sec per measurement and was repeated five times per sample (Fig. 3A▶). From these measurements a KD value of 0.06 nM was calculated. To analyze the interaction in more detail and to rule out any unspecific binding, a competition titration with fixed concentrations of labeled Hyper-IL-6 (0.5 nM) and sgp130Fc (1.0 nM) and increasing concentrations of unlabeled Hyper-IL-6 (0.01, 0.1, 0.3, 1, 3, 10, 30, and 100 nM) was used (Fig. 3B▶). An IC50 value of 0.86 nM was determined in this system, demonstrating the full reversibility of the binding of Hyper-IL-6 to the sgp130Fc protein.
Figure 3.
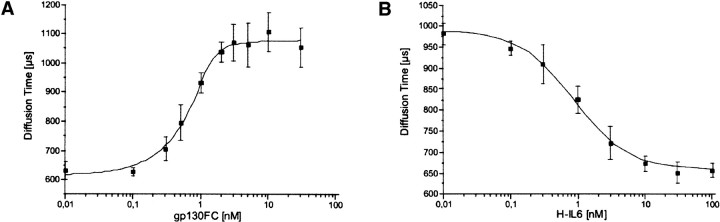
Fluorescence correlation spectroscopy (FCS). (A) Titration of the labeled Hyper-IL-6 with increasing concentrations of sgp130Fc, FCS Analysis 1-component fit, measurement time 5 × 30 sec, determined KD = 0.06 nM. (B) Competition titration with varying concentrations of unlabeled Hyper-IL-6 (1 nM sgp130Fc, 0.5 nM labeled Hyper-IL-6), FCS Analysis 1-component fit, measurement time 5 × 30 sec, determined IC50 = 0.86 nM.
FIMDA measurements
To investigate the binding process in more detail, two titrations of labeled Hyper-IL-6 with sgp130Fc at different Hyper-IL-6 concentrations (1 nM and 10 nM) and varying concentrations of sgp130Fc were performed. The data from the complete titration were first analyzed with FIMDA using a 1 component fit, which calculates the concentration, the diffusion time, and the molecular brightness. In both experiments the diffusion time increases from ~650 μsec up to ~1100 μsec with rising concentrations of sgp130Fc (data not shown). In both titrations, a maximum of the molecular brightness can be observed, which is, however, not very sharp in the titration of the low concentration of (1 nM) Hyper-IL-6 (Fig. 4A▶).
Figure 4.

Fluorescence intensity multiple distribution analysis (FIMDA). (A) Titration of labeled H-IL6 (open squares, 1 nM H-Il-6; closed triangles, 10 nM Hyper-IL-6) with increasing concentrations of sgp130Fc, FIMDA 1 component analysis (only the molecular brightness is depicted), measurement time 5 × 30 sec, brightness maximum for low concentration of labeled Hyper-IL-6 (open squares, 1 nM H-Il-6) at 0.5 nM sgp130Fc, brightness maximum for high concentration of labeled Hyper-IL-6 (closed triangles, 10 nM H-Il-6) at 5 nM sgp130Fc. (B) Titration of labeled Hyper-IL-6 with increasing concentrations of sgp130Fc, FIMDA 3 component analysis, Hyper-IL-6* free: brightness, 25.3 kHz; diffusion time, 654 μsec. (sgp130Fc)(Hyper-IL-6*)2 complex: brightness, 48.1 kHz; diffusion time, 1200 μsec. (sgp130Fc)(Hyper-IL-6*) complex: brightness, 24.3 kHz; diffusion time, 1144 μsec.
A more detailed analysis of the system was performed using a multicomponent fit of the data from the titration with the high concentration of Hyper-IL-6 (10 nM) (Fig. 4B▶). First, the diffusion time τ1 = 654 μsec and the molecular brightness q1 = 25.3 kHz were determined from a single component analysis applied to the pure (labeled) Hyper-IL-6 solution. Second, a one-component fit of the sample with the highest concentration of sgp130Fc was performed, providing the following values for the bound Hyper-IL-6: diffusion time τ2 = 1144 μsec; molecular brightness q2 = 24.3 kHz. The latter parameters were then assigned to the (sgp130Fc)(Hyper-IL-6*) complex since at higher concentrations of sgp130Fc the probability for the formation of (sgp130Fc)(Hyper-IL-6*)2 is extremely low. The parameters of the putative third component were determined at the point were the one-component fit of the whole titration exhibited the highest molecular brightness. For this purpose a three-component fit was performed using the parameters that had already been determined as fixed values, leaving only the three concentrations plus the diffusion time and the molecular brightness of the third component variable for the fitting algorithm. The three-component fit provided the following values for the diffusion time: τ3 = 1200 sec, molecular brightness q3 = 48.1 kHz. These values were then assigned to the (sgp130Fc)(Hyper-IL-6*)2 complex. As a final step a complete three-component fit of the titration was performed with all parameters fixed except for the concentrations. The results clearly indicate a distinct concentration range in which the (sgp130Fc)(Hyper-IL-6*)2 complex is present in low concentrations.
Discussion
There are two major findings reported in this study. First, we show for the first time that soluble receptor and ligand components of the IL-6 cytokine system can recapitulate the high binding affinity found on receptor expressing cells. Second, we demonstrate that two gp130 molecules can accommodate one or two IL-6/sIL-6R complexes depending on the molar ratio between gp130 and the IL-6/sIL-6R complex.
Binding of IL-6 to the IL-6 receptor complex on target cells has been determined in numerous studies with the help of different techniques. Using 125I-labeled IL-6, a low affinity of 500–750 pM and a high affinity of 10–60 pM was determined on human myeloma cells (U266) and human hepatoma cells (HepG2) (Yamasaki et al. 1988; Zohlnhöfer et al. 1992). The two affinities were explained by the fact that the IL-6 first binds to the IL-6R with low affinity and the IL-6/sIL-6R complex binds with high affinity to the gp130 receptor subunit. Using plasmon resonance measurements of immobilized IL-6 binding to soluble IL-6R (Weiergräber et al. 1995) or of immobilized sIL-6R binding to IL-6 (Toniatti et al. 1996), low binding affinities of 30–50 nM have been reported. Jostock et al. (2001) immobilized the sgp130Fc and measured the high affinity-binding constant of Hyper-IL-6 with 4 nM. In conclusion, the high- and low-affinity binding constants measured on cells could not be reproduced in cell-free systems.
Recently, using calorimetric measurements, Boulanger et al. (2003b) reported a low-affinity binding interaction between IL-6 and IL-6R of 9 nM and a high-affinity interaction between IL-6/sIL-6R and the complete extracellular domain of gp130 of 3 nM. Again, the cell-free system failed to recapitulate the high affinity of 10–60 pM found for the cellular measurements (Yamasaki et al. 1988; Zohlnhöfer et al. 1992).
In the present study we used an Fc-fusion protein of gp130, which, as in the study by Boulanger et al. (2003b), contained the entire extracellular portion of gp130. The only difference between our proteins was the dimerization of the extracellular portion of gp130 by the Fc domain. On the cellular membrane, the gp130 receptor protein is fixed within one dimension by the cellular membrane. We reason that this fact is responsible for the high affinity of 60 pM, which we determined for the interaction between the IL-6/ sIL-6R complex and gp130, and this may indicate the existence of a preformed gp130 on the cell surface.
The assembly of the IL-6/sIL-6R/gp130 complex has been hypothesized to occur in a sequential manner (Fig. 5A▶). It was speculated that once the IL-6/sIL-6R complex has been formed (in solution or on the cell membrane), one gp130 protein is bound (Fig. 5A▶). Thereafter, two complexes of IL-6/sIL-6R/gp130 should dimerize, forming a signaling hexameric complex (Boulanger et al. 2003b).
Figure 5.

Two possibilities of Interleukin-6 receptor assembly. In both reaction pathways the first step is the formation of an IL-6/IL-6R complex. The second step is the association with one gp130 molecule and subsequent dimerization of this complex to form the final hexameric complex (A); the association with two gp130 molecules leading to the tetrameric complex, which then can bind another IL-6/IL-6R complex to form the hexameric complex (B).
In this report we demonstrated that—depending on the ratio between the binding partners—the gp130 dimer can reversibly interact with one or two IL-6/sIL-6R complexes. If the sequential interaction of two IL-6/sIL-6R/gp130 would form a functional hexameric complex, such reversible interaction of the gp130 dimer with one or two IL-6/ sIL-6R complexes should not be possible. Although the Fc-directed formation of a gp130 dimer in the Fc-construct might not necessarily resemble the situation on the cell surface, we believe that the realistic affinity, which we determined using the sgp130Fc protein, strongly argues for two juxtaposed gp130 molecules within the cellular membrane, which are contacted by the IL-6/sIL-6R complex (Fig. 5B▶). This situation does not seem to be perfectly mimicked by the soluble unliganded gp130 protein, which is reflected by the lowered binding affinity for the IL-6/sIL-6R complex.
Interestingly, preformed dimers of receptor subunits have recently been observed for several other receptor systems, including EPOR (Livnah et al. 1999), EGFR (Sako et al. 2000), IFN-γ receptor (Krause et al. 2002), and probably gp130/OSMR (Auguste et al. 1997).
The notion that the high-affinity signaling gp130 complex is a hexamer consisting of two molecules of IL-6, two molecules of IL-6R, and two molecules of gp130 is based on three independent experimental approaches. Ward et al. (1994), using a combined size-exclusion chromatography and analytical centrifugation analysis, showed that the recombinant soluble components IL-6, sIL-6R, and sgp130 formed hexameric complexes. In an independent study it was shown that IL-6 could be coprecipitated with a second molecule of IL-6 in the presence of sIL-6R and sgp130. The investigators concluded that the high-affinity signaling gp130 complex should be a hexamer (Paonessa et al. 1995). Finally, the recent crystallization of gp130 with the viral IL-6 (which does not require IL-6R for complex formation) and with the IL-6/sIL-6R complex yielded assemblies in which two gp130 molecules are bound to two viral IL-6 proteins (Chow et al. 2001) or to two IL-6/sIL-6R complexes. All these studies have been undertaken at very high protein concentrations and therefore do not reflect the situation under physiological conditions.
We have recently suggested that in the IL-6 system, the transition between tetrameric and hexameric state might serve as a molecular switch between active and inactive receptor complexes. In such a model, very high IL-6/sIL-6R concentrations would inevitably lead to the formation of a hexameric receptor complex, as has indeed been observed in the crystals of the gp130 receptor complexes (Chow et al. 2001; Boulanger et al. 2003b). Remarkably, in many if not all cytokine systems, extremely high cytokine concentrations lead to inactivation of the cytokine responses. A concentration-dependent transition between tetrameric and hexameric receptor complexes would yield a molecular explanation for this physiologically important phenomenon.
Materials and methods
Reagents
All buffers used for labeling and FCS/FIMDA experiments were prepared with chemicals of the highest purity available from Sigma Aldrich.
Preparation of recombinant Hyper-IL-6 and sgp130Fc
Recombinant Hyper-IL-6 (Fischer et al. 1997) was expressed in stably transfected CHO cells and was purified by anion-exchange chromatography and size-exclusion chromatography. Recombinant sgp130Fc (Jostock et al. 2001) was purified from the supernatant of stably transfected CHO cells as described. In addition to the affinity chromatography (Jostock et al. 2001) the recombinant sgp130Fc was further subjected to size-exclusion chromatography, which was performed with an equilibrated Sephacryl S 300 HR (26/60) column (Amersham Biosciences) at a constant flow rate of 1 mL/min. The column was calibrated using a mixture of four proteins of known molecular mass: bovine serum albumin (69 kDa), ovalbumin (46 kDa), myoglobin (17 kDa), and aprotinin (6 kDa). The column was equilibrated with PBS and loaded with a 1-mL protein solution. Three-milliliter fractions were collected and analyzed by SDS-PAGE.
Experimental equipment: Single molecule detection
In contrast to conventional fluorescence spectroscopy where the average fluorescence is measured that is emitted from relatively large volumes in the microliter range, confocal fluorescence spectroscopy is based on the fluorescence emitted from an extremely small volume element of ~1 fL. The size of the volume element is defined by the intensity profile of a laser beam focused by a microscope objective typically into the well of a glass-bottom micro plate. Fluorescence photons emitted by molecules diffusing through the confocal volume element are detected in a time-resolved manner. Different evaluation methods or algorithms have been developed to process these fluorescence fluctuation data in order to calculate the values for different molecular parameters (Rufenach et al. 2002).
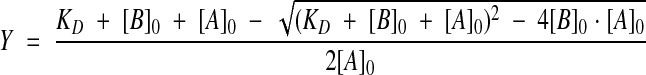
FCS and FIMDA measurements were performed on a MF20 microplate reader (Olympus Corp.) using the onboard 633-nm helium-neon laser at a laser power of 300 μW for excitation. For convenience, experiments were performed in 96-well glass-bottom plates (NC96/30, Evotec Technologies) using a sample volume of 20 μL, although, due to the nature of the confocal detection technique, equivalent data can be obtained irrespective of assay volume (Rüdiger et al. 2001; Wölcke and Ullmann 2001). The resulting raw data were subsequently analyzed with different algorithms depending on the desired readout. FCS and FIMDA data analysis was performed with the MF20 software package. Error bars shown in the graphs represent standard deviations from three to five measurements. Binding constants were calculated from triplicate measurements with Origin 6.1G from OriginLab Corp. using a nonlinear curve fit based on equation 3.
 |
(3) |
All single-molecule detection experiments (FCS/FIMDA) were performed under identical conditions with respect to incubation times (10 min) and temperature (25°C). Binding experiments were performed using the fluorescence-labeled Hyper-IL-6. The concentration of the labeled component was held constant whereas the concentration of the sgp130Fc was varied. For the subsequent competitor titrations, the labeled Hyper-IL-6 and sgp130Fc protein concentrations were kept constant whereas the concentration of the competitor (unlabeled Hyper-IL-6) was varied.
Fluorescence labeling and protein handling
All proteins were diluted from highly concentrated stocks and were handled in PBS (pH 7.2), passed through a 0.2-μm filter in 0.1% Pluronic F127 as an additive to minimize adsorption.
A novel labeling system (AffiTag EVOblue50 - 633 Protein Labeling Kit, Evotec-Technologies GmbH [prod. no. DAL_103]) was used to attach the fluorescent label to Hyper-IL-6. In contrast to standard labeling procedures where a high ratio of dye to protein is used for the labeling, protein and affinity tag dye were mixed in equimolar amounts. The labeling molecule itself consists of three functional groups, the dye moiety, the NHS group, and a biotin moiety. Labeling is followed by a combination of size-exclusion chromatography (removal of free dye) and affinity chromatography (removal of unlabeled or overlabeled protein) to isolate proteins carrying a single fluorescent label.
The advantages of the monodisperse-labeled protein fraction, besides its purity, is the uniformity of the molecular brightness of the labeled conjugate. The latter feature is essential when analyzing multimerization processes, which are based on the analysis of the molecular brightness. Protein solutions and labeled protein fractions were analyzed and quantified using a UV spectrometer (Lambda 25 UV/Vis, Perkin Elmer Instruments).
Circular dichroism spectroscopy
CD measurements were carried out on a Jasco 720 CD spectrometer, equipped with a temperature control unit and calibrated with a 0.1% aqueous solution of D-10-camphersulfonic acid according to Chen and Yang (1977). The spectral bandwidth was 1.5 nm. The time constant was 2 sec and the cell path length 0.1 mm.
Calculation of protein concentrations
Protein concentrations were calculated from absorption spectra in the range of 240–320 nm using the method of Waxman (Waxman et al. 1993).
Acknowledgments
We thank Jürgen Müllberg and Thomas Jostock for the construction of the sgp130Fc fusion protein and Silke Christoph for excellent technical assistance. This work was supported by grants of the Deutsche Forschungsgemeinschaft (SFB 415) to S.R.J., J.G., and K.J.K.
References
- Auguste, P., Guillet, C., Fourcin, M., Olivier, C., Veziers, J., Pouplard Barthelaix, A., and Gascan, H. 1997. Signaling of type II oncostatin M receptor. J. Biol. Chem. 272 15760–15764. [DOI] [PubMed] [Google Scholar]
- Boulanger, M.J., Bankovich, A.J., Kortemme, T., Baker, D., and Garcia, K.C. 2003a. Convergent mechanisms for recognition of divergent cytokines by the shared signaling receptor gp130. Mol. Cell 12 577–589. [DOI] [PubMed] [Google Scholar]
- Boulanger, M.J., Chow, D.-C., Brevnova, E.E., and Garcia, K.C. 2003b. Hexameric structure and assembly of the interleukin-6/IL-6 a receptor/gp130 complex. Science 300 2101–2104. [DOI] [PubMed] [Google Scholar]
- Chen, G.C. and Yang, J.T. 1977. Two-point calibration of circular dichrometer with d-10-camphorsulfonic acid. Anal. Lett. 10 1195–1207. [Google Scholar]
- Chow, D.-C., He, X.-L., Snow, A.L., Rose-John, S., and Garcia, K.C. 2001. Structure of an extracellular gp130-cytokine receptor signalling complex. Science 291 2150–2155. [DOI] [PubMed] [Google Scholar]
- Derouet, D., Rousseau, F., Alfonsi, F., Froger, J., Hermann, J., Barbier, F., Perret, D., Diveu, C., Guillet, C., Preisser, L., et al. 2004. Neuropoietin, a new IL-6-related cytokine signaling through the ciliary neurotrophic factor receptor. Proc. Natl. Acad. Sci. 101 4827–4832. [DOI] [PMC free article] [PubMed] [Google Scholar]
- Fischer, M., Goldschmitt, J., Peschel, C., Kallen, K.J., Brakenhoff, J.P.J., Wollmer, A., Grötzinger, J., and Rose-John, S. 1997. A designer cytokine with high activity on human hematopoietic progenitor cells. Nat. Biotechnol. 15 142–145. [DOI] [PubMed] [Google Scholar]
- Gradl, G., Günther, R., and Sterrer, S. 1999. Fluorescence correlation spectrometry (FCS): Measuring biological interactions in microstructures. BioMethods 10 331–351. [Google Scholar]
- Grötzinger, J., Kernebeck, T., Kallen, K.-J., and Rose-John, S. 1999. IL-6 type cytokine receptor complexes: Hexamer or tetramer or both? Biol. Chem. 380 803–813. [DOI] [PubMed] [Google Scholar]
- Horsten, U. 1997. “Identifizierung einer region im signaltransduktor gp130 für die interaktion mit interleukin-6 (IL-6) im ternären IL-6/IL-6-rezeptor/ gp130-komplex.” Ph.D. thesis, Institute of Biochemistry, RWTH-Aachen, Germany.
- Hundhausen, C., Misztela, D., Berkhout, T.A., Broadway, N., Saftig, P., Hartmann, D., Fahrenholz, F., Postina, R., Matthews, V., Kallen, K.-J., et al. 2003. The disintegrin-like metalloproteinase ADAM 10 is involved in constitutive cleavage of CX3CL1 (fractalkine) and regulates CX3CL1-mediated cell-cell adhesion. Blood 102 1186–1195. [DOI] [PubMed] [Google Scholar]
- Jones, S. and Rose-John, S. 2002. The role of soluble receptors in cytokine biology: The agonistic properties of the sIL-6R/IL-6 complex. Biochim. Biophys. Acta 1592 251–264. [DOI] [PubMed] [Google Scholar]
- Jostock, T., Müllberg, J., Özbek, S., Atreya, R., Blinn, G., Voltz, N., Fischer, M., Neurath, M.F., and Rose-John, S. 2001. Soluble gp130 is the natural inhibitor of soluble IL-6R transsignaling responses. Eur. J. Biochem. 268 160–167. [DOI] [PubMed] [Google Scholar]
- Kallen, K.-J., Grötzinger, J., Lelièvre, E., Vollmer, P., Aasland, D., Renné, C., Müllberg, J., Meyer zum Büschenfelde, K.-H., Gascan, H., and Rose-John, S. 1999. Receptor recognition sites of cytokines are organized as exchangeable modules: Transfer of the LIFR binding site from CNTF to IL-6. J. Biol. Chem. 274 11859–11867. [DOI] [PubMed] [Google Scholar]
- Klouche, M., Bhakdi, S., Hemmes, M., and Rose-John, S. 1999. Novel path of activation of primary human smooth muscle cells: Upregulation of gp130 creates an autocrine activation loop by IL-6 and its soluble receptor. J. Immunol. 163 4583–4589. [PubMed] [Google Scholar]
- Koppel, D.E., Axelrod, D., Schlesinger, J., Elson, E.L., and Webb, W.W. 1976. Dynamics of fluorescence marker concentration as a probe of mobility. Biophys. J. 16 1315–1329. [DOI] [PMC free article] [PubMed] [Google Scholar]
- Krause, C.D., Mei, E., Xie, J., Jia, Y., Bopp, M.A., Hochstrasser, R.M., and Pestka, S. 2002. Seeing the light: Preassembly and ligand-induced changes of the interferon γ receptor complex in cells. Mol. Cell. Proteomics 1 805–815. [DOI] [PubMed] [Google Scholar]
- Kurth, I., Horsten, U., Pflanz, S., Dahmen, H., Kuster, A., Grotzinger, J., Heinrich, P.C., and Muller-Newen, G. 1999. Activation of the signal transducer glycoprotein 130 by both IL-6 and IL-11 requires two distinct binding epitopes. J. Immunol. 162 1480–1487. [PubMed] [Google Scholar]
- Livnah, O., Stura, E.A., Middleton, S.A., Johnson, D.L., Jolliffe, L.K., and Wilson, I.A. 1999. Crystallographic evidence for preformed dimers of erythropoietin receptor before ligand activation. Science 283 987–990. [DOI] [PubMed] [Google Scholar]
- Lust, J.A., Donovan, K.A., Kline, M.P., Greipp, P.R., Kyle, R.A., and Maihle, N.J. 1992. Isolation of an mRNA encoding a soluble form of the human interleukin-6 receptor. Cytokine 4 96–100. [DOI] [PubMed] [Google Scholar]
- Mackiewicz, A., Schooltink, H., Heinrich, P.C., and Rose-John, S. 1992. Complex of soluble human IL-6-receptor/IL-6 up-regulates expression of acute-phase proteins. J. Immunol. 149 2021–2027. [PubMed] [Google Scholar]
- Magde, D., Elson, E.L., and Webb, W.W. 1972. Thermodynamic fluctuations in a reacting system-measurement by fluorescence correlation spectroscopy. Phys. Rev. Lett. 29 704–708. [Google Scholar]
- März, P., Cheng, J.-C., Gadient, R.A., Patterson, P., Stoyan, T., Otten, U., and Rose-John, S. 1998. Sympathetic neurons can produce and respond to interleukin-6. Proc. Natl. Acad. Sci. 95 3251–3256. [DOI] [PMC free article] [PubMed] [Google Scholar]
- März, P., Otten, U., and Rose-John, S. 1999. Neuronal activities of IL-6 type cytokines often depend on soluble cytokine receptors. Eur. J. Neurosci. 11 2995–3004. [DOI] [PubMed] [Google Scholar]
- Mosley, B., De Imus, C., Friend, D., Boiani, N., Thoma, B., Park, L.S., and Cosman, D. 1996. Dual oncostatin M (OSM) receptors. Cloning and characterization of an alternative signaling subunit conferring OSM-specific receptor activation. J. Biol. Chem. 271 32635–32643. [DOI] [PubMed] [Google Scholar]
- Müllberg, J., Althoff, K., Jostock, T., and Rose-John, S. 2000. The importance of shedding of membrane proteins for cytokine biology. Eur. Cytokine Netw. 11 27–38. [PubMed] [Google Scholar]
- Palo, K., Mets, Ü., Jaeger, S., Kask, P., and Gall, K. 2000. Fluorescence intensity multiple distribution analysis: Concurrent determination of diffusion times and molecular brightness. Biophys. J. 79 2858–2866. [DOI] [PMC free article] [PubMed] [Google Scholar]
- Paonessa, G., Graziani, R., De Serio, A., Savino, R., Ciapponi, L., Lahm, A., Salvati, A.L., Toniatti, C., and Ciliberto, G. 1995. Two distinct and independent sites on IL-6 trigger gp 130 dimer formation and signalling. EMBO J. 14: 1942–1951. [DOI] [PMC free article] [PubMed] [Google Scholar]
- Pennica, D., Arce, V., Swanson, T.A., Vejsada, R., Pollock, R.A., Armanini, M., Dudley, K., Phillips, H.S., Rosenthal, A., Kato, A.C., et al. 1996. Cardiotrophin-1, a cytokine present in embryonic muscle, supports long-term survival of spinal motoneurons. Neuron 17 63–74. [DOI] [PubMed] [Google Scholar]
- Peters, M., Jacobs, S., Ehlers, M., Vollmer, P., Müllberg, J., Wolf, E., Brem, G., Meyer zum Büschenfelde, K.H., and Rose-John, S. 1996. The function of the soluble interleukin 6 (IL-6) receptor in vivo: Sensitization of human soluble IL-6 receptor transgenic mice towards IL-6 and prolongation of the plasma half-life of IL-6. J. Exp. Med. 183 1399–1406. [DOI] [PMC free article] [PubMed] [Google Scholar]
- Peters, M., Schirmacher, P., Goldschmitt, J., Odenthal, M., Peschel, C., Dienes, H.P., Fattori, E., Ciliberto, G., Meyer zum Büschenfelde, K.H., and Rose-John, S. 1997. Extramedullary expansion of hematopoietic progenitor cells in IL-6/sIL-6R double transgenic mice. J. Exp. Med. 185 755–766. [DOI] [PMC free article] [PubMed] [Google Scholar]
- Peters, M., Müller, A., and Rose-John, S. 1998. Interleukin-6 and soluble interleukin-6 receptor: Direct stimulation of gp130 and hematopoiesis. Blood 92 3495–3504. [PubMed] [Google Scholar]
- Pflanz, S., Kurth, I., Grotzinger, J., Heinrich, P.C., and Muller-Newen, G. 2000. Two different epitopes of the signal transducer gp130 sequentially cooperate on IL-6-induced receptor activation. J. Immunol. 165 7042–7049. [DOI] [PubMed] [Google Scholar]
- Rigler, R. and Widengren, J. 1990. Ultrasensitive detection of single molecules by fluorescence correlation spectroscopy. Bioscience 40 180–183. [Google Scholar]
- Rigler, R., Mets, Ü., Widengren, J., and Kask, P. 1993. Fluorescence correlation spectroscopy with high count rate and low background—Analysis of translational diffusion. Eur. Biophys. J. 22 169–175. [Google Scholar]
- Rose-John, S. 2001. Coordination of interleukin-6 biology by membrane bound and soluble receptors. Adv. Exp. Med. Biol. 495 145–151. [DOI] [PubMed] [Google Scholar]
- ———. 2002. GP130 stimulation and the maintenance of stem cells. Trends Biotechnol. 20 417–419. [DOI] [PubMed] [Google Scholar]
- Rose-John, S. and Heinrich, P.C. 1994. Soluble receptors for cytokines and growth factors: Generation and biological function. Biochem. J. 300 281–290. [DOI] [PMC free article] [PubMed] [Google Scholar]
- Rüdiger, M., Haupts, U., Moore, K.J., and Pope, A.J. 2001. Single-molecule detection technologies in miniaturized high throughput screening: Binding for G protein-coupled receptors using fluorescence intensity distribution analysis and fluorescence anisotropy. J. Biomol. Screen 6 29–39. [DOI] [PubMed] [Google Scholar]
- Rufenach, C., Scheel, A., Sterrer, S., and Turner, R. 2002. Fluorescence correlation spectroscopy (FCS) and FCS-related confocal fluorimetric methods (FCS+plus): Multiple read-out options for miniaturized screening. In Integrated drug discovery technologies (eds. H-Y. Mei and A.W. Czarnik), pp. 247–261. dekker eBooks, New York.
- Sako, Y., Minoghchi, S., and Yanagida, T. 2000. Single-molecule imaging of EGFR signalling on the surface of living cells. Nat. Cell Biol. 2 168–172. [DOI] [PubMed] [Google Scholar]
- Sreerama, N. and Woody, R.W. 1994. Protein secondary structure from circular dichroism spectroscopy. Combining variable selection principle and cluster analysis with neural network, ridge regression and self-consistent methods. J. Mol. Biol. 242 497–507. [DOI] [PubMed] [Google Scholar]
- Taga, T. and Kishimoto, T. 1997. gp130 and the interleukin-6 family of cytokines. Annu. Rev. Immunol. 15 797–819. [DOI] [PubMed] [Google Scholar]
- Taga, T., Hibi, M., Hirata, Y., Yamasaki, K., Yasukawa, K., Matsuda, T., Hirano, T., and Kishimoto, T. 1989. Interleukin-6 triggers the association of its receptor with a possible signal transducer, gp130. Cell 58 573–581. [DOI] [PubMed] [Google Scholar]
- Toniatti, C., Cabibbo, A., Sporena, E., Salvati, A.L., Cerretani, M., Serafini, S., Lahm, A., Cortese, R., and Ciliberto, G. 1996. Engineering human interleukin-6 to obtain variants with strongly enhanced bioactivity. EMBO J. 15 2726–2737. [PMC free article] [PubMed] [Google Scholar]
- Viswanathan, S., Benatar, T., Rose-John, S., Lauffenburger, D.A., and Zandstra, P.W. 2002. Ligand/receptor signaling threshold (LIST) model accounts for gp130-mediated embryonic stem cell self-renewal responses to LIF and HIL-6. Stem Cells 20 119–138. [DOI] [PubMed] [Google Scholar]
- Ward, L.D., Howlett, G.J., Discolo, G., Yasukawa, K., Hammacher, A., Moritz, R.L., and Simpson, R.J. 1994. High affinity interleukin-6 receptor is a hexameric complex consisting of two molecules each of interleukin-6, interleukin-6 receptor, and gp-130. J. Biol. Chem. 269 23286–23289. [PubMed] [Google Scholar]
- Ward, L.D., Hammacher, A., Howlett, G.J., Matthews, J.M., Fabri, L., Moritz, R.L., Nice, E.C., Weinstock, J., and Simpson, R.J. 1996. Influence of interleukin-6 (IL-6) dimerization on formation of the high affinity hexameric IL-6.receptor complex. J. Biol. Chem. 271 20138–20144. [DOI] [PubMed] [Google Scholar]
- Waxman, E., Rusinova, E., Hasselbacher, C.A., Schwartz, G.P., Laws, W.R., and Ross, J.B. 1993. Determination of the tryptophan:tyrosine ratio in proteins. Anal. Biochem. 210 425–428. [DOI] [PubMed] [Google Scholar]
- Weiergräber, O., Hemmann, U., Kuster, A., Müller-Newen, G., Schneider, J., Rose-John, S., Kurschat, P., Brakenhoff, J.P., Hart, M.H., Stabel, S., et al. 1995. Soluble human interleukin-6 receptor. Expression in insect cells, purification and characterization. Eur. J. Biochem. 234 661–669. [DOI] [PubMed] [Google Scholar]
- Wölcke, J. and Ullmann, D. 2001. Miniaturized HTS technologies—uHTS. Drug Discovery Today 6 637–646. [DOI] [PubMed] [Google Scholar]
- Yamasaki, K., Taga, T., Hirata, Y., Yawata, H., Kawanishi, Y., Seed, B., Taniguchi, T., Hirano, T., and Kishimoto, T. 1988. Cloning and expression of the human interleukin-6 (BSF-2/IFN β 2) receptor. Science 241 825–828. [DOI] [PubMed] [Google Scholar]
- Zohlnhöfer, D., Graeve, L., Rose-John, S., Schooltink, H., Dittrich, E., and Heinrich, P.C. 1992. The hepatic interleukin-6 receptor. Down-regulation of the interleukin-6 binding subunit (gp80) by its ligand. FEBS Lett. 306 219–222. [DOI] [PubMed] [Google Scholar]