

Abstract
Solubility of proteins on overexpression in Escherichia coli is a manifestation of the net effect of several sequence-dependent and sequence-independent factors. This study aims to delineate the relationship between the primary structure and solubility on overexpression. The amino acid sequences of proteins reported to be soluble or to form inclusion bodies on overexpression in E. coli under normal growth conditions were analyzed. The results show a positive correlation between thermostability and solubility of proteins, and an inverse correlation between the in vivo half-life of proteins and solubility. The amino acid (Asn, Thr, Tyr) composition and the tripeptide frequency of the protein were also found to influence its solubility on overexpression. The amino acids that were seen to be present in a comparatively higher frequency in inclusion body-forming proteins have a higher sheet propensity, whereas those that are seen more in soluble proteins have a higher helix propensity; this is indicative of a possible correlation between sheet propensity and inclusion body formation. Thus, the present analysis shows that thermostability, in vivo half-life, Asn, Thr, and Tyr content, and tripeptide composition of a protein are correlated to the propensity of a protein to be soluble on overexpression in E. coli. The precise mechanism by which these properties affect the solubility status of the overexpressed protein remains to be understood.
Keywords: aliphatic index, instability index, solubility index, thermostability, tripeptide frequency, inclusion body
Overexpression of recombinant proteins is needed both in industry and in research for the production of proteins with pharmaceutical, structural, and/or biochemical relevance (Clark 1998). Escherichia coli, the preferred host for over-expressing recombinant proteins, is fast and inexpensive to cultivate, easy to handle and manipulate genetically, and generally yields high levels of recombinant proteins (Rudolph 1990; Clark 1998). However, a significantly large number of proteins form insoluble inclusion bodies when overexpressed in E. coli; these have to be solubilized and re-folded to obtain the functional protein (Rudolph 1990; Rudolph and Lilie 1996; Pedelacq et al. 2002; Tsumoto et al. 2003; Tresaugues et al. 2004).
Several factors have been suggested to contribute to inclusion body formation in E. coli: (1) high local concentration of the overexpressed protein; (2) reducing environment in the cytoplasm due to high levels of glutathione preventing disulfide bond formation (Makrides 1996; Lilie et al. 1998); (3) lack of posttranslational modifications such as glycosylation which could improve protein’s solubility (Zhang et al. 1998); (4) improper interactions with chaperones and other proteins participating in folding in vivo (Mogk et al. 2002); (5) increased aggregation of folding intermediates due to their limited solubility (King et al. 1996); (6) intermolecular cross-linking via disulfides—however, proteins without cysteine residues also form aggregates, e.g., apomyoglobin, lactamase, and interferon; (7) kinetics of protein translation in the context of rare codons (Makrides 1996; Komar et al. 1999; Cortazzo et al. 2002); (8) N-terminal (Oswald et al. 1994; Ramachandiran et al. 2000; Doray et al. 2001; Boeggeman et al. 2003) and C-terminal sequences (Sati et al. 2002); (9) presence of fusion tags or coexpression with molecular chaperones (Stevens 2000).
Solubility on overexpression of some proteins has been found to be altered by certain mutations. Individual mutations differ in the extent to which they influence the solubility on overexpression (Table S1). For example, the W131A and V165K mutants of human HIV type 1 integrase are only marginally more soluble, whereas the F185K is significantly more soluble relative to the wild-type under the same conditions of overexpression (Jenkins et al. 1995). Many of these types of mutations are identified by random mutagenesis procedures (see, for example, Lin et al. 1999). Systematic replacement of hydrophobic residues has also been attempted, but only some of these mutations manifested in improved solubility (Jenkins et al. 1995; Murby et al. 1995; Malissard and Berger 2001). Mutations involving substitution of less polar residues with more polar ones, identified by multiple sequence alignment of the insoluble protein with related soluble proteins (Malissard and Berger 2001) or predicted solvent accessibilities (Dale et al. 1994) have also been attempted, but only some mutations have manifested in improved solubility.
It is clear from these mutation studies that the primary structure of a protein is somehow related to the protein’s propensity to form inclusion bodies under normal conditions of overexpression. However, the identification of the various sequence-dependent features that influence solubility of a protein is incomplete. This study aims to delineate the relationship between the primary structure and solubility on overexpression. Proteins reported to be soluble or to form inclusion bodies on overexpression in E. coli under normal growth conditions were identified and classified as data sets S and I, respectively. The sequences of proteins in these data sets were subjected to statistical analyses to identify features that are unique to proteins of a specific data set. The analyses revealed that the propensity to be soluble on overexpression is correlated to certain sequence-dependent features such as aliphatic index, instability index, and frequency of occurrence of Asn, Thr, Tyr, dipeptides, and tri-peptides.
Results and Discussion
Molecular weight and net charge
The mean and median values of molecular weight for proteins of data set I are comparable to the corresponding values for proteins of data set S (Table S2). This implies that the propensity to form inclusion bodies is not correlated with the size of the protein (Table S3). The mean net charge is higher in data set S proteins compared to data set I proteins. The inverse correlation between net negative charge and inclusion body formation was reported previously (Davis et al. 1999). However, the difference in the net charge is not statistically significant (Table S3).
Aliphatic index
The aliphatic index AI is directly related to the mole fraction of Ala, Ile, Leu, and Val in the protein (Ikai 1980). The AI of proteins from thermophilic bacteria was found to be significantly higher than that of ordinary proteins and hence, it can serve as a measure of thermostability of proteins (Ikai 1980). The mean and median values of aliphatic index are higher for data set S proteins compared to those of data set I (Table S2), and this difference is statistically significant (Table S3).
It has been reported that the substitutions Gly→Ala, Ser→Thr, Lys→Arg, Asp→Glu, Met→Ala/Leu, Cys→Ile/ Ala/Val, and Trp→Tyr increase the thermostability of proteins (Gromiha et al. 1999). With the exception of Thr and Tyr, all the residues that favor an increase in thermostability, viz., Ala, Arg, Glu, Ile, Leu, and Val, are present in a higher frequency in data set S than in data set I (i.e., FA,S > FA,I); conversely, residues Asp, Cys, Gly, Lys, Met, Ser, and Trp are present in a higher frequency in data set I compared to data set S (i.e., FA,I > FA,S) (Table 1).
Table 1.
Frequencies of occurrence and secondary structure propensities of amino acids in data sets I and S
| Data set S | Data set I | Propensityb | |||||
| Residue | FA,S | DA,S | FA,I | DA,I | Natural frequencya | Helix | Sheet |
| Disorder-promoting residuesc | |||||||
| Ala | 9.0 | 6 | 8.3 | 3 | 7.8 | 1.46 | 0.78 |
| Arg | 5.3 | 0 | 4.8 | −5 | 5.3 | 1.24 | 0.88 |
| Gln | 4.0 | 1 | 3.8 | −2 | 3.9 | 1.34 | 0.82 |
| Glu | 6.8 | 1 | 5.4 | −8 | 6.6 | 1.37 | 0.69 |
| Lys | 5.7 | −2 | 6.0 | 0 | 5.9 | 1.14 | 0.78 |
| Pro | 4.9 | 0 | 4.7 | −1 | 4.9 | 0.40 | 0.32 |
| Gly | 7.7 | 4 | 8.1 | 7 | 6.9 | 0.43 | 0.69 |
| Ser | 6.1 | −5 | 7.1 | 1 | 6.9 | 0.76 | 0.88 |
| Order-promoting residuesc | |||||||
| Asn | 3.6 | −6 | 4.3 | 1 | 4.2 | 0.72 | 0.64 |
| Cys | 1.1 | −15 | 1.5 | −2 | 1.6 | 0.75 | 1.26 |
| Ile | 5.9 | 0 | 5.0 | −7 | 5.9 | 1.07 | 1.65 |
| Leu | 9.4 | −1 | 8.8 | −4 | 9.6 | 1.36 | 1.13 |
| Phe | 3.7 | −4 | 3.8 | −2 | 4.0 | 0.97 | 1.49 |
| Trp | 1.0 | −5 | 1.4 | 9 | 1.2 | 1.05 | 1.39 |
| Tyr | 2.9 | −2 | 3.8 | 9 | 3.1 | 0.95 | 1.47 |
| Val | 7.8 | 6 | 6.9 | 1 | 6.7 | 0.94 | 1.89 |
| Othersc | |||||||
| Asp | 5.2 | −1 | 5.7 | 3 | 5.3 | 0.83 | 0.51 |
| His | 2.3 | 1 | 2.2 | −2 | 2.3 | 0.90 | 1.05 |
| Met | 2.2 | −3 | 2.3 | −2 | 2.4 | 1.25 | 1.10 |
| Thr | 5.2 | −2 | 6.0 | 4 | 5.5 | 0.76 | 1.21 |
The FA,X and DA,S values are expressed as ×100.
a The natural frequency corresponds to the occurrence of residues in the proteins present in the Swiss-Prot database.
b The propensity values were calculated from a set of 1091 nonredundant proteins; these values are taken from Table I of Kallberg et al. (2001).
c The classification of amino acids as “disorder-” and “order-” promoting is as per Tompa (2002) and Williams et al. (2001).
Thermolabile folding intermediates have been suggested to contribute to inclusion body formation by exhausting the in vivo supply of chaperonins, since they have been proposed to serve as chaperonin substrates (King et al. 1996). These observations, taken together with the higher aliphatic index for data set S proteins, suggest that an increase in the thermostability of the protein might favor an increase in its solubility and that thermostability and solubility on overexpression have a positive correlation.
Instability index
Proteins that have an in vivo half-life of less than 5 h (Rogers et al. 1986) have been shown to have an instability index of more than 40, whereas those that have an in vivo half-life of more than 16 h (Rogers et al. 1986) have an instability index of less than 40; the instability index can thus be used as a measure of in vivo half-life of a protein (Guruprasad et al. 1990).
In the present study, the instability index of the protein (IIP) was calculated by considering all the residues in the protein, and that of the N-terminal region (IIN) was calculated by considering only the N-terminal residues. We observed that the mean and median values of IIP and IIN are higher in data set S proteins compared to data set I proteins (Table S2). However, the increase in instability index for the entire protein IIP is less pronounced when compared to the instability index of the N-terminal region IIN. Although statistically the difference in the instability indices are not significant (Table S3), data set S proteins seem to have a shorter in vivo half-life when compared to data set I proteins.
It was reported that the lifetime of partially folded intermediates influence the propensity of the protein to aggregate since (1) longer-lived partially folded intermediates have a greater chance of interaction with other partially folded intermediates, and (2) the longer-lived partially folded intermediates would exhaust the available molecular chaperones that otherwise prevent protein aggregation by interacting with them in an in vivo system (Fink 1998). It was suggested that protein aggregates are formed from partially unfolded proteins that are not refolded by chaperones or degraded by proteases (Rosen et al. 2002).
As mentioned earlier, the mean instability index of the N terminus (IIN) of data set S proteins is higher than that for data set I proteins (Table S2). It was found that small determinants in the N terminus affect the stability of a protein and thereby influence its half-life (Zaccaria et al. 1998). The effect of the N terminus on the solubility status on overexpression was also seen in the case of chimeric human liver aldehyde dehydrogenases (Ni et al. 1999); the cytosolic and mitochondrial isozymes share only 15% identity in the first 21 residues (70% identity overall). Two chimeric enzymes, wherein each chimera had the first 21 residues from one isozyme and the remaining residues from the other, were made. The chimera that had the first 21 residues from mitochondrial isozyme was soluble on overexpression, but the second chimera was insoluble; solubility could be restored by making point mutations within the first 21 residues (Ni et al. 1999).
The influence of the N terminus on the solubility status of the protein on overexpression is also evident from the observation that certain peptide/protein tags increase the solubility of the recombinant protein when fused at the N terminus (Forrer and Jaussi 1998; Davis et al. 1999; Kapust and Waugh 1999; Fox et al. 2001; Zhou et al. 2001). However, not all fusion tags are equally effective in promoting the solubility of a given protein (Hammarstrom et al. 2002). For example, maltose-binding protein was found to be far more effective than glutathione S-transferase and thioredoxin in solubilizing six diverse proteins that normally accumulate in an insoluble form (Kapust and Waugh 1999). Conversely, the same fusion protein/tag can have widely different effects on the solubility of different proteins (Cha et al. 2000). In some cases, the fusion protein/tag has had no effect on solubility but merely increased the efficiency of recovery (Sachdev and Chirgwin 1998).
Residue composition and secondary structure propensity
Considering the frequencies of occurrence of amino acids together with their secondary structure propensities shows that the residues with a higher helix propensity occur more frequently in data set S proteins; those with a higher sheet propensity occur more frequently in data set I proteins (Table 1). Exceptions to this are Asn, Asp, Lys, and Met (higher helix propensity but FA,S < FA,I) and His, Ile, and Val (higher sheet propensity but FA,I < FA,S). The predominance of residues with a higher sheet propensity in data set I proteins gains significance in light of the results from Raman spectroscopic studies of RTEM β-lactamase which showed that proteins in the inclusion body have a lesser amount of α-helix and a higher amount of β-sheet than the native protein (Przybycien et al. 1994). Such a change in secondary structure was regardless of whether the inclusion body is localized in the cytoplasm or the periplasmic space. An increase in the growth temperature from 37° to 42°C led to a further reduction in α-helix content and an increase in β-sheet content. However, the secondary structural composition of human interleukin-1β in inclusion body as determined by attenuated total reflectance FTIR spectroscopy was found to be very similar to that of the native protein (Oberg et al. 1994). This reinforces the inference that the reasons for and the mechanism of formation of inclusion body are not the same for all the proteins (Wetzel et al. 1991).
The residues Lys, Ser, Asn, Cys, Phe, Trp, Tyr, Asp, Met, and Thr show a higher negative DA,S (deviation from the natural frequency of occurrence) values compared to the corresponding values for DA,I (Table 1), indicating that these residues occur with a significantly lower frequency in data set S proteins compared to the natural frequency. In addition, the frequency of occurrence of these residues in data set I is higher compared to that in data set S (i.e., FA,I > FA,S; Table 1). The differences in the frequency of occurrence of these residues in proteins of the two data sets were found to be statistically significant only for Asn, Thr, and Tyr. Apart from these three residues, the amino acid Glu was found to be present at a significantly higher frequency in data set S compared to data set I. It seems that the higher net negative charge in soluble proteins may be due to the higher composition of Glu in soluble proteins, since the frequencies of occurrence of the other charged amino acids do not seem to differ significantly between the two data sets (Table S3).
Dipeptide and tripeptide composition
The dipeptide and tripeptide composition of data set S proteins probably favors the overexpression of these proteins in E. coli in the soluble form. To test this, the frequencies of occurrence of the 400 dipeptides (FAB,S) and of the 8000 tripeptides (FABC,S) in data set S proteins were calculated. The deviations DAB,S and DABC,S from the natural frequencies were also calculated; a positive DXYZ,S implies that the tripeptide XYZ favors solubility as it is present in higher frequency in data set S compared to all the proteins in the Swiss-Prot database. DAB,S and DABC,S were used to calculate the dipeptide and tripeptide scores (SDP and STP), which are essentially the average dipeptide and tripeptide deviations for the protein. We found that the differences in the dipeptide and tripeptide scores of proteins of data sets S and I are statistically significant (Table S3). This suggests that the dipeptide or tripeptide composition can be used as a yardstick to determine the solubility on overexpression. The dipeptide and tripeptide scores were used since the use of individual dipeptide and tripeptide frequencies increases the number of features enormously (400 features from dipeptides and 8000 features from tripeptides). For a protein rich in tripeptides that have positive values for the deviations, the tripeptide score will be high, implying that the tripeptide composition is similar to that of the soluble proteins and vice versa. It should be noted that many tripeptides are either underrepresented or not represented at all in data set S owing to its small size; the resultant bias can be resolved only by populating the data set S with as many proteins as possible.
The association between the tripeptide frequency and the solubility of a protein on overexpression is probably due to the effect of tripeptide composition on folding kinetics, which is known to be strongly sequence-dependent (Chan and Dill 1994); the slow folding stage is known to be more sequence-dependent than the fast stage (Socci and Onuchic 1994). It was also proposed that sequences that encode large energy gaps are fast folders since they often have fewer deep kinetic traps (Shakhnovich and Gutin 1993). The specific role of the tripeptides in encoding energy gaps in kinetics of protein folding needs to be investigated.
Two approaches were used to test the validity of the observed correlation between the sequence-dependent features and the propensity of a protein to be soluble on over-expression: discriminant analysis and solubility index computation.
Discriminant analysis
Discriminant analysis was carried out using the software SPSS v.10.0 to identify features that significantly vary in the two data sets. For this, the proteins of data sets I (105 proteins), S (25 proteins), and T (40 proteins: 25 inclusion body-forming and 15 soluble) were pooled together and analyzed for the significance of the following parameters: molecular weight; net charge; aliphatic index (AI); instability index of the protein IIP and of the N terminus IIN; frequency of occurrence of Asn (FN), Thr (FT), and Tyr (FY); and dipeptide and tripeptide scores (SDP and STP).
The analyses were done by stepwise method and forced-entry method, and the prediction accuracy was determined by leave-one-out cross-validation. In the stepwise method, the tripeptide score was found to be the only significant variable contributing to the classification. By this method, all the 130 inclusion body-forming proteins are predicted correctly. Among the soluble proteins, only those which were used to derive the SDP and STP values were classified correctly. In the forced-entry method, all the variables were included in the classification function. In this case, 129 of the 130 inclusion body-forming proteins are classified correctly. Of the 40 soluble proteins, 26 were predicted correctly, and this includes all the 25 proteins which were used to derive the SDP and STP values. A cross-validation accuracy of 91% was observed by both methods.
The use of the dipeptide and tripeptide scores can interfere with the classification results, since they are derived from a subset of the data set. Hence, discriminant analysis was repeated without using the dipeptide and tripeptide scores of the proteins and retaining all the other parameters. In the forced-entry method, 78 of the 130 inclusion body-forming proteins and 28 of the 40 soluble proteins were classified accurately. In the stepwise method, aliphatic index and Asn and Thr composition of proteins were found significant; 79 of the 130 inclusion body-forming proteins and 28 of the 40 soluble proteins were classified correctly. A cross-validation accuracy of 62% was observed by both methods.
The above discriminant analysis performs a binary classification of proteins, i.e., either as soluble or as inclusion body-forming. However, some fraction of inclusion body-forming protein is known to be expressed in soluble form, and vice versa. When such quantitative data become available, a ternary classification can be performed by including proteins of intermediate solubility. Discriminant analysis works well on distributions that are normal, in identifying the independent variables/parameters that can help in classification of the data sets, whereas the Mann-Whitney test is a nonparametric test and identifies the parameters that vary significantly between two data sets. This could be the reason that certain parameters identified to be deviating significantly between the two data sets by the Mann-Whitney test may not be regarded as significant for classification of the data by discriminant analysis.
Although the problem of overfitting due to the bias introduced by proteins that contribute to the dipeptide and tripeptide scores is minimized by removing these parameters from the classification algorithm, the prediction function becomes less sensitive to the sequence information stored in proteins. For the same reason, such a prediction function will not be able to distinguish the solubility status between proteins, which are shown to exhibit drastic differences in solubility by virtue of point mutations in them. Hence, it is essential to incorporate the additional information stored in the protein sequence by means of its dipeptide and tripeptide scores. Since statistical classifiers will suffer from the bias introduced by these parameters, it is necessary to develop a heuristic algorithm which can handle these parameters in a manner such that overfitting is minimal.
Solubility index computation
In this heuristic approach, a solubility index SI was computed for the validation of the observed correlation between sequence-dependent properties and solubility. Among the various sequence-based features discussed in the study, the parameters tripeptide score, aliphatic index, instability index of the N terminus, and frequency of occurrence of the amino acids Asn, Thr, and Tyr gave the best classification accuracy and were therefore incorporated in generating the solubility index. The use of tripeptide score makes SI-based predictions biased for reasons stated earlier; nevertheless the tripeptide score was considered for calculating SI to make SI more sensitive to point mutations. Although the parameter IIN was not found to be statistically significant (Table S3) (all the other parameters considered for calculating SI show statistically significant deviation between data sets S and I), we found that it improves the prediction accuracy slightly when incorporated in the SI calculation, which is as follows:
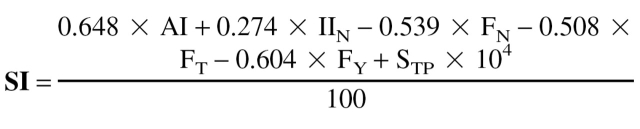 |
The coefficient for the tripeptide score was fixed arbitrarily based on trial and error procedures; for other variables, the coefficients were obtained from the discriminant analysis (forced-entry method) done on the training data sets S and I alone without considering the dipeptide and tripeptide scores. A protein is predicted to have a high propensity to be overexpressed in a soluble form if the solubility index SI is ≥ 1 and vice versa.
Validation of the solubility index
Self-consistency test for data set I
The solubility indices were calculated for all the proteins of data set I (Table 2). Among the proteins of data set I, 30% and 70% of proteins have high and low intrinsic potential, respectively, for solubility on overexpression. The 30% of data set I proteins which have a high intrinsic potential for solubility are likely to be soluble on overexpression in E. coli by point mutations. All the proteins of data set S have a high intrinsic potential for solubility on overexpression (SI ≥ 1); this is to be expected since these 25 proteins of data set S were used in computing the deviations DABC,S (which in turn influences the tripeptide score STP).
Table 2.
Percentage of proteins in various data sets with different intrinsic potentials for solubility on overexpression
| Percentage of proteins | ||||
| SI-based predictions | WH scheme predictionsa | |||
| Data set | High intrinsic potential | Low intrinsic potential | Soluble | Insoluble |
| S | 100 | 0 | 32 | 68 |
| I | 30b | 70 | 22 | 78 |
| T-soluble | 60 | 40 | 13 | 87 |
| T-insoluble | 36 | 64 | 28 | 72 |
a By Davis et al. (1999); The solubility of the protein is predicted based on a canonical value CV, calculated CV = [15.43 × (N + G + P + S) ÷ n] -[(29.56 × |(R + K) - (D + E) ÷ n) - 0.03|] where N, G, P, S, R, K, D, and E represent the number of Asn, Gly, Pro, Ser, Arg, Lys, Asp, and Glu residues in the protein, respectively, and n is the number of amino acids in the protein. If the difference between CV and CV′ (a discriminate whose value has been set to 1.71) is positive, the protein is predicted to be insoluble, and if the difference is negative, the protein is predicted to be soluble.
b These proteins may be regarded as potential candidates for mutations studies for enhancing solubility.
Jack-knife test and bootstrapping for proteins of data set S
In order to evaluate the performance of SI on the 25 proteins of data set S, a jack-knife test was performed by recomputing the deviations DABC,S of the 8000 tripeptides by excluding one of the proteins of data set S. The newly computed deviations were used to compute the tripeptide score STP and the solubility index of the left-out protein. This was repeated 25 times, leaving out each of the 25 proteins of data set S. From this analysis 17 proteins of data set S were found to have a high intrinsic potential for solubility (i.e., SI ≥1), and the remaining eight proteins were found to have a low intrinsic potential for solubility.
Bootstrapping was also done for these 25 proteins. Five hundred different data sets, each consisting of 25 proteins randomly taken from the data set S proteins allowing deletions, substitutions, and repetitions of the 25 proteins, were created. The average DABC,S of these 500 data sets were then used to calculate the tripeptide scores. Alternatively, the DABC,S was computed from different sets of 25 proteins from the 40 soluble proteins, and the prediction accuracy based on SI on the left-out 15 proteins was assessed. Both approaches did not give any significant differences in the prediction accuracy. We believe that the only possible method to reduce the error due to overfitting is by populating data set S with soluble proteins as more information becomes available with time.
Analysis of the data set T
The test data set T has 40 proteins, 15 of which are soluble on overexpression in E. coli; the rest form inclusion bodies. None of these proteins are part of data sets S or I and hence were not used in deriving the parameters that were incorporated in calculation of the SI. Nine of the 15 proteins known to be overexpressed in the soluble form were found to have high intrinsic potential for solubility, and six have low intrinsic potential for solubility. Among the 25 inclusion body-forming proteins, 16 proteins were predicted to have a low intrinsic potential for solubility on overexpression, and nine were predicted to have high intrinsic potential for solubility (Table 2).
Solubility indices for proteins of the point mutation data set PM
The solubility on overexpression in E. coli of proteins belonging to data set PM has been found experimentally to be altered by a point mutation (Table S4). The solubility index SI of the mutant is expected to be higher than that of the wild type in cases where the mutation resulted in an increase in solubility; for mutations which resulted in a decrease in solubility, the SI of the mutant should be less than that of the wild type. Due to the nonavailability of the quantitative measure of solubility of the proteins in data sets S and I, the estimation of the increase in solubility index needed to bring about an increase in solubility of the protein was not attempted in this study. The expected behavior, in a qualitative sense, was observed for 13 of the 16 mutants of data set PM (Table S4).
Some inclusion body-forming proteins have a high intrinsic potential for solubility (i.e., SI ≥1). Inclusion body formation in such cases is presumably due to other factors such as the 3D structure of the native form, folding intermediates, etc. Point mutations in this class of proteins may render them soluble on overexpression (Table 2). Putative mutations must be identified based on systematic computational replacement of hydrophobic residues, nonpolar→polar substitutions based on multiple sequence alignments, or predicted solvent accessibility of residues for proteins with known 3D structure; however, in each case, the mutant should get a higher solubility index compared to the wild type (Table S4).
Comparison of solubility indices with the predictions by Wilkinson-Harrison (WH) scheme (Davis et al. 1999)
Based on a statistical analysis of the composition of 81 proteins that do and do not form inclusion bodies in E. coli grown at 37°C, it was observed that inclusion body formation is strongly correlated to charge average and turn-forming residue fraction (Wilkinson and Harrison 1991). The solubility prediction scheme derived from this observation was further modified (henceforth referred to as WH scheme for brevity) to identify E. coli proteins which have highest potential for solubility on overexpression (Davis et al. 1999). Three proteins—NusA, GrpE, and BFR—were predicted to be soluble (>90% probability) when overexpressed in E. coli; it was shown experimentally that the inclusion body-forming hIL-3 is in the soluble fraction when overexpressed as a fusion of any of these three proteins (Davis et al. 1999).
The solubility status on overexpression of the proteins in data sets S, I, T, and PM were predicted by the WH scheme for comparison with predictions based on solubility index. The WH scheme predicts that 78% of data set I proteins and 68% of data set S proteins are insoluble (Table 2). Eighteen (72%) of the 25 inclusion body-forming proteins of data set T were predicted to be insoluble; however, only two (13%) of the 15 soluble proteins of data set T were predicted to be soluble by the WH scheme. From these results, it appears that the WH scheme is more sensitive in identifying insoluble proteins. In the case of proteins of data set PM, the WH scheme correctly predicts the effect (increase or decrease in solubility) of mutations in only six of the 16 cases (data not shown).
The solubility of the inclusion body-forming hIL-3 when overexpressed with the fusion tags NusA, BFR, GrpE, and thioredoxin was found to be 97%, 47%, 71%, and 8%, respectively (Davis et al. 1999). The WH scheme predicted equal solubility for both the GrpE and BFR fusions of hIL-3 (Table S5). In contrast, the solubility index values predict the BFR/hIL-3 fusion protein to have low potential for solubility and the GrpE/hIL-3 fusion protein to have high intrinsic potential for solubility. The predictions based on the solubility index for the NusA and GrpE fusions of hIL-3 are in consonance with the experimental observations (Table S5).
Apart from the sequence composition, the possible role played by NusA and GrpE proteins in correcting translational misfolding cannot be ignored. NusA (N-utilizing substance A) increases the dwell time of RNA polymerases at certain pause sites (Yakhnin and Babitzke 2002). It has also been suggested that translational stalling prevents irreversible aggregation of proteins by increasing the time for chaperone synthesis, during which period the protein is retained in a relatively protected environment of the translating ribosome (Lesley et al. 2002). It is also known that GrpE is part of the Hsp70 chaperone family and is induced by translational misfolding. Along with DnaK and DnaJ proteins, it interacts with the misfolded proteins in an ATP-dependent repair process, thereby preventing protein aggregation (Lesley et al. 2002; Mogk et al. 2002).
Conclusions
A large number of proteins, including host proteins, form inclusion bodies when overexpressed in E. coli. Several studies have focused on ways of tackling the problem posed by inclusion body formation by exploration of alternative host systems, by optimization of host strain and/or conditions of overexpression, etc. (Schein and Noteborn 1988; Tandon and Horowitz 1988; Rudolph 1990; Schein 1990; Katzav-Gozansky et al. 1996; Clark 1998; Georgiou and Valax 1999; Carrio and Villaverde 2001; Nygaard and Harlow 2001; Winter et al. 2001; Chen et al. 2002). As part of the structural genomics initiatives, high-throughput screening systems have been devised to select only those proteins/ conditions which do not result in inclusion bodies (Lin et al. 1999; Knaust and Nordlund 2001; Wigley et al. 2001; Pedelacq et al. 2002; Shih et al. 2002; Waldo 2003; Folkers et al. 2004).
Relatively fewer efforts have been made to understand why proteins form inclusion bodies on overexpression. It has been observed that under identical conditions of overexpression, certain point mutants display a dramatically different solubility status compared to the wild-type protein (Wetzel et al. 1991; Jenkins et al. 1995; Pedelacq et al. 2002; Timson and Reece 2003). This reinforces the observations that the primary structure plays a major role in determining the solubility of a protein on overexpression.
From an analysis of 81 proteins overexpressed in E. coli at 37°C, five factors—viz., charge average, turn-forming residue (Asn, Gly, Pro, and Ser) content, cysteine and pro-line fraction, hydrophilicity, and number of residues (MW)—were initially thought to play a role in determining solubility on overexpression (Wilkinson and Harrison 1991). Later analysis revealed that only charge average and turn-forming residue content alone are the determinants of solubility (Davis et al. 1999). However, these parameters are not able to account for the observed solubility status of many overexpressed proteins (Tables 2, S5). The present analysis reveals that thermostability, in vivo half-life, Asn, Thr, and Tyr content, and the tripeptide composition of a protein are correlated to the propensity of a protein to be soluble on overexpression in E. coli under normal growth conditions. The precise mechanism by which these properties affect the solubility status of the overexpressed protein remains to be understood.
Solubility of proteins has been a bottleneck for a variety of studies and has thus attracted much attention. Schein (1990) noted that the amino acids vary with respect to the solubility and affinity for water; hence the “hydrophobic nature” of the protein influences the extent of solubility in aqueous solvents. It was observed that solubility of a protein in water could be modified by alterations in their primary structure, e.g., solubility of α-casein and E. coli penicillin binding protein 5 could be improved by deletion of a stretch of residues; in both proteins, the deleted stretch had an FF dipeptide. Solubility in aqueous solvents was observed to be enhanced by replacement of Asn at position 21 with Gly, Ser, Thr, Asp, His, and Arg in insulin and substituting a Thr for Cys at position 107 of yeast cytochrome c (Schein 1990), suggesting that certain amino acids are more critical determinants of solubility of specific proteins.
More recently, statistical analyses, viz., decision trees (Bertone et al. 2001), random forest analysis (Goh et al. 2004), and linear correlation coefficients (Luan et al. 2004), have been performed as part of structural genomics initiatives to identify soluble proteins for structure determination. Luan et al. (2004) found that of the 34 factors that they considered, hydrophobicity is the major determinant of solubility on expression in E. coli of C. elegans proteins; they also found that MW, rare codon usage, and pI are not correlated to solubility. Bertone et al. (2001) also considered a large number (42) of factors and found that more number of acidic residues and fewer hydrophobic stretches are the major determinants of solubility of proteins from Methanobacterium thermoautotrophicum when expressed in E. coli; the length of the protein (i.e., MW) was also found to be a significant factor. Goh et al. (2004) found that serine composition is the highest-ranked determinant of solubility from an analysis of 27,000 proteins from 120 organisms.
It is clear that the factors identified by the various studies are not all the same. The reasons for this apparent disagreement are that
Solubility depends on various sequence-independent factors such as concentration and environment, i.e., in vivo or in water.
Solubility is the net result of various factors, and each of these factors are important to different extents in different proteins and contexts (Wetzel et al. 1991). This is evident by the absence of any similarities in the point mutations that alter the status of solubility on overexpression (Dale et al. 1994; Malissard and Berger 2001).
Viewing insolubility as an off-pathway reaction leading to aggregation, even the structures of the folding intermediates are critical determinants of solubility (King et al. 1996). In the absence of such structural information, predictive algorithms on solubility of a protein based on primary structure alone may not give high accuracy.
The absence of dramatic differences in many of sequence-based parameters between data sets S and I is probably because the solubility on overexpression in E. coli does not have any relevance to the evolution of protein sequences. Hence, it is unlikely that features that favor solubility on overexpression in E. coli dominate in any particular family/group of proteins.
Materials and Methods
Databases and Web tools
PubMed, available at the National Center for Biotechnology Information (NCBI; http://www.ncbi.nlm.nih.gov), was used to access the MEDLINE bibliographic database. The ProtParam tool of the ExPASy proteomics server of the Swiss Institute of Bioinformatics (http://us.expasy.org/tools/protparam.html) was used for determining the molecular weight of proteins. The NCBI database was used for procuring protein sequences for the various data sets created in this study. The Swiss-Prot database comprised of 162,780 proteins (Oct. 11, 2004; release 45.7) was used to calculate the natural frequency of occurrence of amino acids, dipeptides, and tripeptides.
Creation of data sets
A combination of the keywords soluble, inclusion bodies, E. coli, and overexpression was used to search PubMed to identify proteins that have been overexpressed in E. coli under normal growth conditions. Here, normal growth conditions imply 37°C, no solubility-enhancing or purification-facilitating fusion tags, or chaperone coexpression, absence of small molecule additives (L-arginine, sorbitol, glycylglycine, etc.), no prior heat-shock treatment, etc. Many of the proteins overexpressed in E. coli had an N terminus His tag, and these proteins were not used in creation of the data sets since His tags have been reported to influence the solubility of proteins on overexpression (Woestenenk et al. 2004). Literature for all the selected proteins was checked to ensure that the protein forms an inclusion body or is in the soluble form on overexpression in E. coli. A certain ambiguity was noticed in the way different authors have used the term “soluble on overexpression in E. coli.” Proteins that are “expressed mainly in the soluble form” and those that are “also expressed in the soluble fraction” have both been regarded as soluble in certain scientific communications. In view of this, only those proteins that have been explicitly stated to be expressed mainly in the soluble form were considered.
It was also noticed that for some proteins, only the database sequence is available and the changes in the N terminus that might have arisen as a consequence of cloning experiments are not known. In a few other cases, several entries were found in the database with the same protein name, and it was not clear which one of these sequences is considered for overexpression studies. All such ambiguous proteins were ignored while creating data set S (Table S6). This resulted in only 40 hits for soluble proteins; of these, 25 were assigned to soluble data set S, and the remaining 15 were assigned to the test data set T (Table S6).
A large number of hits were obtained for proteins that form inclusion bodies when overexpressed in E. coli; this is not surprising since the number of proteins which form inclusion bodies is much higher than that which are in soluble fraction. Of the hits that were obtained, 105 proteins were arbitrarily chosen and assigned to inclusion body data set I and 25 were assigned to test data set T (Table S6). Thus, the test data set T consists of 40 proteins that are not part of either data set I or S. Of the four proteins that constituted data set PM, three form inclusion bodies and one is soluble on overexpression in E. coli. These proteins were selected since it was reported that the mutants of these proteins show altered solubility with respect to the wild-type protein (Table S6).
Definition of the N-terminal residues
The definition of N terminus available in literature is highly context-dependent. The first 20 residues were considered as the N terminus of a protein in the present study, and the choice was based on the studies of human liver aldehyde dehydrogenases (Ni et al. 1999).
Calculation of net charge
The net charge of a protein was calculated as the difference between the total number of positively (Arg + Lys) and negatively (Asp + Glu) charged residues of the protein (Uversky et al. 2000).
Calculation of instability index
The instability index II was calculated as
 |
where L is the number of amino acids in the protein and DIWV is the instability weight value for the dipeptide xi yi+1; this index has been used to predict whether a protein is stable (II<40; proteins that have an in vivo half-life of >16 h) or unstable (II >40; proteins that have an in vivo half-life of <5 h; Guruprasad et al. 1990).
Calculation of aliphatic index
The aliphatic index AI was calculated as
 |
where X(Ala), X(Val), X(Ile), and X(Leu) are mole percent (i.e., 100 × mole fraction) of Ala, Val, Ile, and Leu in the protein. The coefficients a (= 2.9) and b (= 3.9) are the relative volumes of valine and of leucine/isoleucine side chains to that of alanine side chain; this index has been suggested as a positive factor for the increase of thermostability of globular proteins (Ikai 1980).
Calculating the frequencies of occurrence of amino acid residues
The frequency of occurrence FA,X of an amino acid residue A in a data set X (X = I, S) was calculated as
 |
where NA,X is the total occurrence of residue A in data set X, and Tx is the total number of all the residues in the same data set.
The deviation DA,X of FA,X from the natural frequency of occurrence of the residues was calculated as
 |
where FA,nat is the frequency of occurrence of the residue A in the proteins of Swiss-Prot database (release 45.7).
Calculating the frequencies of occurrence of dipeptides and tripeptides
The frequency of occurrence FAB,X of a dipeptide AB in a data set X (X = I,S) was calculated as
 |
where A and B are single-letter symbols of amino acids, NAB,X is the total occurrence of the dipeptide AB in the data set X, and TAB,X is the total number of all the dipeptides in the same data set. The deviation DAB,X of FAB,X from the natural frequency of occurrence of the dipeptide AB was calculated as
 |
where FAB,nat is the frequency of occurrence of dipeptide AB in the proteins of the Swiss-Prot database.
The frequency of occurrence FABC,X of tripeptide ABC and the deviation DABC,X of FABC,X from the natural frequency of occurrence (FABC,nat) of the tripeptide were calculated the same way.
The DABC,S for a tripeptide that was absent in data set S was empirically fixed as −0.2, which was higher than the observed lowest value of DABC,S. This was done in order to give an allowance for possible underrepresentation of tripeptides in the data set S owing to the limited number of proteins.
Calculating the dipeptide and tripeptide scores
The dipeptide score of a protein SDP was calculated as
 |
With L being the number of residues in the protein, L-1 denotes the number of dipeptides in the protein. The tripeptide score STP was calculated in a similar way. Irrespective of which data set a protein belongs to, its dipeptide and tripeptide scores are calculated using the deviations observed for the data set S proteins, i.e., DAB,S and DABC,S values; the objective here is to compare the dipeptide and tripeptide composition of a protein with that of the data set S proteins.
Mann-Whitney test
The Mann-Whitney test was carried out using the software SPSS v.10.0 to test the statistical significance of the differences observed for some of the parameters between the two data sets S and I.
Acknowledgments
We are grateful to Profs. U. Anantharaman, N. Hemachandra, S. Noronha, and K.V. Venkatesh for their valuable suggestions and help. We also thank the anonymous referee for the critical comments and useful suggestions. S.I.-T. is grateful to the Council of Scientific and Industrial Research for research fellowship.
Article published online ahead of print. Article and publication date are at http://www.proteinscience.org/cgi/doi/10.1110/ps.041009005.
Supplemental material: see www.proteinscience.org
References
- Bertone, P., Kluger, Y., Lan, N., Zheng, D., Christendat, D., Yee, A., Edwards, A.M., Arrowsmith, C.H., Montelione, G.T., and Gerstein, M. 2001. SPINE: An integrated tracking database and data mining approach for identifying feasible targets in high-throughput structural proteomics. Nucleic Acids Res. 29 2884–2898. [DOI] [PMC free article] [PubMed] [Google Scholar]
- Boeggeman, E.E., Ramakrishnan, B., and Qasba, P.K. 2003. The N-terminal stem region of bovine and human β1,4-galactosyltransferase I increases the in vitro folding efficiency of their catalytic domain from inclusion bodies. Protein Expr. Purif. 30 219–229. [DOI] [PubMed] [Google Scholar]
- Carrio, M.M. and Villaverde, A. 2001. Protein aggregation as bacterial inclusion bodies is reversible. FEBS Lett. 489 29–33. [DOI] [PubMed] [Google Scholar]
- Cha, H.J., Wu, C.F., Valdes, J.J., Rao, G., and Bentley, W.E. 2000. Observations of green fluorescent protein as a fusion partner in genetically engineered Escherichia coli: Monitoring protein expression and solubility. Biotechnol. Bioeng. 67 565–574. [PubMed] [Google Scholar]
- Chan, H.S. and Dill, K.A. 1994. Transition states and folding dynamics of proteins and heteropolymers. J. Chem. Phys. 100 9238–9257. [Google Scholar]
- Chen, J., Acton, T.B., Basu, S.K., Montelione, G.T., and Inouye, M. 2002. Enhancement of the solubility of proteins overexpressed in Escherichia coli by heat shock. J. Mol. Microbiol. Biotechnol. 4 519–524. [PubMed] [Google Scholar]
- Clark, E.D.B. 1998. Refolding of recombinant proteins. Curr. Opin. Biotechnol. 9 157–163. [DOI] [PubMed] [Google Scholar]
- Cortazzo, P., Cervenansky, C., Marin, M., Reiss, C., Ehrlich, R., and Deana, A. 2002. Silent mutations affect in vivo protein folding in Escherichia coli. Biochem. Biophys. Res. Commun. 293 537–541. [DOI] [PubMed] [Google Scholar]
- Dale, G.E., Broger, C., Langen, H., D’Arcy, A., and Stuber, D. 1994. Improving protein solubility through rationally designed amino acid replacements: Solubilization of the trimethoprim-resistant type S1 dihydrofolate reductase. Protein Eng. 7 933–939. [DOI] [PubMed] [Google Scholar]
- Davis, G.D., Elisee, C., Newham, D.M., and Harrison, R.G. 1999. New fusion protein systems designed to give soluble expression in Escherichia coli. Biotechnol. Bioeng. 65 382–388. [PubMed] [Google Scholar]
- Doray, B., Chen, C.D., and Kemper, B. 2001. N-terminal deletions and His-tag fusions dramatically affect expression of cytochrome p450 2C2 in bacteria. Arch. Biochem. Biophys. 393 143–153. [DOI] [PubMed] [Google Scholar]
- Fink, A.L. 1998. Protein aggregation: Folding aggregates, inclusion bodies and amyloid. Fold Des. 3 R9–R23. [DOI] [PubMed] [Google Scholar]
- Folkers, G.E., van Buuren, B.N., and Kaptein, R. 2004. Expression screening, protein purification and NMR analysis of human protein domains for structural genomics. J. Struct. Funct. Genomics 5 119–131. [DOI] [PubMed] [Google Scholar]
- Forrer, P. and Jaussi, R. 1998. High-level expression of soluble heterologous proteins in the cytoplasm of Escherichia coli by fusion to the bacteriophage λ head protein D. Gene 224 45–52. [DOI] [PubMed] [Google Scholar]
- Fox, J.D., Kapust, R.B., and Waugh, D.S. 2001. Single amino acid substitutions on the surface of Escherichia coli maltose-binding protein can have a profound impact on the solubility of fusion proteins. Protein Sci. 10 622–630. [DOI] [PMC free article] [PubMed] [Google Scholar]
- Georgiou, G. and Valax, P. 1999. Isolating inclusion bodies from bacteria. Methods Enzymol. 309 48–58. [DOI] [PubMed] [Google Scholar]
- Goh, C.S., Lan, N., Douglas, S.M., Wu, B., Echols, N., Smith, A., Milburn, D., Montelione, G.T., Zhao, H., and Gerstein, M. 2004. Mining the structural genomics pipeline: Identification of protein properties that affect high-throughput experimental analysis. J. Mol. Biol. 336115–130. [DOI] [PubMed] [Google Scholar]
- Gromiha, M.M., Oobatake, M., and Sarai, A. 1999. Important amino acid properties for enhanced thermostability from mesophilic to thermophilic proteins. Biophys. Chem. 82 51–67. [DOI] [PubMed] [Google Scholar]
- Guruprasad, K., Reddy, B.V., and Pandit, M.W. 1990. Correlation between stability of a protein and its dipeptide composition: A novel approach for predicting in vivo stability of a protein from its primary sequence. Protein Eng. 4 155–161. [DOI] [PubMed] [Google Scholar]
- Hammarstrom, M., Hellgren, N., van Den Berg, S., Berglund, H., and Hard, T. 2002. Rapid screening for improved solubility of small human proteins produced as fusion proteins in Escherichia coli. Protein Sci. 11 313–321. [DOI] [PMC free article] [PubMed] [Google Scholar]
- Ikai, A. 1980. Thermostability and aliphatic index of globular proteins. J. Biochem. 88 1895–1898. [PubMed] [Google Scholar]
- Jenkins, T.M., Hickman, A.B., Dyda, F., Ghirlando, R., Davies, D.R., and Craigie, R. 1995. Catalytic domain of human immunodeficiency virus type 1 integrase: Identification of a soluble mutant by systematic replacement of hydrophobic residues. Proc. Natl. Acad. Sci. 92 6057–6061. [DOI] [PMC free article] [PubMed] [Google Scholar]
- Kallberg, Y., Gustafsson, M., Persson, B., Thyberg, J., and Johansson, J. 2001. Prediction of amyloid fibril-forming proteins. J. Biol. Chem. 276 12945–12950. [DOI] [PubMed] [Google Scholar]
- Kapust, R.B. and Waugh, D.S. 1999. Escherichia coli maltose-binding protein is uncommonly effective at promoting the solubility of polypeptides to which it is fused. Protein Sci. 8 1668–1674. [DOI] [PMC free article] [PubMed] [Google Scholar]
- Katzav-Gozansky, T., Hanan, E., and Solomon, B. 1996. Effect of monoclonal antibodies in preventing carboxypeptidase A aggregation. Biotechnol. Appl. Biochem. 23 227–230. [PubMed] [Google Scholar]
- King, J., Haase-Pettingell, C., Robinson, A.S., Speed, M., and Mitraki, A. 1996. Thermolabile folding intermediates: Inclusion body precursors and chaperonin substrates. FASEB J. 10 57–66. [DOI] [PMC free article] [PubMed] [Google Scholar]
- Knaust, R.K. and Nordlund, P. 2001. Screening for soluble expression of recombinant proteins in a 96-well format. Anal. Biochem. 297 79–85. [DOI] [PubMed] [Google Scholar]
- Komar, A.A., Lesnik, T., and Reiss, C. 1999. Synonymous codon substitutions affect ribosome traffic and protein folding during in vitro translation. FEBS Lett. 462 387–391. [DOI] [PubMed] [Google Scholar]
- Lesley, S.A., Graziano, J., Cho, C.Y., Knuth, M.W., and Klock, H.E. 2002. Gene expression response to misfolded protein as a screen for soluble recombinant protein. Protein Eng. 15 153–160. [DOI] [PubMed] [Google Scholar]
- Lilie, H., Schwarz, E., and Rudolph, R. 1998. Advances in refolding of proteins produced in E. coli. Curr. Opin. Biotechnol. 9 497–501. [DOI] [PubMed] [Google Scholar]
- Lin, Z., Thorsen, T., and Arnold, F.H. 1999. Functional expression of horse-radish peroxidase in E. coli by directed evolution. Biotechnol. Prog. 15 467–471. [DOI] [PubMed] [Google Scholar]
- Luan, C.H., Qiu, S., Finley, J.B., Carson, M., Gray, R.J., Huang, W., Johnson, D., Tsao, J., Reboul, J., Vaglio, P., et al. 2004. High-throughput expression of C. elegans proteins. Genome Res. 14 2102–2110. [DOI] [PMC free article] [PubMed] [Google Scholar]
- Malissard, M. and Berger, E.G. 2001. Improving solubility of catalytic domain of human β-1,4-galactosyltransferase 1 through rationally designed amino acid replacements. Eur. J. Biochem. 268 4352–4358. [DOI] [PubMed] [Google Scholar]
- Makrides, S.C. 1996. Strategies for achieving high-level expression of genes in Escherichia coli. Microbiol. Rev. 60 512–538. [DOI] [PMC free article] [PubMed] [Google Scholar]
- Mogk, A., Mayer, M.P., and Deuerling, E. 2002. Mechanisms of protein folding: Molecular chaperones and their application in biotechnology. Chembiochem. 3 807–814. [DOI] [PubMed] [Google Scholar]
- Murby, M., Samuelsson, E., Nguyen, T.N., Mignard, L., Power, U., Binz, H., Uhlen, M., and Stahl, S. 1995. Hydrophobicity engineering to increase solubility and stability of a recombinant protein from respiratory syncytial virus. Eur. J. Biochem. 230 38–44. [DOI] [PubMed] [Google Scholar]
- Ni, L., Zhou, J., Hurley, T.D., and Weiner, H. 1999. Human liver mitochondrial aldehyde dehydrogenase: Three-dimensional structure and the restoration of solubility and activity of chimeric forms. Protein Sci. 8 2784–2790. [DOI] [PMC free article] [PubMed] [Google Scholar]
- Nygaard, F.B. and Harlow, K.W. 2001. Heterologous expression of soluble, active proteins in Escherichia coli: The human estrogen receptor hormone-binding domain as paradigm. Protein Expr. Purif. 21 500–509. [DOI] [PubMed] [Google Scholar]
- Oberg, K., Chrunyk, B.A., Wetzel, R., and Fink, A.L. 1994. Nativelike secondary structure in interleukin-1 β inclusion bodies by attenuated total reflectance FTIR. Biochemistry 33 2628–2634. [DOI] [PubMed] [Google Scholar]
- Oswald, T., Wende, W., Pingoud, A., and Rinas, U. 1994. Comparison of N-terminal affinity fusion domains: Effect on expression level and product heterogeneity of recombinant restriction endonuclease EcoR V. Appl. Microbiol. Biotechnol. 42 73–77. [DOI] [PubMed] [Google Scholar]
- Pedelacq, J.D., Piltch, E., Liong, E.C., Berendzen, J., Kim, C.Y., Rho, B.S., Park, M.S., Terwilliger, T.C., and Waldo, G.S. 2002. Engineering soluble proteins for structural genomics. Nat. Biotechnol. 20 927–932. [DOI] [PubMed] [Google Scholar]
- Przybycien, T.M., Dunn, J.P., Valax, P., and Georgiou, G. 1994. Secondary structure characterization of β-lactamase inclusion bodies. Protein Eng. 7 131–136. [DOI] [PubMed] [Google Scholar]
- Ramachandiran, V., Willms, C., Kramer, G., and Hardesty, B. 2000. Fluorophores at the N-terminus of nascent chloramphenicol acetyltransferase peptides affect translation and movement through the ribosome. J. Biol. Chem. 275 1781–1786. [DOI] [PubMed] [Google Scholar]
- Rogers, S., Wells, R., and Rechsteiner, M. 1986. Amino acid sequences common to rapidly degraded proteins: The PEST hypothesis. Science 234 364–368. [DOI] [PubMed] [Google Scholar]
- Rosen, R., Biran, D., Gur, E., Becher, D., Hecker, M., and Ron, E.Z. 2002. Protein aggregation in Escherichia coli: Role of proteases. FEMS Microbiol. Lett. 207 9–12. [DOI] [PubMed] [Google Scholar]
- Rudolph, R. 1990. Renaturation of recombinant, disulfide-bonded proteins from inclusion bodies. In Modern methods in protein and nucleic acid research (ed. H. Tschesche), pp. 149–172. Walter de Gruyter, Berlin.
- Rudolph, R. and Lilie, H. 1996. In vitro folding of inclusion body proteins. FASEB J. 10: 49–56. [PubMed] [Google Scholar]
- Sachdev, D. and Chirgwin, J.M. 1998. Solubility of proteins isolated from inclusion bodies is enhanced by fusion to maltose-binding protein or thioredoxin. Protein Expr. Purif. 12 122–132. [DOI] [PubMed] [Google Scholar]
- Sati, S.P., Singh, S.K., Kumar, N., and Sharma, A. 2002. Extra terminal residues have a profound effect on the folding and solubility of a Plasmodium falciparum sexual stage-specific protein overexpressed in Escherichia coli. Eur. J. Biochem. 269 5259–5263. [DOI] [PubMed] [Google Scholar]
- Schein, C.H. 1990. Solubility as a function of protein structure and solvent components. Biotechnology 8 308–317. [DOI] [PubMed] [Google Scholar]
- Schein, C.H. and Noteborn, M.H.M. 1988. Formation of soluble recombinant proteins in Escherichia coli is favored by lower growth temperature. Biotechnology 6 291–294. [Google Scholar]
- Shakhnovich, E.I. and Gutin, A.M. 1993. Engineering of stable and fast-folding sequences of model proteins. Proc. Natl. Acad. Sci. 90 7195–7199. [DOI] [PMC free article] [PubMed] [Google Scholar]
- Shih, Y.P., Kung, W.M., Chen, J.C., Yeh, C.H., Wang, A.H., and Wang, T.F. 2002. High-throughput screening of soluble recombinant proteins. Protein Sci. 11 1714–1719. [DOI] [PMC free article] [PubMed] [Google Scholar]
- Socci, N.D. and Onuchic, J.N. 1994. Folding kinetics of protein-like hetero-polymers. J. Chem. Phys. 100 1519–1528. [Google Scholar]
- Stevens, R.C. 2000. Design of high-throughput methods of protein production for structural biology. Structure 8R177–R185. [DOI] [PubMed] [Google Scholar]
- Tandon, S. and Horowitz, P. 1988. The effects of lauryl maltoside on the reactivation of several enzymes after treatment with guanidinium chloride. Biochim. Biophys. Acta 95519–25. [DOI] [PubMed] [Google Scholar]
- Timson, D.J. and Reece, R.J. 2003. Functional analysis of disease-causing mutations in human galactokinase. Eur. J. Biochem. 270 1767–1774. [DOI] [PubMed] [Google Scholar]
- Tompa, P. 2002. Intrinsically unstructured proteins. Trends Biochem. Sci. 27 527–533. [DOI] [PubMed] [Google Scholar]
- Tresaugues, L., Collinet, B., Minard, P., Henckes, G., Aufrere, R., Blondeau, K., Liger, D., Zhou, C.Z., Janin, J., Van Tilbeurgh, H., et al. 2004. Refolding strategies from inclusion bodies in a structural genomics project. J. Struct. Funct. Genomics 5 195–204. [DOI] [PubMed] [Google Scholar]
- Tsumoto, K., Umetsu, M., Kumagai, I., Ejima, D., and Arakawa, T. 2003. Solubilization of active green fluorescent protein from insoluble particles by guanidine and arginine. Biochem. Biophys. Res. Commun. 3121383–1386. [DOI] [PubMed] [Google Scholar]
- Uversky, V.N., Gillespie, J.R., and Fink, A.L. 2000. Why are “natively unfolded” proteins unstructured under physiologic conditions? Proteins 41 415–427. [DOI] [PubMed] [Google Scholar]
- Waldo, G.S. 2003. Genetic screens and directed evolution for protein solubility. Curr. Opin. Chem. Biol. 7 33–38. [DOI] [PubMed] [Google Scholar]
- Wetzel, R., Perry, L.J., and Veilleux, C. 1991. Mutations in human interferon γ affecting inclusion body formation identified by a general immunochemical screen. Biotechnology 9 731–737. [DOI] [PubMed] [Google Scholar]
- Wigley, W.C., Stidham, R.D., Smith, N.M., Hunt, J.F., and Thomas, P.J. 2001. Protein solubility and folding monitored in vivo by structural complementation of a genetic marker protein. Nat. Biotechnol. 19 131–136. [DOI] [PubMed] [Google Scholar]
- Wilkinson, D.L. and Harrison, R.G. 1991. Predicting the solubility of recombinant proteins in Escherichia coli. Biotechnology 9 443–448. [DOI] [PubMed] [Google Scholar]
- Williams, R.M., Obradovi, Z., Mathura, V., Braun, W., Garner, E.C., Young, J., Takayama, S., Brown, C.J., and Dunker, A.K. 2001. The protein non-folding problem: Amino acid determinants of intrinsic order and disorder. Pac. Symp. Biocomput. 6 89–100. [DOI] [PubMed] [Google Scholar]
- Winter, J., Neubauer, P., Glockshuber, R., and Rudolph, R. 2001. Increased production of human proinsulin in the periplasmic space of Escherichia coli by fusion to DsbA. J. Biotechnol. 84 175–185. [DOI] [PubMed] [Google Scholar]
- Woestenenk, E.A., Hammarstrom, M., van den Berg, S., Hard, T., and Berglund, H. 2004. His tag effect on solubility of human proteins produced in Escherichia coli: A comparison between four expression vectors. J. Struct. Funct. Genomics. 5 217–229. [DOI] [PubMed] [Google Scholar]
- Yakhnin, A.V. and Babitzke, P. 2002. NusA-stimulated RNA polymerase pausing and termination participates in the Bacillus subtilis trp operon attenuation mechanism in vitro. Proc. Natl. Acad. Sci. 99 11067–11072. [DOI] [PMC free article] [PubMed] [Google Scholar]
- Zaccaria, D., Greco, R., MacWilliams, H., Bozzaro, S., and Ceccarelli, A. 1998. UGUS, a reporter for use with destabilizing N-termini. Nucleic Acids Res. 26 1128–1129. [DOI] [PMC free article] [PubMed] [Google Scholar]
- Zhang, Y., Olsen, D.R., Nguyen, K.B., Olson, P.S., Rhodes, E.T., and Mascarenhas, D. 1998. Expression of eukaryotic proteins in soluble form in Escherichia coli. Protein Expr. Purif. 12 159–165. [DOI] [PubMed] [Google Scholar]
- Zhou, P., Lugovskoy, A.A., and Wagner, G. 2001. A solubility-enhancement tag (SET) for NMR studies of poorly behaving proteins. J. Biomol. NMR 20 11–14. [DOI] [PubMed] [Google Scholar]