

Abstract
Acid-sensing ion channels (ASIC) are proton-gated sodium channels that have been implicated in pain transduction associated with acidosis in inflamed or ischemic tissues. APETx2, a peptide toxin effector of ASIC3, has been purified from an extract of the sea anemone Anthopleura elegantissima. APETx2 is a 42-amino-acid peptide cross-linked by three disulfide bridges. Its three-dimensional structure, as determined by conventional two-dimensional 1H-NMR, consists of a compact disulfide-bonded core composed of a four-stranded β-sheet. It belongs to the disulfide-rich all-β structural family encompassing peptide toxins commonly found in animal venoms. The structural characteristics of APETx2 are compared with that of PcTx1, another effector of ASIC channels but specific to the ASIC1a subtype and to APETx1, a toxin structurally related to APETx2, which targets the HERG potassium channel. Structural comparisons, coupled with the analysis of the electrostatic characteristics of these various ion channel effectors, led us to suggest a putative channel interaction surface for APETx2, encompassing its N terminus together with the type I-β turn connecting β-strands III and IV. This basic surface (R31 and R17) is also rich in aromatic residues (Y16, F15, Y32, and F33). An additional region made of the type II′-β turn connecting β-strands I and II could also play a role in the specificity observed for these different ion effectors.
Keywords: Anthopleura elegantissima, APETx2, sea anemone toxin, structure determination, sodium channel inhibitor, ASIC, NMR
The acid-sensing ion channel (ASIC) family comprises homomeric and heteromeric ion channels formed by association of different subunits (ASIC1, 2, 3, 4, and variants) that are sensitive to an extracellular pH drop. ASICs are found in both the central and peripheral nervous system and, due to their ability to respond to acidosis, have been associated with pain transduction in inflamed or ischemic tissues, as well as peripheral mechanotransduction and nociception (Waldmann and Lazdunski 1998)
Elucidation of the role of ASICs is of utmost importance in the context of their potential role in physiopathological conditions. Different from the other subunits, ASIC 3 is predominantly expressed in dorsal root and trigeminal ganglia as well as sensory nerve endings of skin (Price et al. 2001). Studies in ASIC3 KO (knockout) mice revealed an increased sensitivity tolight touch but a reduced sensitivity to noxious pinch (Price et al. 2001; Chen et al. 2002). ASIC3 KO mice were also shown to be desensitized to intramuscular acid injection (Sluka et al. 2003). ASIC3 has also been involved in response to heat, acid, and mechanical stimuli, and may also mediate pain sensation during myocardial ischemia (Benson et al. 1999; Sutherland et al. 2001). ASIC3 thus appears to be an important mediator in both nociception and mecanotransduction.
The problem of finding selective pharmacological tools for the study of ion channels has been largely solved by the study of animal venoms, which offer an amazing array of peptide toxins possessing an immense variety of pharmacological properties. We have recently isolated the first peptide ligand of ASIC3 channels from the venom of the sea anemone Anthopleura elegantissima (Diochot et al. 2004). APETx2 is a 42 amino acid peptide which selectively blocks ASIC3 homomeric channels as well as heteromeric ASIC2b+3, ASIC1b+3, and ASIC1a+3 channels with decreasing affinities. In order to further understand the molecular mechanisms leading to ASIC3 blockade by this peptide, we have undertaken the study of its spatial structure by NMR and report here those results, in the light of our previous work on another peptide inhibitor of the ASIC channel family.
Results and Discussion
Although we have previously modeled this structure (Diochot et al. 2004), the model only indicates that the overall fold is conserved. Actually, it is of first importance to experimentally describe the precise conformation of the side chains to understand why APETx2 and APETx1 are specific for very different ion channels (respectively, sodium and potassium channels). The precise location of the side chains is of primary importance in the electrostatic anisotropy analysis, which will be used as a guideline for further mutagenesis experiments.
NMR resonance assignment and secondary structure
The proton resonance of APETx2 was sequentially assigned following the standard method first described by Wüthrich (1986) and successfully applied to various toxins such as ADO1, PaTx1, or Mca, respectively, from the assassin bug Agriosphodrus dohrni, the spider Phrixotrichus auratus or the scorpion Scorpiomaurus (Mosbah et al. 2000; Bernard et al. 2004; Chagot et al. 2004).
The spin systems were identified on the basis of both COSY and TOCSY spectra recorded at 280 K and 290 K. The use of two temperatures allowed us to resolve overlapping signals in the fingerprint region. Once the intraresidual and sequential assignment procedures were achieved, almost all protons were identified and their resonance frequency determined (BMRB code 6467). The distribution of the Hαi/HNi+1, Hβi/HNi+1, and HNi/HNi+1 nOe correlations indicates that the toxin is mainly organized in extended regions, characterized by strong Hαi/HNi+1 correlations together with large 3JHN-Hα coupling constants (Fig. 1A ▶).
Figure 1.
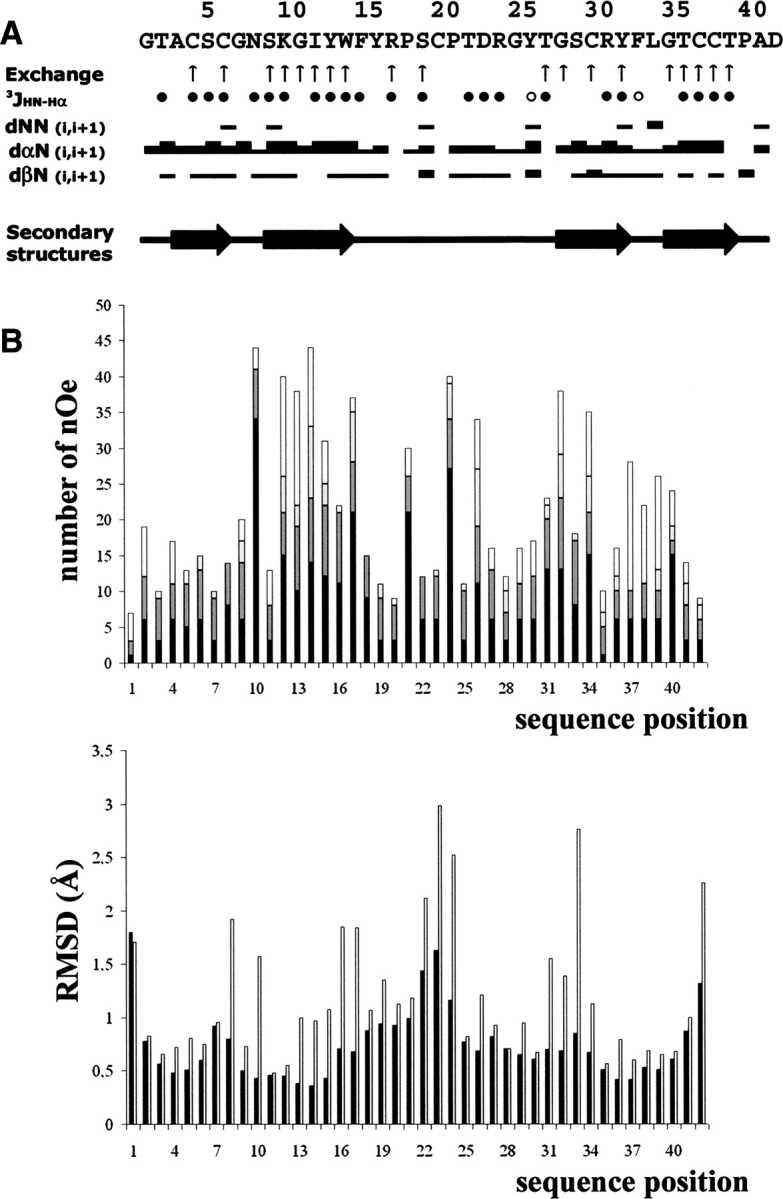
(A) Sequence of APETx2 and sequential assignment. The up arrows indicate the amide protons which are slowly exchanged. Filled circles represent 3JHN-Hαcoupling constants ≥8 Hz; open circles, those ≤6 Hz. Collected sequential nOe are classified into strong, medium, and weak nOe, and are indicated by thick, medium, and thin lines, respectively. The horizontal arrows indicate the secondary elements (extended regions). (B) nOe (top) and RMSD (bottom) distribution vs. sequence of APETx2. Intraresidue nOe are in black; sequential nOe, in dark gray; medium-range nOe, in light gray; and long-range nOe, in white. RMSD values for backbone and all heavy atoms are in black and in gray, respectively.
Structure calculation
The structure of APETx2 was determined by using 631 nOe-based distance restraints, including 369 intraresidue restraints, 128 sequential restraints, 41 medium-range restraints, and 93 long-range restraints. The repartition of these nOe along the sequence is shown in Figure 1B ▶ (top). In addition, 38 hydrogen bond restraints derived from proton exchange data and 28 dihedral angle restraints derived from the measurement of coupling constants were included, as well the distance restraints derived from the three disulfide bridges, which were deduced from the observation of the structures obtained in the first calculation run. Altogether, the final experimental set corresponded to 16.8 constraints per residue on average.
The calculation using the whole set of restraints and water solvent minimization led to a single family of 25 solutions (Fig. 2A ▶) consistent with the experimental restraints. Their structural statistics are given in Table 1. All the solutions have good nonbonded contacts, as indicated by the negative value of the van der Waals energy, and good covalent geometry as shown by the low values of CNS energy terms and low root mean square deviation (RMSD) values for bond lengths, valence angles, and improper dihedral angles. Correlation with the experimental data shows no nOe-derived distance violation >0.2 Å.
Figure 2.

(A) Stereopair view of the best fit of 25 APETx2 structures. Only backbone atoms (HN, N, Cα, C, O) are shown. (B) Pymol (DeLano Scientific) representation of APETx2. Cystines and N and C termini are labeled.
Table 1.
Structural statistics of the 25 best structures of APETx2 obtained with the ARIA software
| Residues 1–42 | Residues 3–41 | Residues 3–14, 28–40 | |
| RMSD (Å) | |||
| Backbone | 0.84 ± 0.16 | 0.79 ± 0.16 | 0.43 ± 0.09 |
| All heavy atoms | 1.54 ± 0.21 | 1.52 ± 0.21 | 1.09 ± 0.20 |
| Energies (kcal/mol) | |||
| Total | −1209.99 ± 52.54 | ||
| Bonds | 10.512 ± 0.907 | ||
| Angles | 45.249 ± 6.563 | ||
| Impropers | 38.650 ± 4.349 | ||
| Dihedrals | 183.447 ± 3.432 | ||
| van der Waals (repel) | −176.819 ± 8.427 | ||
| Elec | −1344.54 ± 50.87 | ||
| nOe | 33.044 ± 3.854 | ||
| Cdih | 0.459 ± 0.436 | ||
| RMSD | |||
| Bonds (Å) | 0.0041 ± 0.002 | ||
| Angles (°) | 0.5216 ± 0.0360 | ||
| Impropers (°) | 1.7228 ± 0.1093 | ||
| Dihedral (°) | 40.506 ± 0.318 | ||
| nOe (Å) | 0.0312 ± 0.0018 | ||
| Cdih (°) | 0.4848 ± 0.2383 | ||
| RAMACHANDRAN | |||
| Most favored and additional allowed (%) | 99.0 | ||
| Generously allowed (%) | 1.0 | ||
| Disallowed region (%) | 0 | ||
The RMSD calculated on the whole structure is 0.84 ± 0.16 Å for the backbone and 1.54 ± 0.21 Å for all heavy atoms. If N- and C-terminal residues are omitted, these values drop to 0.79 ± 0.16 Å and 1.52 ± 0.21 Å , respectively. If the loop 15–27 and the N and C termini are excluded, the values become 0.43 ± 0.09 Å and 1.09 ± 0.20 Å , which indicates a rather poor resolution of this loop as well as of the N- and C-terminal residues. This is confirmed by the individual RMSD values (Fig. 1B ▶). The analysis of the Ramachandran plot for the ensemble of the 25 calculated models (in PROCHECK software nomenclature) reveals that 75.8% of the residues are in the most favored regions, 23.2% in the allowed regions, 1.0% in the generously allowed, and none in the disallowed regions (data not shown).
Structure description
The convergence of the 25 final solutions allowed us to describe the structure of APETx2 (Fig. 2 ▶) (Protein Data Bank [PDB] code 1WXN), which consists of a compact disulfide-bonded core composed of a four-stranded β sheet from which a loop (15–27) and the N and C termini emerge. APETx2 can therefore be classified as an all-β toxin. The four strands, well detected by the PROCHECK-NMR software, include residues 3–6 (strand I), residues 9–14 (strand II), residues 28–32 (strand III), and residues 35–39 (strand IV). According to the value of dihedral angles, strands I and II are connected by a type II′- β turn (residues 6–9), strands III and IV are connected by a type I-β turn (residues 32–35), while strands II and III are connected by the 15–27 loop.
Comparison with related toxins
The fold of APETx2 places it in the Defensin family (according to the SCOP database, http://scop.mrc-lmb.cam.ac.uk) (Torres and Kuchel 2004), which includes anti-microbial peptides from humans as well as different toxins from the venoms of snake, Platypus or sea anemones.
The general fold is characterized by a short α-helix or turn followed by two or three anti-parallel β-strands. β-Defensin type peptides are stabilized around a three disulfide-bonded hydrophobic core with a 1–5, 2–4, 3–6 cysteine pairing. Many variations on the same motif lead to molecules with a variety of biological properties, as observed in other short peptide families.
Toxins with a similar fold and disulfide arrangement have been characterized from other sea anemone venoms, and Figure 3A ▶ shows the three-dimensional structures of the related sea anemone toxins anthopleurin A (PDB code 1AHL) from the giant green anemone Anthopleura xanthogrammica, and ATX Ia from Anemonia sulcata, which both inhibit sodium channels (PDB code 1ATX), ShI from Stichodactyla helianthus (PDB code 1SH1), and BDS1 from Anemonia sulcata (PDB code 1BDS) first described as an anti-hypertensive and anti-viral protein, and later shown to be an inhibitor of the potassium channel KV3.4 (Diochot et al. 1998). APETX2 and APETx1 (PDB code 1WQK) (Diochot et al. 2003; Chagot et al. 2005), both from Anthopleura elegantissima, are shown in Figure 3D ▶. All these toxins are organized around the same overall fold.
Figure 3.

(A) Pymol (DeLano Scientific) representation of the structure of some sea anemone toxins. (Left to right) Anthopleurin-A (NaV), ATX IA (Na), Sh1, and BDS1 (KV3.4). (B) Sequence alignment of APETx2 with these toxins. The cystines are highlighted in gray. (C) Phylogenic tree constructed from the six sequences in B. The sequence alignment was calculated with Tcoffee server (Poirot et al. 2004) and the alignment was submitted to the Evolutionary Trace Server (TraceSuite II) developed and maintained by the Blundell group at the University of Cambridge. (D) Ribbon representations of the structure of toxins APETX1 (HERG) and APETx2 (ASIC3).
APETx2 possesses some sequence similarities with BDS1 and APETx1 (respectively, 32% and 69% sequence similarity, excluding cysteine residues) and little sequence similarity with other sea anemone toxins (Diochot et al. 2004) (Fig. 3B ▶). While organized around the same fold, these three toxins, however, show different pharmacological properties: BDS1 and APETx1 act respectively on the potassium channels KV3.4 and HERG, and APETx2 inhibits ASIC3, a proton-gated channel primarily permeant for sodium. The dissimilarity of these target proteins would thus suggest different modes of toxin-channel interaction, and therefore a different organization of toxin surfaces.
The phylogenic tree (Fig. 3C ▶) shows that the sea anemones toxins probably have a common ancestor and have diverged during evolution. An interesting fact is that the toxins closest to APETx2 are potassium channel inhibitors; therefore, APETx2 may have diverged to become a sodium channel effector.
As APETx1 and APETx2 share very similar primary sequences, they are good models for the study of the influence of toxin surfaces on receptor selectivity. To gain insight into the structural features leading to such different pharmacological properties, we first compared the three-dimensional structures of APETx1 and APETx2 (Fig. 3D ▶). With a RMSD of 1.65 Å for all the backbone atoms of APETx1 and APETx2, and a poor fit of the 6–12, 15–20, 33–35, and 39–42 region, these toxins are clearly structurally related. The two toxins share a similar cysteine pattern and among the 15 amino acid differences, three are conservative (T9, T19, and S22 in APETx1 are replaced by S9, S19, and T22 in APETx2) and the 12 others are significantly different in the physicochemical nature of the residues involved. Residues T3, Y5, K8, I10, G16, T17, K18, N23, G31, I36, Y39, and V41 in APETx1 are replaced respectively by A3, S5, N8, K10, Y16, R17, P18, D23 R31, T36, T39, and A41 in APETx2.
The spatial locations of the residues which differ in APETx2 and APETx1 are shown in Figure 4A ▶. Meaningful substitutions can be linked to two different spatial clusters: residues 3, 5, 8, 10 in the first and second strand, together with residues 39 and 41 in the C terminus of the protein form the first cluster. Residues 16, 17, 18, 31, and 36 located after the first strand and in the third and fourth strand form the second. The first cluster appears to be formed of mostly uncharged and hydrophobic residues, surrounding a central Lysine (K10). Conversely, the second cluster is biased toward positive charges, with two basic residues close to a hydrophobic one (Y16) and a nonpolar core. The basic-aromatic residue combination is a feature of toxin interaction surfaces in other peptide toxins, and has been termed the characteristic “basic-aromatic dyad” (Dauplais et al. 1997). A similar dyad is also found in the other known ASIC toxin, PcTx1 (see Fig. 4B ▶ and text below). Additionally, residue 23, located on the loop between the two clusters is also changed from an uncharged residue (N23) to a negatively charged one (D23), a significant mutation in APETX2. Taken together, these features strongly suggest that at least some of these residues and perhaps the two clusters considered as toxin “patches” are important for the interaction of APETx2 with the ASIC3 channel subunit and also for the different specificity of APETx1 and APETx2.
Figure 4.
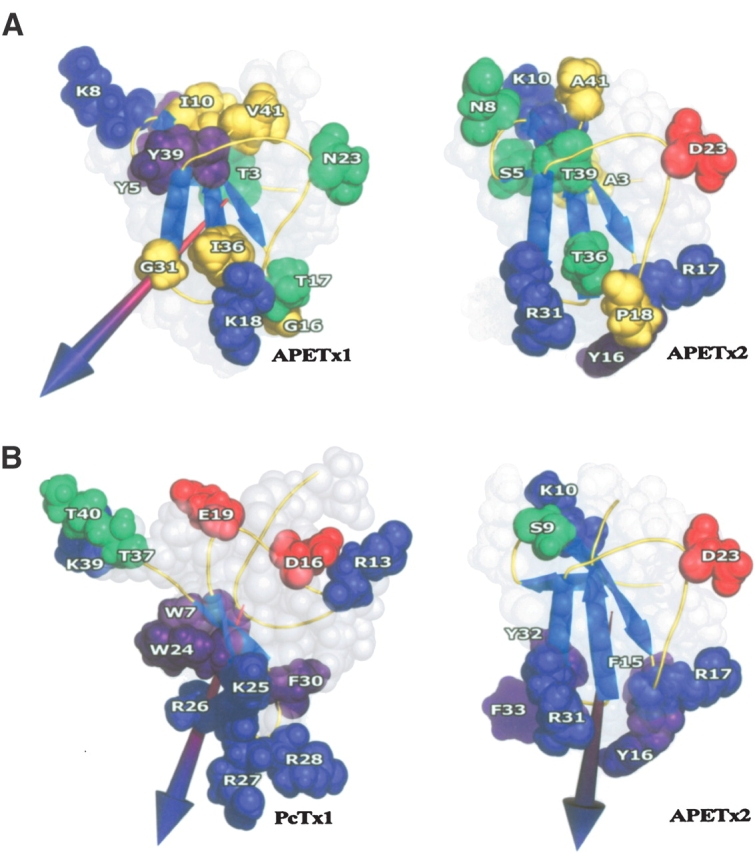
(A) Spatial location of the residues which are specific to APETx1 (right) and APETx2 (left). The residues are colored green for polar uncharged residues, blue for basic residues, red for acidic residues, purple for aromatic residues, and yellow for aliphatic residues. (B) Location of residues with similar properties in PcTx1 (ASIC1a) and APETx2 (ASIC3). The residues are colored green for polar uncharged residues, blue for basic residues, red for acidic residues, purple for aromatic residues, and yellow for aliphatic residues. The dipole moments are represented by an arrow.
Various folds can accommodate ASIC channel recognition
To date, the only other known toxin acting on ASIC channels is PcTx1 (PDB code 1LMM). This toxin, folded according to the ICK motif, has been purified from the venom of the tarantula Psalmopoeus cambridgei, and is the first and only high-affinity ligand described for homomeric ASIC1a channels (Escoubas et al. 2000). Its structure was solved by our group (Escoubas et al. 2003), and analysis of its electrostatic anisotropy led us to suggest a possible surface involved in the interaction with the ASIC1a channel. We proposed the surface to be composed of the four basic residues K25, R26, R27, and R28 associated with aromatic residues W7, W24, and F30 surrounding the basic patch (Fig. 4B ▶) (Escoubas et al. 2003).
Comparison of the two toxins, acting on different ASIC subunits, nevertheless reveals some degree of similarity in their exposed side chains, and that despite different folds (Fig. 4B ▶). Both peptides possess a basic/aromatic cluster (K25, R26, R27, R28, W7, W24, and F30 for PcTx1 and R17, R31, F15, Y16, Y32, and F33 for APETx2), and a basic/hydroxyl cluster (T37, T40, and K39 for PcTx1 and S9 and K10 for APETx2) located on opposite sides of the molecule. The presence of a single acidic residue somewhat equidistant to these two clusters is also a constant (E19 or D16 for PcTx1 and D23 for APETx2). Another common characteristic is the orientation of the dipole moment resulting from the electrostatic anisotropy: In both APETx2 and PcTx1, this dipole emerges through the basic/aromatic cluster.
We have previously proposed (Ferrat et al. 2001) that electrostatic anisotropy could play an orientating force within the electrostatic field of the membrane receptor, and therefore that the orientation of the dipole could be construed as an indication of the interaction surface between a toxin and its target. This prediction method has been extensively validated through site-directed mutagenesis studies, for toxins acting by pore occlusion such as the scorpion Csαβ toxins (Sabatier et al. 1994; Inisan et al. 1995; Fremont et al. 1997). Although mutagenesis studies are far fewer in ICK gating modifier toxins, it appears that at least in gating-modifier toxins acting on members of the KV2 and KV4 potassium channel subfamilies, a consensus structural interpretation of the electrostatic anisotropy is beginning to emerge, which nevertheless remains to be fully confirmed for all toxins by additional mutagenesis studies (Bernard et al. 2000; Chagot et al. 2004).
Applied to APETx2, the calculation shows that the dipole moment emerges between the third and fourth strands of the β-sheet near residue R31, defining the cluster composed of Y16, R17, and R31 associated with F33 and F15 as a putative functional surface. A similar result was obtained for PcTx1, in which the dipole moment emerges through a patch of basic residues located at the tip of the cone-shaped peptide. In both cases the dipole moment calculation predicts an involvement of both basic and hydrophobic residues, an interesting feature in that it recalls the role of the basic-hydrophobic dyad demonstrated for scorpion toxins interacting with voltage-dependent KV1 channels (Dauplais et al. 1997). Another element that appears to support our approach is the fact that a single amino acid extension of either the N- or C-terminal part of the PcTx1 toxin has no effect on channel inhibition or toxin binding, showing that the opposite part of the peptide (the base of the “cone”) is not crucial for channel interaction (P. Escoubas, unpubl.).
Despite their similarity in sequence and in fold, APETx1 and APETx2 have specific electrostatic characteristics. This fact is demonstrated by the difference in dipole orientation, which result in a different orientation of the toxins toward their receptor sites. This slight difference results in a drastic modification of the toxin specificity. The dipole orientation clearly distinguish APETx1 and APETx2, and more generally, could distinguish effectors of various ion channel ligands.
As both toxins acting on ASIC channels possess the same pattern of residues and have the same electrostatic anisotropy repartition, we therefore propose that their interaction with the receptor is basically mediated by this basic/aromatic cluster, although a complementary role of the second common cluster or for the negatively charge residues (D23 in APETx2) cannot be excluded, and will need to be explored by mutagenesis studies. Further understanding of structure–activity relationships in the toxin–ASIC interaction model will be useful in the future design of novel therapeutic agent specifically targeting this important ion channel class.
Materials and methods
Purification of APET2
The APETx2 sample was repurified from several A. elegantissima peptide fractions from gel permeation and cationexchange chromatography (Diochot et al. 2004). The presence of APETx2 was first evaluated by MALDI-TOF mass spectrometry (average mass 4561.10 Da). The presence of the relevant ion and the relative purity of the samples were used to select fractions which were then each submitted to fast reversed-phase chromatography on a Monolithic C18 column (Merck Chromolith C18e 100 × 4.6mm, gradient of Acetonitrile/0.1% TFA in water/0.1% TFA, 0%–50% ACN in 25 min, 3 mL/min).
All peaks were reanalyzed by MALDI-TOF to monitor the presence of APETx2 and the different peaks corresponding to the toxin were pooled for final purification on a semipreparative C18 column (Nacalai C18, 250 × 10 mm, gradient of Acetonitrile/0.1%TFA in water/0.1%TFA, 0%CAN 5 min, 0%–50% in 50 min, 2 mL/min). The final yield was 3 mg of pure APETx2.
Sample preparation for NMR
APETx2 (3 mg) was dissolved in 0.5 mL of an H2O/D2O mixture (9:1 v/v) (pH 3), for a final concentration of 1.32 mM. The amide proton exchange rates were obtained on a sample dissolved in 500 μL of 100% D2O.
NMR experiments
1H 2D NMR spectra were routinely recorded at 280 K and 290 K in order to solve assignment ambiguities. All experiments were performed on a BRUKER DRX500 spectrometer equipped with an HCN probe and self shielded triple axis gradients were used. Double-quantum-filtered two-dimensional correlation spectra (DQF-COSY) (Marion and Wüthrich 1983) were acquired in the phase-sensitive mode by time-proportional phase incrementation of the first pulse (TPPI). Clean total correlation spectra (TOCSY) were performed with a spin-lock time of 80 msec and a spin locking field strength of 8 kHz. The mixing time of the nuclear Overhauser effect (nOe) experiments (NOESY) was set to 80 msec. Water suppression was obtained either using low-power irradiation during the 1.3-sec relaxation delay and during the mixing time for NOESY spectra, or with a Watergate 3–9- 19 pulse train (Piotto et al. 1992) using a gradient at the magic angle obtained by applying simultaneous x-, y-, and z- gradients prior to detection.
Individual amide proton exchange rates were determined by recording one series of four NOESY spectra (each experiment was 10 h long) at 280 K on the D2O sample. Amide protons still giving rise to nuclear Overhauser effect (nOe) correlations after 40 h of exchange were considered as slowly exchanging and therefore engaged in an hydrogen bond.
Analysis of spectra
The identification of amino acid spin systems and the sequential assignment were done using the standard strategy described by Wüthrich (1986) and regularly used by our group (Bernard et al. 2000; Ferrat et al. 2002; Chagot et al. 2004), applied with the XEASY graphical software (Bartels et al. 1995). The comparative analysis of COSY and TOCSY spectra recorded in water gave the spin system signatures of the protein. The NOESY spectra allowed us to sequentially connect the different spin systems of the protein.
Experimental restraints
The assignment and integration of nOe data usingmanual integration in the XEASY software allowed us to obtain a list of volumes which were automatically translated into upper limit distances by the calibration routine of the ARIA software (Linge et al. 2003). The Φ torsion angle constraints resulted from the 3JHN-Hα coupling constant measurements that were measured on a COSY spectrum with 8192 data points in the acquisition dimension. These Φ angles were restrained to −120 ± 40° for a 3JHN-Hα ≥ 8 Hz and to −65 ± 25° for a 3JHN-Hα ≤ 6Hz. No angle constraint was assigned to a 3JHN-Hα =7 Hz, a value considered as ambiguous.
Determination of the amide proton exchange rates led us to identify protons involved in hydrogen bonding. The oxygen partners were then identified by visual inspection of the preliminary calculated structures.
Structure calculation
The distance restraints and dihedral angles obtained from measured nOe volumes and 3JHN-Hα coupling constants, respectively, were used in structural calculations to determine the conformation of the toxin. These restraints were introduced as input for ARIA (Linge et al. 2003). In the first run, the calculations were initiated using default parameters, and only the nOe peak list and dihedral angle restraints and the disulfide bridges were not used. This preliminary run allowed us to correct the attribution of the nOe correlations and resulted in a preliminary fold for the APETx2 protein. We were then able to univocally define the disulfide bridge partners as well as hydrogen bond partners.
In the second and final run, restraints derived from the dihedral angles, the hydrogen bonds, and the disulfide bridges were added. Parameters of step number for molecular dynamics refinement, first-stage cooling, and second-stage cooling were set to 8000, 10,000, and 8000, respectively, using the CHARMM force field (parameter files parallhdg 5.3. pro and topallhdg5.3. pro). The software was set up to calculate 100 structures in the final iteration and the 50 best structures, according to the number of restraint violations, were kept for water minimization. The 25 best solutions were finally kept to define the three-dimensional structure of APETx2.
Visual analysis of the resulting structures was carried out with the TURBO software (Roussel and Cambillau 1989) as well as with Pymol graphic software (DeLano Scientific). The geometric quality of the final selection was assessed with PROCHECK 3.4 and PROCHECK-NMR software (Laskowski et al. 1996).
Electrostatic calculation
The electrostatic potential and dipole moment of the toxin were calculated using the GRASP software (Nicholls et al. 1991) running on a Silicon Graphics Workstation. This calculation includes all ionizable groups in the peptide, based on the Amber force field of the residues. The potential maps were calculated with a simplified Poisson-Boltzmann solver (Nicholls and Honig 1991; Nicholls et al. 1991).
Acknowledgments
We are grateful to Dr. L. Béress for the supply of A. elegantissima peptide fractions, and to Dr. L.D. Rash for final English editing. Benjamin Chagot is the recipient of a doctoral fellowship from the Ministère de l’Education Nationale, de l’Enseignement Supérieur et de la Recherche.
Abbreviations
APETx2, Anthopleura elegantissima toxin 2
ASIC, acid-sensing ion channel
Article published online ahead of print. Article and publication date are at http://www.proteinscience.org/cgi/doi/10.1110/ps.051378905.
References
- Bartels, C., Xia, T.H., Billeter, M., Güntert, P., and Wüthrich, K. 1995. The program XEASY for computer-supported NMR spectral analysis of biological macromolecules. J. Biomol. NMR 5 1–10. [DOI] [PubMed] [Google Scholar]
- Benson, C.J., Eckert, S.P., and McCleskey, E.W. 1999. Acid-evoked currents in cardiac sensory neurons: A possible mediator of myocardial ischemic sensation. Circ. Res. 84 921–928. [DOI] [PubMed] [Google Scholar]
- Bernard, C., Legros, C., Ferrat, G., Bischoff, U., Marquardt, A., Pongs, O., and Darbon, H. 2000. Solution structure of hpTX2, a toxin from Heteropoda venatoria spider that blocks KV4.2 potassium channel. Protein Sci. 9 2059–2067. [PMC free article] [PubMed] [Google Scholar]
- Bernard, C., Corzo, G., Adachi-Akahane, S., Foures, G., Kanemaru, K., Furukawa, Y., Nakajima, T., and Darbon, H. 2004. Solution structure of ADO1, a toxin extracted from the saliva of the assassin bug, Agriosphodrus dohrni. Proteins 54 195–205. [DOI] [PubMed] [Google Scholar]
- Chagot, B., Escoubas, P., Villegas, E., Bernard, C., Ferrat, G., Corzo, G., Lazdunski, M., and Darbon, H. 2004. Solution structure of Phrixotoxin 1, a specific peptide inhibitor of KV4 potassium channels from the venom of the theraphosid spider Phrixotrichus auratus. Protein Sci. 13 1197–1208. [DOI] [PMC free article] [PubMed] [Google Scholar]
- Chagot, B., Diochot, S., Pimentel, C., Lazdunski, M., and Darbon, H. 2005. Solution structure of APETx1 from of the sea anemone Anthopleura elegantissima: A new fold for an HERG toxin. Proteins 59 380–386. [DOI] [PubMed] [Google Scholar]
- Chen, C.C., Zimmer, A., Sun, W.H., Hall, J., and Brownstein, M.J. 2002. A role for ASIC3 in the modulation of high-intensity pain stimuli. Proc. Natl. Acad. Sci. 99 8992–8997. [DOI] [PMC free article] [PubMed] [Google Scholar]
- Dauplais, M., Lecoq, A., Song, J., Cotton, J., Jamin, N., Gilquin, B., Roumestand, C., Vita, C., de Medeiros, C.L., Rowan, E.G., et al. 1997. On the convergent evolution of animal toxins. Conservation of a diad of functional residues in potassium channel-blocking toxins with unrelated structures. J. Biol. Chem. 272 4302–4309. [DOI] [PubMed] [Google Scholar]
- Diochot, S., Schweitz, H., Béress, L., and Lazdunski, M. 1998. Sea anemone peptides with a specific blocking activity against the fast inactivating potassium channel KV3.4. J. Biol. Chem. 273 6744–6749. [DOI] [PubMed] [Google Scholar]
- Diochot, S., Loret, E., Bruhn, T., Bérres, L., and Lazdunski, M. 2003. APETX1, a new toxin from the sea anemone Anthopleura elegantissima, blocks voltage-gated human Ether-a-go-go-related gene potassium channel. Mol. Pharmacol. 64 59–69. [DOI] [PubMed] [Google Scholar]
- Diochot, S., Baron, A., Rash, L.D., Deval, E., Escoubas, P., Scarzello, S., Salinas, M., and Lazdunski, M. 2004. A new sea anemone peptide, APETx2, inhibits ASIC3, a major acid-sensitive channel in sensory neurons. EMBO J. 23 1516–1525. [DOI] [PMC free article] [PubMed] [Google Scholar]
- Escoubas, P., De Weille, J.R., Lecoq, A., Diochot, S., Waldmann, R., Champigny, G., Moinier, D., Menez, A., and Lazdunski, M. 2000. Isolation of a tarantula toxin specific for a class of proton-gated Na+ channels. J. Biol. Chem. 275 25116–25121. [DOI] [PubMed] [Google Scholar]
- Escoubas, P., Bernard, C., Lambeau, G., Lazdunski, M., and Darbon, H. 2003. Recombinant production and solution structure of PcTx1, the specific peptide inhibitor of ASIC1a proton-gated cation channels. Protein Sci. 12 1332–1343. [DOI] [PMC free article] [PubMed] [Google Scholar]
- Ferrat, G., Bernard, C., Fremont, V., Mullmann, T.J., Giangiacomo, K.M., and Darbon, H. 2001. Structural basis for α-K toxin specificity for K+ channels revealed through the solution 1H NMR structures of two noxiustoxin-iberiotoxin chimeras. Biochemistry 40 10998–11006. [DOI] [PubMed] [Google Scholar]
- Ferrat, G., Renisio, J.G., Morelli, X., Slootstra, J., Meloen, R., Cambillau, C., and Darbon H. 2002. A peptide mimic of an antigenic loop of α-human chorionic gonadotropin hormone: Solution structure and interaction with a llama V(HH) domain. Biochem. J. 366 415–422. [DOI] [PMC free article] [PubMed] [Google Scholar]
- Fremont, V., Blanc, E., Crest, M., Martin-Eauclaire, M.F., Gola, M., Darbon, H., and Van Rietschoten, J. 1997. Dipole moments of scorpion toxins direct the interaction towards small-or large-conductance Ca2+-activated K+ channels. Lett. Pept. Sci. 4 1–9. [Google Scholar]
- Inisan, A.G., Meunier, S., Fedelli, O., Altbach, M., Fremont, V., Sabatier, J.M., Thevan, A., Bernassau, J.M., Cambillau, C., and Darbon, H. 1995. Structure–activity relationship study of a scorpion toxin with high affinity for apamin-sensitive potassium channels by means of the solution structure of analogues. Int. J. Pept. Protein Res. 45 441–450. [DOI] [PubMed] [Google Scholar]
- Laskowski, R.A., Rullmannn, J.A., MacArthur, M.W., Kaptein, R., and Thornton, J.M. 1996. AQUA and PROCHECK-NMR: Programs for checking the quality of protein structures solved by NMR. J. Biomol. NMR. 8 477–486. [DOI] [PubMed] [Google Scholar]
- Linge, J.P., Habeck, M., Rieping, W., and Nilges, M. 2003. ARIA: Automated NOE assignment and NMR structure calculation. Bioinformatics 19 315–316. [DOI] [PubMed] [Google Scholar]
- Marion, D. and Wüthrich, K. 1983. Application of phase sensitive twodimensional correlated spectroscopy (COSY) for measurements of 1H-1H spin–spin coupling constants in proteins. Biochem. Biophys. Res. Commun. 113 967–1074. [DOI] [PubMed] [Google Scholar]
- Mosbah, A.,Kharrat, R., Fajloun, Z., Renisio, J.G., Blanc, E., Sabatier, J.M., El Ayeb, M., and Darbon, H. 2000. A new fold in the scorpion toxin family, associated with an activity on a ryanodine-sensitive calcium channel. Proteins 40 436–442. [DOI] [PubMed] [Google Scholar]
- Nicholls, A. and Honig, B. 1991. A rapid finite difference algorithm, utililizing successive over-relaxation to solve the Poisson-Boltzman equation. J. Comput. Chem. 12 435–445. [Google Scholar]
- Nicholls, A., Sharp, K.A., and Honig, B. 1991. Protein folding and association: Insights from the interfacial and thermodynamic properties of hydrocarbons. Proteins 11 281–296. [DOI] [PubMed] [Google Scholar]
- Piotto, M., Saudek, V., and Sklenar, V. 1992. Gradient-tailored excitation for single-quantum NMR spectroscopy of aqueous solutions. J. Biomol. NMR 2 661–665. [DOI] [PubMed] [Google Scholar]
- Poirot, O., Suhre, K., Abergel, C., O’Toole, E., and Notredame, C. 2004. 3D Coffee: A web server for mixing sequences and structures into multiple sequence alignments. Nucleic Acids Res. 32 37–40. [DOI] [PMC free article] [PubMed] [Google Scholar]
- Price, M.P., McIllwrath, S.L., Xie, J., Cheng, C., Qiao, J., Tarr, D.E., Sluka, K.A., Brennan, T.J., Lewin, G.R., and Welsh, M.J. 2001. The DRASIC cation channel contributes to the detection of cutaneous touch and acid stimuli in mice. Neuron 32 1071–1083. [DOI] [PubMed] [Google Scholar]
- Roussel, A. and Cambillau, C. 1989. Silicon graphics geometry partner directory, pp. 77–78. Silicon Graphics, Mountain View, CA.
- Sabatier, J.M., Fremont, V.,Mabrouk, K., Crest,M., Darbon, H., Rochat, H., Van Rietschoten, J., and Martin-Eauclaire, M.F. 1994. Leiurotoxin I, a scorpion toxin specific for Ca(2+)-activated K+ channels. Structure–activity analysis using synthetic analogs. Int. J. Pept. Protein Res. 43 486–495. [DOI] [PubMed] [Google Scholar]
- Sluka, K.A., Price, M.P., Breese, N.M., Stucky, C.L., Wemmie, J.A., and Welsh, M.J. 2003. Chronic hyperalgesia induced by repeated acid injections in muscle is abolished by the loss of ASIC3, but not ASIC1. Pain 106 229–239. [DOI] [PubMed] [Google Scholar]
- Sutherland, S.P., Benson, C.J., Adelman, J.P., and McCleskey, E.W. 2001. Acid-sensing ion channel 3 matches the acid-gated current in cardiac ischemia-sensing neurons. Proc. Natl. Acad. Sci. 98 711–716. [DOI] [PMC free article] [PubMed] [Google Scholar]
- Torres, A.M. and Kuchel, P.W. 2004. The β-defensin-fold family of polypeptides. Toxicon 44 581–588. [DOI] [PubMed] [Google Scholar]
- Waldmann, R. and Lazdunski, M. 1998. H(+)-gated cation channels: Neuronal acid sensors in the NaC/DEG family of ion channels. Curr. Opin. Neurobiol. 8 418–424. [DOI] [PubMed] [Google Scholar]
- Wüthrich, K. 1986. NMR of proteins and nucleic acids. Wiley, New York.