Abstract
Chemical glycosylation of proteins occurs in vivo spontaneously, especially under stress conditions, and has been linked in a number of cases to diseases related to protein denaturation and aggregation. It is the aim of this work to study the origin of the change in thermodynamic properties due to glucosylation of the folded β-lactoglobulin A. Under mild conditions Maillard products can be formed by reaction of ɛ-amino groups of lysines with the reducing group of, in this case, glucose. The formed conjugates described here have an average degree of glycosylation of 82%. No impact of the glucosylation on the protein structure is detected, except that the Stokes radius was increased by ~3%. Although at ambient temperatures the change in Gibbs energy of unfolding is reduced by 20%, the denaturation temperature is increased by 5°C. Using a combination of circular dichroism, fluorescence, and calorimetric approaches, it is shown that the change in heat capacity upon denaturation is reduced by 60% due to the glucosylation. Since in the denatured state the Stokes radius of the protein is not significantly smaller for the glucosylated protein, it is suggested that the nonpolar residues associate to the covalently linked sugar moiety in the unfolded state, thereby preventing their solvent exposure. In this way coupling of small reducing sugar moieties to solvent exposed groups of proteins offers an efficient and unique tool to deal with protein stability issues, relevant not only in nature but also for technological applications.
Keywords: β-lactoglobulin, Maillard reaction, protein stability, heat capacity, glycosylation, thermodynamics
A common mechanism for proteins in vivo to cope with stress conditions is to increase the degree of glycosylation (DG) (Murakami et al. 1997). Good examples of such response are found for heat shock proteins (Verma et al. 1988; Venetianer et al. 1994). Also from in vitro studies, it has been reported that glycosylation improves the conformational stability upon heating (Marshall and Rabinowitz 1976; Meldgaard and Svendsen 1994; Wang et al. 1996). Alternatively, deglycosylation of N-linked oligosaccharides has been reported to make some proteins more susceptible to aggregation on heat treatment (Endo et al. 1992). These studies exemplify that carbohydrate moieties attached to the protein surface are an important tool to regulate protein stability and can play an important role in the occurrence of misfolding and aggregation-related diseases (see, e.g., Ermonval et al. 2000). The thermodynamic mechanism behind the protein stabilizing role of sugar moieties is, however, unclear.
As demonstrated by Kosters et al. (2003) modification of globular protein surface charges with various reagents resulted in all cases studied in a lowering of the Gibbs energy of stabilization (ΔG). Moreover, the effect on the denaturation temperature (Td) scaled with a δ(ΔG)/δTd of ~0.03 kJ/mol residue/K (Kosters et al. 2003), as reported more often for various proteins (Rees and Robertson 2001). Most of the modifications/mutations affect the enthalpic contribution to the protein stability by engineering the charged groups on the protein surface, a strategy often employed by thermophiles (Grimsley et al. 1999; Loladze et al. 1999; Perl et al. 2000; Spector et al. 2000; Sanchez-Ruiz and Makhatadze 2001). Studies on glucosylation or fructosylation of β-lactoglobulin (b-LG) suggested, however, a different behavior (Broersen et al. 2004). The reaction of these reducing mono-sugars with primary amino groups (lysine-residues), at slightly elevated temperature (45°–55°C) for 3–5 h, yielded glycosylated proteins with high degree of modification (so-called Maillard- conjugates). These products displayed an increase in Td and at the same time a lower Gibbs energy of stabilization at ambient temperatures. The question arises what the origin is of the altered thermodynamics by glycosylation. Since such (reversible) conjugates are encountered in vivo, for example, in diabetic cataract formation (Stevens et al. 1978), an understanding of the thermodynamic impact of this specific modification is important. While altered enthalpy contributions to the protein Gibbs energy only “shift” the ΔG(T) curve, changes in the ΔCp affect the shape of this dependency.
It is the aim of this work to enlighten the origin of the change in thermodynamic properties caused byMaillardation of proteins. For that purpose we selected bovine whey protein β-lactoglobulin A (b-LGA), a protein with thermodynamic properties that are well documented (see, e.g., Griko and Privalov 1992). This protein is known to be susceptible in vivo to spontaneous lactosylation (Fogliano et al. 1998), and in processing (heat treatment) for technological applications often glycosylated forms of this protein are found. Applying a combination of methodologies to establish thermodynamic properties of the proteins, such as the ΔCp, together with determination of Stokes radii to evaluate changes in solvent accessible area, provides a new insight in the origin of the altered properties of the protein. The outcome is discussed in the light of both life science and technological consequences.
Results and Discussion
Glucosylation of b-LGA
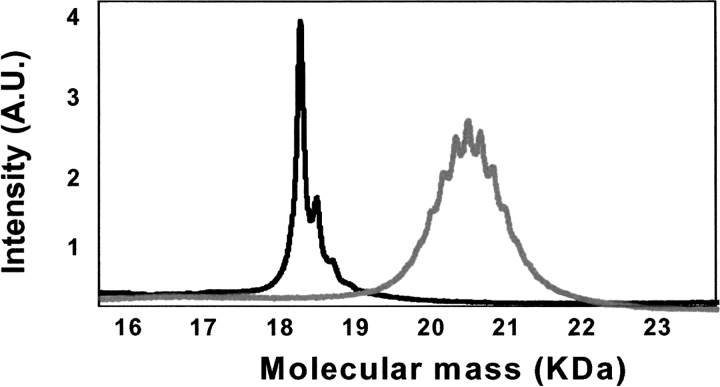
Figure 1 ▶ shows the mass spectrometric analysis of nonmodified and glucosylated b-LGA. The mass of b-LGA is 18,348 Da, in agreement with the expected mass (de Jongh et al. 2001). The small contributions at 223, 446, and 670 Da arise from matrix-adducts (mass of sinapinic acid is 224 Da). Upon formation of Maillard products with glucose, a symmetric Gaussian distribution of masses is found, centered at ~20,613 Da, corresponding with an average degree of modification of 82%(i.e., 14 primary amino groups have reacted with D-glucose). The width of the (symmetric) mass distribution indicates that the heterogeneity in the sample is limited to significant contributions of plus/minus one, two, and three sugar groups per protein only. Such heterogeneity is in agreement with previous findings (Broersen et al. 2004). The degree of modification was also confirmed by orthophthaldialdehyde (OPA) analysis, as described in detail in the Materials and Methods section. From the latter analysis, an ensemble-averaged number of reacted groups of 14 ± 1 was found (data not shown).
Figure 1.
Mass spectrometric analysis of nonmodified (black line) and glucosylated β-lactoglobulin A (gray line).
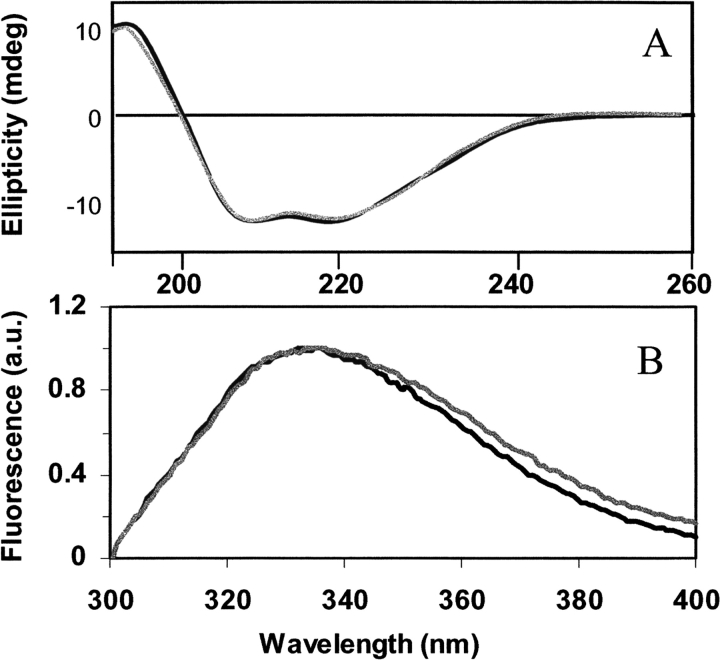
The impact of the modification on the structure of the protein was studied by using far-UV circular dichroism (CD) (Fig. 2A ▶), near-UV CD (data not shown), and tryptophan fluorescence (Fig. 2B ▶). As can be seen from Figure 2A ▶, the secondary structure was not affected by the glucosylation, based on the resemblance of the two spectra. The estimated secondary structure content of both proteins, using spectral shape analysis and suppliers software, indicated contributions of 54% β-strand, 15% α-helix, and 12% β-turn, in agreement with the resolved solution structure of the native protein (Molinari et al. 1996). That the local environment of the aromatic residues was also not significantly affected by the modification is illustrated in Figure 2B ▶ by the band positions of the two tryptophans in the protein (residues 19 and 61) that do not appear shifted by the modification. This was confirmed by near-UV CD spectra (data not shown). Moreover, from analysis of the tyrosine to tryptophan energy transfer efficiency by comparative excitation at 274 and 295 nm (data not shown) also no significant differences could be detected. It was already shown previously that glucosylated b-LGA was capable of adopting the noncovalent dimer-organization, just like the native protein (Broersen et al. 2004).
Figure 2.
Conformational properties of 0.1 mg/mL nonmodified (black lines) and glucosylated (gray lines) β-lactoglobulin A in 10 mM phosphate- buffer (pH 7.0) at 20°C at a secondary (far-UV CD) (A) and tertiary (tryptophan fluorescence) (B) folding level.
Conformational stability
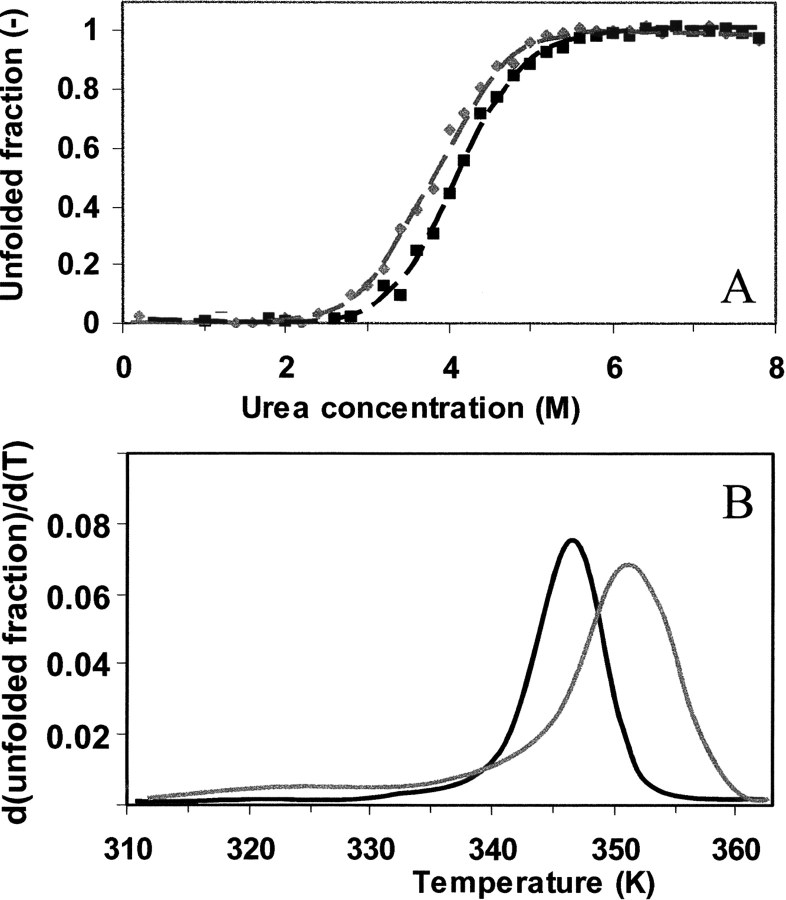
The energy change upon unfolding of the nonmodified and glucosylated b-LGA was studied by using urea denaturation experiments at 20°C, where the unfolding was monitored by detection of the tryptophan fluorescence spectra. Normalization of the fluorescence intensity at 320 nm and subsequent conversion to fraction unfolded proteins yield the curves shown in Figure 3A ▶. Upon glucosylation the midpoint of unfolding shifts ~0.35 M to lower urea concentration. Also, the steepness of the curve decreases. Based on the apparent sigmoidality of the curves, a two-state unfolding can be assumed (see, e.g., Jackson and Fersht 1991). Analysis of these curves using the linear extrapolation model yields values for the Gibbs energy change (ΔG) of 25.3 and 20.7 ( ± 0.3) kJ/mol for the nonmodified and glucosylated protein, respectively. It is important to note that the heterogeneity in the glucosylated sample (Fig. 1 ▶) does not result in a significant broadening of the sigmoidal curve, suggesting that the heterogeneity is not a source of variation in established ΔG’s.
Figure 3.
Evaluation of protein conformational stability. (A) Urea denaturation equilibrium study of nonmodified (black) and glucosylated (gray) β-lactoglobulin A as monitored by the tryptophan fluorescence at 320 nm as a function of the urea concentration at 20°C. The lines represent the fits of the two-state unfolding analysis of the data. (B) The CD intensity at 293 nm in the near-UV CD spectra is monitored as function of temperature for the two proteins. Upon reworking the observed intensities in terms of unfolded fraction and taking the derivative over temperature and subsequent smoothing, the curves presented in this panel are obtained.
When the denaturation temperatures of these proteins are evaluated, for example, using near-UV CD (Fig. 3B ▶) by taking the first derivative of the unfolded fraction over the temperature, it can be concluded that the midpoint of unfolding is shifted from 346 to 351 K due to the glucosylation.
Heat capacity changes
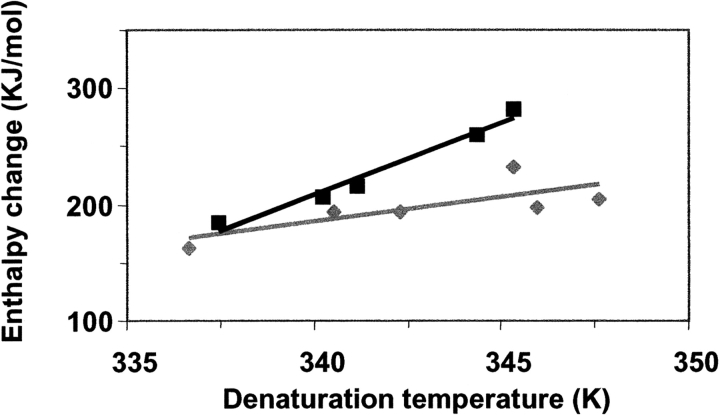
By monitoring the CD ellipticity at 293 nm as a function of temperature in the presence of various denaturant concentrations (data not shown), and subsequent analysis of these traces using a two-state unfolding model as described in detail by Pace (1986), a series of enthalpic changes with their corresponding denaturation temperature can be obtained. The results of these experiments are shown in Figure 4 ▶ for nonmodified and glucosylated b-LGA. The slope of these lines, [d(ΔH)/d(Td)], reflect the change in heat capacity (ΔCp) upon unfolding. For nonmodified b-LGA a value for ΔCp of 12.4 ( ± 0.6) kJ/ mol/K is then found, while that of the glucosylated protein is 4.2 ( ± 0.3) kJ/mol/K. Performing similar experiments by monitoring the fluorescence intensity as a function of temperature (data not shown) provided comparable results (11.8 and 3.8 kJ/mol/K, respectively). In literature ΔCp-values for native b-LG between 10 and 13 kJ/mol/K have been reported more frequently (see Griko and Privalov 1992).
Figure 4.
Enthalpy change of nonmodified (black symbols) and glucosylated (gray symbols) β-lactoglobulin A as a function of the denaturation temperature. Data are obtained by fitting temperature traces of near-UV CD intensities at 293 for various denaturant concentrations (0–3.2 M urea).
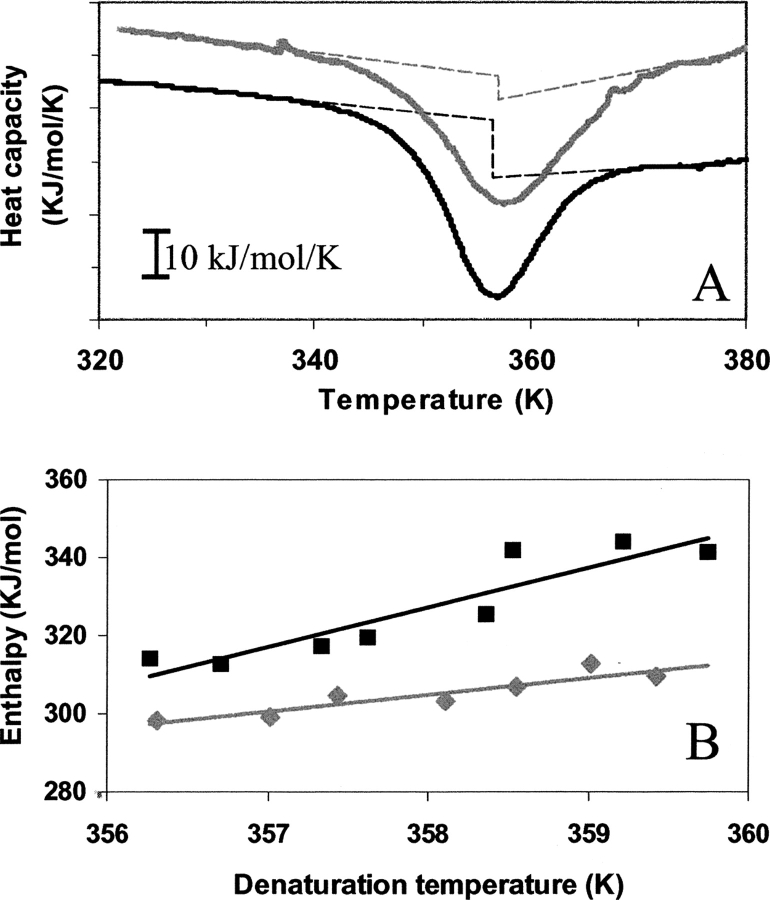
Since in the above-described procedure the local environment of the aromatic groups is monitored, and since it can not be excluded that this provides an incomplete picture of the whole molecule, differential scanning calorimetry was employed to establish ΔCp. This approach is often regarded as the most direct and appropriate technique, but in cases where the thermodynamic reversibility is poor due to extensive aggregation upon denaturation at the high protein concentrations used, as is the case for b-LG, derivation of thermodynamic parameters from the shape of recorded thermograms is complex. Moreover, at high temperatures the formed Maillard-products may react further (thereby changing protein functionalities), resulting in for example browning of the material. From the thermograms shown in Figure 5A ▶, it is evident that the “step” in Cp at the midpoint of the enthalpy change is smaller for the glucosylated protein compared with the nonmodified one. Alternatively, the change in enthalpy of denaturation as a function of denaturation temperature under various conditions (such as varying pH or phosphate content) (A.M.M. van Teeffelen, M.B.J. Meinders, and H.H.J. de Jongh, in prep.) provides an alternative route. By variation of the phosphate concentration at pH 2.0, where the protein is monomeric but still globular compact and where possible aggregation processes do not occur (in contrast to pH 7), again a series of enthalpy changes as a function of denaturation temperatures can be obtained. This is shown for the nonmodified protein in Figure 5B ▶. In each of the thermograms recorded (at either pH 2 or 7, where in the latter case this evaluation is sometimes hindered by an exothermic transition related to aggregation) the “step” at Td can be established. Values for the ΔCp of 10.7 ( ± 0.6) and 10.1 kJ/mol/K are in this way obtained for the nonmodified protein by using the d(ΔH)/d(Td) and Cp-step, respectively, while for the glucosylated protein in this way values of 4.3 ( ± 0.5) kJ/mol/K are found. It has to be noted that other enthalpic processes, such as dimer–monomer dissociation or aggregation, that may coincide with the denaturationmay foul the interpretation. Moreover, extensive heating of these samples eventually leads to progressive Maillard products as indicated by browning of the material. This latter process is, however, expected to give rise to a more gradual enthalpic contribution as a function of temperature around the protein denaturation temperature rather than a cooperative transition. In view of the agreement of the ΔCp-values obtained by DSC and the spectroscopic approaches, it can be concluded that these latter potential processes do not interfere with the evaluation of ΔCp here.
Figure 5.
(A) Differential scanning calorimetric profile of 20 mg/mL nonmodified (black line) and glucosylated (gray line) β-lactoglobulin A (b-LGA) in 10 mM phosphate-buffer (pH 7.0). The curves are displaced vertically for clarity. The dashed lines represent the baselines before and after denaturation. (B) Plot of the enthalpy change vs. the denaturation temperature for nonmodified (black symbols) and glucosylated (gray symbols) b-LGA as obtained using DSC (pH 2.0) and a varying phosphate concentration ranging from 0–200 mM.
Molecular interpretation of difference in ΔCp
How to explain an ~60% decrease in ΔCp upon glucosylation of the protein? An increase in heat capacity upon protein unfolding originates from the ordering of polar solvent molecules around the newly exposed nonpolar groups in proteins that were originally buried in the core of the native structure. Often changes in Cp are related (with good correlation) to changes in accessible surface area (ΔASA) (see, e.g., Baskakov and Bolen 1999). This can, for example, be established by determination of the Stokes radii using gel permeation chromatography (see, e.g., Uversky et al. 1993). From the elution profiles (data not shown) in the absence of denaturant, both proteins elute at the mass of the dimer, where the glucosylated protein appears slightly larger than the native dimer (Table 1). Angle-dependent light scattering (K. Broersen, unpubl.) and fluorescence correlation spectroscopy (FCS) (Table 1) confirmed this small (~3%) difference in Stokes radius. In the presence of 8 M urea, both proteins elute as monomer and their Stokes radii do not differ significantly. In 8M urea the proteins display still a certain compactness, as can be expected by the presence of two disulfide bridges that are still intact in the denatured protein, thereby limiting the conformational space in the unfolded state.
Table 1.
The Stokes radii (in Ångstroms) of nonmodified and glucosylated b-LGA as determined by size exclusion chromatography and fluoresence correlation spectroscopy
| Nonmodified | Glucosylated | |||
| GPCa | FCSb | GPCa | FCSb | |
| 0 M | 27.0 | 30.0 | 27.9 | 30.9 |
| 8 M | 35.7 | 36.8 | 36.1 | 36.2 |
aBased on calibration of the size exclusion column using a set of standard proteins with reported Stokes radii. R2-value of calibration line (elution volume vs. Stokes radius) was 0.996. Accuracy of established radii was ± 0.3Å.
b The Stokes radius was calculated according to r=kT/(6πηD), where D (diffusion coefficient) was calculated using x2 =2Dt, with x being the radius of the selected volume (0.22 μm) and t the observed diffusion time. The intrinsic viscosity was corrected for the contribution of 8 M urea according to the standard formula given by Kawahara and Tanford (1966). The estimated accuracy of the values was ± 0.4 Å.
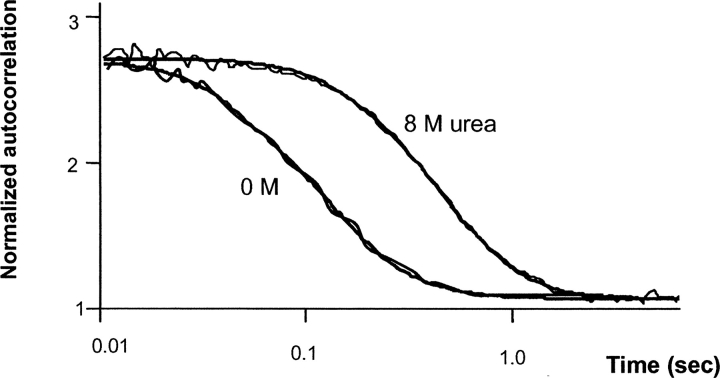
Another approach to evaluate the compactness of proteins is by determination of their apparent diffusion coefficient using FCS. Figure 6 ▶ shows examples of the autocorrelation functions of nonmodified b-LGA in the absence and presence of 8 M urea. Clearly the diffusion time is doubled in the presence of urea. From the diffusion times, the Stokes radius of the particles can be calculated as presented in Table 1 both for the nonmodified and glucosylated protein in the absence and presence of 8 M urea. Compared with size exclusion chromatography, the Stokes radii in the absence of urea are slightly higher, while those in 8 M urea are well comparable.
Figure 6.
Diffusion time of nonmodified β-lactoglobulin A in the presence of 0 and 8 M urea, as monitored by fluorescence correlation spectroscopy.
When a ΔASA of 8.5 Å2 upon unfolding for nonmodified b-LGA is assumed, the ΔASA of glucosylated protein could then be evaluated to be 7.5–8 Å2 (in view of the 3% larger radius at 0 M urea and the similar radius at 8 M urea). This might explain then a difference in ΔCp of ~0.4–0.5 kJ/mol/K between the two proteins, according to the equation described by Myers et al. (1995). This does, however, not account for the 6 kJ/ mol/K difference observed. Alternatively, when the nonpolar residues that become solvent exposed upon unfolding could associate to the covalently bound sugar moieties and thereby prevent full solvent exposure, this would significantly lower the ΔCp. In this way the nonmodified and glucosylated protein might unfold to the same degree but differ in hydrophobic exposure upon unfolding.
In principle, differences in ΔCp could also be the result of alterations in the hydration patterns of polar groups. We believe that in this case, where glucosylation of b-LG also leads to a reduced aggregation propensity (K. Broersen, M.B.J. Meinders, R.J. Hamer, and H.H.J. de Jongh, in prep.), this is a less dominant mechanism.
ΔG(T) envelopes
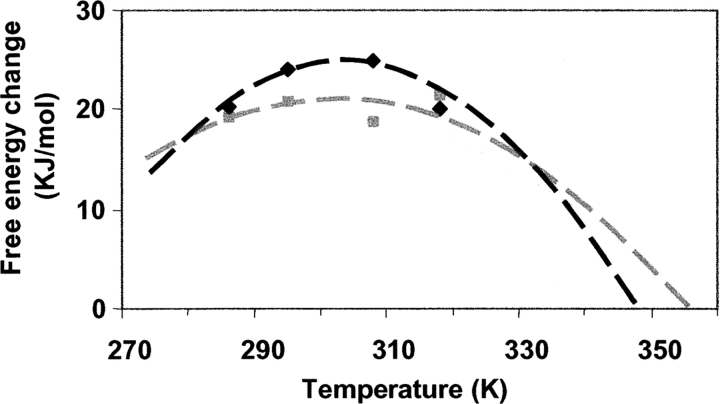
Using the data for ΔH and Td from DSC and ΔCp as evaluated as described above, the corresponding ΔG(T) envelopes can be constructed, based on the description provided by Greene and Pace (1974). These envelopes are depicted in Figure 7 ▶ by the dashed lines for nonmodified and glucosylated b-LGA. Alternatively, values for ΔG at individual temperatures can be derived by performing urea-titration studies at different temperatures and by monitoring intensity changes in the tryptophan fluorescence spectra (data not shown). These values are represented in Figure 7 ▶ by the symbols. Generally, the data points are close to the envelopes drawn. Fitting of the experimental data points to derive estimates for ΔH, ΔCp, and Td, as often employed in literature, did not give unambiguous results in this case. Despite elaborate attempts using multiple approaches to obtain quantitative numbers for ΔG at given temperatures for this system (for details, see A.M.M. van Teeffelen, M.B.J. Meinders, and H.H.J. de Jongh, in prep.), we did not feel confident to use these data to evaluate ΔCp in this way. For example, the established ΔG displayed a significant dependence on the frequency of analysis of the fluorescence spectrum.
Figure 7.
Change in Gibbs energy as a function of temperature. The dashed lines (black for nonmodified, gray for glucosylated b-LGA) are the established curves according to the method of Greene and Pace (1974) using data obtained by DSC (ΔH for nonmodified and glucosylated β-lactoglobulin A [b-LGA] are 380 and 340 kJ/mol, with corresponding Tds of 346 and 351 K, respectively). Values for ΔCp (11.0 and 4.5 kJ/mol for nonmodified and glucosylated b-LGA, respectively, are established as described in this work). The symbols reflect experimental values for nonmodified (black) and glucosylated (gray) b-LGA as derived from equilibrium denaturant unfolding studies carried out at different temperatures.
Implications of a lowered ΔCp
A lower ΔCp is inherent to a broader ΔG(T) envelope (Greene and Pace 1974). This provides the situation that at ambient temperature ΔG might be lower, but the protein displays a higher thermostability. Interestingly, when comparing this behavior with other modifications on surface charges of proteins (see, e.g., Kosters et al. 2003), it appears that glycosylation with monosaccharides is thus far the only alteration of functional groups on the protein surface studied that displays this effect. Interestingly, a lower degree of modification with oligo-sugar moieties (as studied in the past for fructose) but with the same total number of sugar moieties per protein did not display the increased thermo-stability (Trofimova and de Jongh 2004), but showed a positive δ(ΔG)/δTd. In this latter case, the flexibility of the attached oligosaccharide or the constraints on the polypeptide chain are too high to allow an efficient complexation of nonpolar residues to prevent solvent exposure.
Generally, a broader ΔG(T) envelope implies that the protein is conformationally stable in a larger temperature regime. In nature this provides a useful protection mechanism against heat- or cold-stress conditions. In technological applications this mechanism might lead to better preservation of enzyme activity during (heat or cold) processing. A lower aggregation propensity also offers an opportunity to direct the fraction of proteins that is still native after processing by allowing them to refold before they are prone to aggregate.
Conclusion
During the relatively mild condition under which Maillard products can be formed (in this study we used 5 h at 60°C, but lower temperatures can be used as well effectively) (Broersen et al. 2004), the ɛ-amino group of lysine reacts with the reducing group of a sugar to form Amadori’s or Heyn’s products via N-substituted glycosylamine. These mild conditions prevent the entering of advanced stages of Amadori’s and Heyn’s rearrangement products that at some point result in irreversible reaction products (e.g., responsible for brown coloring) (Röper et al. 1983; Mossine et al. 1994). Reversibility of these primary stages of the adducts hinder a proper identification of these products in situ. The nature of these post-folding modifications, however, affects in a unique way the thermodynamic properties of the protein, without changing the globular fold. The ~60% lower ΔCp of glucosylated b-LGA is believed to reflect the ability of these proteins to efficiently compensate an extensive hydration of nonpolar residues upon unfolding. Therefore, coupling of small reducing sugar moieties to proteins offers nature a unique tool to deal with protein stability issues. The presence of sugar moieties may suppress aggregation by increased net charge (for proteins with an acidic isoelectric point) or increased steric interference. This work poses that the reduction of exposed hydrophobicity upon unfolding can be strongly reduced by glycosylation, affecting thereby the aggregation propensity and the type of aggregate formed.
Materials and methods
Materials
OPA, 3,5-dimethoxy-4-hydroxycinnamic acid, D-(+)-glucose, NaCl, NaOH, L-leucine, NaNO2, acetonitrile, trifluoroacetic acid, acrylamide, 8-anilino-1-naphtalenesulfonic acid, Na2HPO4, NaH2PO4, D(−)-fructose, and 2-(dimethyl amino) ethanethiol hydrochloride were all of analytical grade and purchased from Sigma-Aldrich. N,N-dimethyl-2-mercaptoethylammonium-chloride (DMA), di-sodiumtetraboratdecahydrate (borax buffer), and urea were obtained from Merck; and Coomassie brilliant blue R-250, from Pharmacia. All chemicals were used without further purification.
b-LG was isolated and purified (>98% purity) from fresh cow milk (A:B ratio 60:40) using the protocol as described by de Jongh et al. (2001). Separation of the two genetic variants was performed on a Source 15Q column (Pharmacia), eluting the proteins in 20 mM bis-Tris (pH 6.0) buffer and using a 0–1 M NaCl gradient in 10 column volumes, and detection of the proteins at 214 nm. The two variants displayed a separation at baseline level. The pooled fractions were dialyzed extensively against demineralized water and stored at −40°C. b-LGA had a purity >99% as demonstrated by SDS-PAGE analysis and capillary electrophoresis.
Modification of b-LG
Five hundred milligrams b-LGA was dissolved in 50 mL demineralized water (10 mg/mL), and 500 mg D-glucose was added(molar ratio of primary amino groups:glucose=1:5). The pH was adjusted to pH 8.0 with 0.2MNaOH, and the solution was mixed and lyophilized. Next, the dried mixture was incubated in a stove for 5 h at 60°C under a NaNO3 saturated atmosphere (relative humidity of 65%). After dissolving the material in demineralized water and extensive dialysis (molecular weight cutoff 12–14 kDa) at 4°C to remove the nonreacted D-glucose, the material was lyophilized and stored at −20°C.
Analytical methods for product characterization
Chromogenic OPA assay
The DG is defined as the mole sugar groups reacted to a mole protein. The DG was determined indirectly by a chromogenic assay described by Kosters et al. (2003). This method is based on the specific reaction between OPA and free primary amino groups in proteins in the presence of DMA, resulting in alkyl-iso-indole derivatives that show absorbency at 340 nm. The OPA reagent was prepared by dissolving 40 mg OPA in 1 mL methanol, followed by the addition of 25 mL 0.1 M borax buffer, 200 mg DMA, and 5 mL 10% SDS. The volume was adjusted to 50 mL with demineralized water. Three milliliters reagents and 15 μL 0.3mMprotein solution were measured for absorbance at 340 nm in a quartz cuvette. The absorbance of the reagent itself was subtracted from the protein-containing sample. A calibration curve was obtained by adding aliquots of a 2 mM L-leucine (Sigma) solution in water to 3 mL OPA reagent. All measurements were performed in triplicate.
Matrix-assisted laser desorption/ionization time-of-flight mass spectrometry (MALDI-TOF-MS)
MALDI-TOF mass spectra were acquired in a linear mode on a Voyager-DE RP (PerSeptive Biosystems Inc.), controlled by Voyager RP Software. One μL of a 0.3 mM β-LG solution in demineralized water was mixed with 9 μL of a 3,5- dimethoxy-4-hydroxycinnamic acid matrix (10 mg/mL of 3,5- dimethoxy—hydroxy cinnamic acid in acetonitrile/0.3% trifluoroacetic acid/demineralized water [3:1:6, v/v/v]). Next, 2 μL of the final mixture was deposited on a 100-well golden plate and air-dried at room temperature in order to crystallize. Subsequently, the samples were analyzed at an accelerating voltage of 25 kV and an initial velocity of 350 m/sec by taking 250 shots per spectrum. The mass range (m/z) from 2 to 25 kDa was detected. Prior to each experiment, the apparatus was calibrated by using a series of reference proteins. All samples were both prepared and measured in duplicate.
Fluorescence experiments
Isothermal unfolding experiments
A 10 Murea stock solution was prepared by dissolving 1.1 g of urea per milliliter of PBS (0.166 mL 20mM Na2HPO4 and 0.833 mL 20 mM NaH2PO4 at pH 7.0). A protein stock solution (0.75 mg/mL in 10 mM PBS at pH 7.0) was diluted with the urea- solution in PBS, yielding final protein concentrations of 0.05 mg/mL with urea concentrations varying between 0 and 8 M. First, the samples were incubated at 20°C for at least 15 h, a condition shown previously to be sufficient to reach an apparent equilibrium in fluorescence intensity (A. van Teeffelen, unpubl.). Prior to measurement the samples were incubated for at least 1 h in the water bath connected to the fluorescence cell at a selected experiment temperature (between 10° and 45°C). After incubation the sample was transferred to a thermostated 1 mL quartz cell. The fluorescence emission was recorded between 300 and 400 nm upon excitation at 295 nm by using a scan speed of 100 nm/min and slit widths of 5 nm. The experiments were reproduced multiple times.
Thermal unfolding experiments
Thermal unfolding of samples of 0.05 mg/mL protein, containing 0–1.2 M urea and 1.2–2.8 M urea of b-LGA and glucosylated b-LGA respectively, were prepared as described above. The difference in the range of the urea concentrations is related to a matching of the denaturation temperatures of the two systems. The sample was heated from 15°–100°C with a heating rate of 1 K/min. The fluorescence emission was recorded at 360 nm after excitation at 295 nm by using slit widths of 5 nm. The experiments were reproduced two times.
CD experiments
Spectra acquisition
Far-UV CD spectra of 0.1 mg/mL of protein in 10 mM phosphate buffer (pH 7.0) were recorded at 20°C in the spectral range from 190 to 260 nm on a Jasco J-715 spectropolarimeter (Jasco Corp.). Quartz cuvettes were used with an optical path of 0.1 cm. The spectral resolution was 0.5 nm. The scan speed was 100 nm/min, and the response time was 0.125 sec with a bandwidth of 1 nm. Typically eight scans were accumulated and subsequently averaged. The spectra were corrected for the corresponding protein-free sample. Near-UV spectra were acquired in a similar way as described above by using 1 mg/mL samples and an optical path of 1 cm.
Thermal unfolding experiments
The ellipticity of 1 mg/mL protein solutions (containing 0.4– 3.2 M urea) in 10 mM phosphate buffer (pH 7.0) was monitored at 293 nm from 20°–90°C with a heating-rate of 1 K/min. Quartz cuvettes were used with an optical path of 1 cm. The response time was 8 sec, and the bandwidth 1 nm. The experiments were performed in duplicate.
Differential scanning calorimetry
Samples of 20 mg/mL protein were prepared in a 10mM phosphate buffer (pH 7.0). Prior to measurements, all samples were degassed and kept at 20°C. After 15 min of thermal equilibration of the 0.9 mL sample in the DSC cell (Setaram), the sample was heated up to 120°C with a heating rate of 1°C/min. Using lower heating rates did not affect the obtained results (data not shown). The heat flow to the cell containing the protein solution was recorded relative to that of the corresponding buffer. As baseline a scan was recorded where both cells contained buffer. The experiments were performed at least in duplicate.
FCS experiments
The FCS setup has basically been described in detail elsewhere (Widengren and Rigler 1998). For excitation of Bodipy TMR-labeled proteins (maximum one per protein) an argon ion laser of 535 nm was used. The laser beam was focused by a lens in front of an epi-illuminated microscope, reflected by a dichroic mirror (Leitz TK580) and refocused on the image plane of a water immersion objective (Zeiss Plan- Neofluar 63 X NA 1.2). The alignment and focusing of the setup was checked by measuring the correlation function of 0.2 nM Bodipy TMR (Molecular Probes Inc.) in 10 mM buffer (pH 7.0) prior and after each experiment. A detailed description of the theoretical background and an evaluation of the correlation function are given elsewhere (Widengren and Rigler 1998). The fluctuation in fluorescence intensity in time was analyzed by using a procedure described in detail elsewhere (Digris et al. 1999).
Gel permeation chromatography
A Superdex HR 75 (10/30) column connected to an Äkta purifier (Amersham Biosciences) was used to determine the Stokes radii (Rs) of proteins according to the method of Uversky (1993). Proteins were dissolved in 10 mM phosphate (pH 7.0) and eluted in 10 mM phosphate containing 0.15 M NaCl (pH 7.0). Alternatively, the column was pre-equilibrated with 20 column volumes of the same buffer containing 8 M urea, and preincubated proteins in 8 M urea (as described above) were eluted from the column in the corresponding urea-buffer (pH 7.0). Protein detection was at 214 nm. A calibration curve (1000/Velution (mL−1) versus (Rs)) was made using a series of six proteins with known Stokes radii yielding an R2 of 0.96.
Article published online ahead of print. Article and publication date are at http://www.proteinscience.org/cgi/doi/10.1110/ps.051405005.
References
- Baskakov, I.V. and Bolen, D.W. 1999. The paradox between m values and ΔCp’s for denaturation of ribonuclease T with disulfides bonds intact and broken. Protein Sci. 8 1314–1319. [DOI] [PMC free article] [PubMed] [Google Scholar]
- Broersen, K., Voragen, A.G.J., Hamer, R.J., and de Jongh, H.H.J. 2004. Glycoforms of β-lactoglobulin with improved thermostability and preserved structural packing. Biotech. Bioeng. 86 78–87. [DOI] [PubMed] [Google Scholar]
- de Jongh, H.H.J., Gröneveld, T., and de Groot, J. 2001. Mild isolation procedure discloses new protein structural properties of β-lactoglobulin. J. Dairy Sci. 84 562–571. [DOI] [PubMed] [Google Scholar]
- Digris, A.V., Skakun, V.V., Novikov, E.G., van Hoek, A., Claiborne, A., and Visser, A.J.W.G. 1999. Thermal stability of a flavoprotein assessed from associative analysis of polarized time-resolved fluorescence spectroscopy. Eur. Biophys. J. 28 526–531. [DOI] [PubMed] [Google Scholar]
- Endo, Y., Nagai, H., Watanabe, Y., Ochi, K., and Takagi, T. 1992. Heat-induced aggregation of recombinant erythropoietin in the intact and deglycosylated states as monitored by gel-permeation chromatography combined with a low-angle laser-light scattering technique. J. Biochem. (Tokyo) 112 700–706. [DOI] [PubMed] [Google Scholar]
- Ermonval, M., Duvet, S., Zonneveld, D., Cacan, R., Buttin, G., and Braakman, I. 2000. Truncated N-glycans affect protein folding in the ER of CHO-derived mutant cell lines without preventing calnexin binding. Glycobiology 10 77–87. [DOI] [PubMed] [Google Scholar]
- Fogliano, V., Monti, S.M., Visconti, A., Randazzo, G., Facchiano, A.M., Colonna, G., and Ritieni, A. 1998. Identification of a β-lactoglobulin lactosylation site. Biochim. Biophys. Acta 1388 295–304. [DOI] [PubMed] [Google Scholar]
- Greene, R.F. and Pace, C.N. 1974. Urea and guanidine hydrochloride denaturation of ribonuclease, lysozyme, α-chymotrypsin, and β-lactoglobulin. J. Biol. Chem. 249 5388–5393. [PubMed] [Google Scholar]
- Griko, Y.V. and Privalov, P.L. 1992. Calorimetric study of the heat and cold denaturation of β-lactoglobulin. Biochemistry 31 8810–8815. [DOI] [PubMed] [Google Scholar]
- Grimsley, G.R., Shaw, K.L., Fee, L.R., Alston, R.W., Huyghues-Despointes, B.M., Thurlkill, R.L., Scholtz, J.M., and Pace, C.N. 1999. Increasing protein stability by altering long-range coulombic interactions. Protein Sci. 8 1843–1849. [DOI] [PMC free article] [PubMed] [Google Scholar]
- Jackson, S.E. and Fersht, A.R. 1991. Folding of chymotrypsin inhibitor 2, 1: Evidence for a two-state transition. Biochemistry 30 10428–10435. [DOI] [PubMed] [Google Scholar]
- Kawahara, K. and Tanford, C. 1966. Viscosity and density of aqueous solutions of urea and guanidine hydrochloride. J. Biol. Chem. 241 3228–3232. [PubMed] [Google Scholar]
- Kosters, H.A., Broersen, K., de Groot, J., Simons, J.W.F.A., Wierenga, P.A., and de Jongh, H.H.J. 2003. Chemical processing as a tool to generate ovalbumin variants with changed stability. Biotech. Bioeng. 84 61–70. [DOI] [PubMed] [Google Scholar]
- Loladze, V.V., Ibarra-Molero, B., Sanchez-Ruiz, J.M., and Makhatadze, G.I. 1999. Engineering a thermostable protein via optimisation of charge-charge interactions on the protein surface. Biochemistry 38 16419–16423. [DOI] [PubMed] [Google Scholar]
- Marshall, J.J. and Rabinowitz, M.L. 1976. Preparation and characterization of a dextran-trypsin conjugate. J. Biol. Chem. 251 1081–1087. [PubMed] [Google Scholar]
- Meldgaard, M. and Svendsen, I. 1994. Different effects of N-glycosylation on the thermostability of highly homologous bacterial (1,3–1,4)-β- glucanases secreted from yeast. Microbiology 140 159–166. [DOI] [PubMed] [Google Scholar]
- Molinari, H., Ragona, L., Varani, L., Musco, G., Consonni, R., Zetta, L., and Monaco, H.L. 1996. Partially folded structure of monomeric bovine β-lactoglobulin. FEBS Lett. 381 237–243. [DOI] [PubMed] [Google Scholar]
- Mossine, V.V., Glinsky, G.V., and Feather, M.S. 1994. The preparation and characterization of some amadori compounds (1-amino-1-deoxy-d-fructose derivatives) derived from a series of aliphatic omega-amino acids. Carbohydr. Res. 262 257–270. [DOI] [PubMed] [Google Scholar]
- Murakami, M.K., Nishikawa, K., Hirakawa, E., and Murofushi, H. 1997. Heat stress induces a glycosylation of membrane sterol in myxoamoebae of a true slime mold, Physarum polycephalum. J. Biol. Chem. 272 486–489. [DOI] [PubMed] [Google Scholar]
- Myers, J.K., Pace, C.N., and Scholtz, J.M. 1995. Denaturant m values and heat capacity changes: Relation to changes in accessible surface areas of protein unfolding. Protein Sci. 4 2138–2148. [DOI] [PMC free article] [PubMed] [Google Scholar]
- Pace, C.N. 1986. Determination and analysis of urea and guanidine hydrochloride denaturation curves. Methods Enzymol. 131 266–280. [DOI] [PubMed] [Google Scholar]
- Perl, D., Mueller, U., Heinemann, U., and Schmid, F.X. 2000. Two exposed amino acid residues confer thermostability on a cold shock protein. Nat. Struct. Biol. 7 380–383. [DOI] [PubMed] [Google Scholar]
- Rees, D.C. and Robertson, A.D. 2001. Some thermodynamic implications for the thermostability of proteins. Protein Sci. 10 1187–1194. [DOI] [PMC free article] [PubMed] [Google Scholar]
- Röper, H., Röper, S., Heyns, K., and Meyer, B. 1983. N.m.r. spectroscopy of N-(1-deoxy-D-fructos-1-yl)-L-amino acids (“fructose-amino acids”). Carbohydr. Res. 116 183–195. [Google Scholar]
- Sanchez-Ruiz, J.M. and Makhatadze, G.I. 2001. To charge or not to charge? Trends Biotechnol. 19 132–134. [DOI] [PubMed] [Google Scholar]
- Spector, S., Wang, M., Carp, S.A., Robblee, J., Hendsch, Z.S., Fairman, R., Tidor, B., and Raleigh, D.P. 2000. Rational modification of protein stability by mutation of charged surface residues. Biochemistry 39 872–879. [DOI] [PubMed] [Google Scholar]
- Stevens, V.J., Rouzer, C.A., Monnier, V.M., and Cerami, A. 1978. Diabetic cataract formation: Potential role of glycosylation of lens crystallins. Proc. Natl. Acad. Sci. 75 2918–2922. [DOI] [PMC free article] [PubMed] [Google Scholar]
- Trofimova, D. and de Jongh, H.H.J. 2004. Modification of β-lactoglobulin by oligo-fructose: Impact on protein adsorption at the air-water interface. Langmuir 20 5544–5552. [DOI] [PubMed] [Google Scholar]
- Uversky, V.N. 1993. Use of fast protein size-exclusion liquid chromatography to study the unfolding of proteins which denature through the molten globule. Biochemistry 32 13288–13298. [DOI] [PubMed] [Google Scholar]
- Venetianer, A., Pirity, M., and Hever, S.A. 1994. The function of heat-shock proteins in stress tolerance. Cell Biol. Int. 18 605–615. [DOI] [PubMed] [Google Scholar]
- Verma, R., Iida, H., and Pardee, A.B. 1988. Identification of a novel stress-inducible glycoprotein in Saccharomyces cerevisiae, I: Preliminary characterization. J. Biol. Chem. 263 8569–8575. [PubMed] [Google Scholar]
- Wang, C., Eufemi, M., Turano, C., and Giartosio, A. 1996. Influence of the carbohydrate moiety on the stability of glycoproteins. Biochemistry 35 7299–7307. [DOI] [PubMed] [Google Scholar]
- Widengren, J. and Rigler, R. 1998. Fluorescence correlation spectroscopy as a tool to investigate chemical reactions in solutions and on cell surfaces. Cell. Mol. Biol. 44 857–879. [PubMed] [Google Scholar]


