

Abstract
A model structure of the Hsc70/auxilin complex has been constructed to gain insight into interprotein substrate transfer and ATP hydrolysis induced conformational changes in the multidomain Hsc70 structure. The Hsc70/auxilin system, which is a member of the Hsp70/Hsp40 chaperone system family, uncoats clathrin-coated vesicles in an ATP hydrolysis-driven process. Incorporating previous results from NMR and mutant binding studies, the auxilin J-domain was docked into the Hsc70 ATPase domain lower cleft using rigid backbone/flexible side chain molecular dynamics, and the Hsc70 substrate binding domain was docked by a similar procedure. For comparison, J-domain and substrate binding domain docking sites were obtained by the rigid-body docking programs DOT and ZDOCK, filtered and ranked by the program ClusPro, and relaxed using the same rigid backbone/flexible side chain dynamics. The substrate binding domain sites were assessed in terms of conserved surface complementarity and feasibility in the context of substrate transfer, both for auxilin and another Hsp40 protein, Hsc20. This assessment favors placement of the substrate binding domain near D152 on the ATPase domain surface adjacent to the J-domain invariant HPD segment, with the Hsc70 interdomain linker in the lower cleft. Examining Hsc70 interdomain energetics, we propose that long-range electrostatic interactions, perhaps due to a difference in the pKa values of bound ATP and ADP, could play a major role in the structural change induced by ATP hydrolysis. Interdomain electrostatic interactions also appear to play a role in stimulation of ATPase activity due to J-domain binding and substrate binding by Hsc70.
Keywords: protein-protein docking, molecular modeling, DELPHI, solvation enthalpy and free energy, DnaJ DnaK, cyclin G-associated kinase GAK, distance-dependent dielectric, nucleotide binding, X-ray
The Hsc70/auxilin complex belongs to the Hsp70/Hsp40 family, a chaperone system best known for its role in the heat shock response (Hsp: heat-shock protein; Hsc: heat-shock cognate). The primary role of the Hsp70/Hsp40 chaperone system is to help nascent proteins fold and to prevent protein aggregation (Fink 1999). Further study of these heat-shock proteins and their homologs has revealed a much wider role for this chaperone system in both prokaryotes and eukaryotes, carrying out such functions as protein translocation across membranes and multimeric protein complex assembly and disassembly. An emerging theme for Hsp40 homologs is their role as adaptor proteins, each tailored to a special role through the presence of target-specific domains, and each containing a J-domain responsible for recruiting its Hsp70 partner to the target site (Kelley 1998; Young et al. 2003). Considerably less varied than the Hsp40 proteins, Hsp70 proteins bind tightly to locally unfolded peptides of Hsp40-bound targets in an ATP-hydrolysis–driven process. Understanding how J-domain containing proteins present their specific substrates for binding by Hsp70 has been hampered for several reasons. First, the structure of the intact Hsp70 protein is not known, although structures of its two domains, the ATPase domain and the substrate binding domain (SBD), have been solved separately (Flaherty et al. 1990; Zhu et al. 1996). Without the structure of intact Hsp70, it is unclear how ATP hydrolysis in the ATPase domain is translated into changes in the substrate binding properties of the SBD domain. Second, although several J-domain structures have been solved, much less is known structurally about the target-specific binding and interaction of the corresponding full-length Hsp40 homologs. Finally, although the interaction interface between the J-domain and the ATPase domain of Hsp70 has been determined (Gässler et al. 1998; Greene et al. 1998; Genevaux et al. 2002), this contribution to the understanding of substrate transfer is limited because the location of the Hsp70 substrate binding domain (SBD) relative to the ATPase domain is not known.
Progress towards understanding the Hsp70/Hsp40 substrate transfer process includes the determination of three new structures of J-domains including their substrate interacting domains (Cupp-Vickery and Vickery 2000; Kim et al. 2001; Gruschus et al. 2004), and various experiments indicating a large structural change in the Hsp70 protein upon binding ATP, which is necessary for J-domain binding (Johnson and McKay 1999; King et al. 1999; Suh et al. 1999; Jiang et al. 2000). In this study, we combine what is experimentally known for the Hsp70/Hsp40 chaperone system with molecular modeling to gain further insight into the substrate transfer process. The Hsp40 homolog auxilin was chosen as the system to be modeled system because, of all J-domain protein structures known, its substrate binding domain is probably the best characterized, both structurally and biochemically (Kelley 1998; Scheele et al. 2003; Gruschus et al. 2004). The substrate of auxilin is clathrin, and auxilin recruits its Hsp70 partner Hsc70 to uncoat clathrin-coated vesicles in an ATP-driven process (Ungewickell et al. 1995; Jiang et al. 2000). Fortunately, the structures of both domains of mammalian Hsc70 are known. Despite considerable experimental information identifying the lower cleft of the ATPase domain as the J-domain binding site (Gässler et al. 1998; Suh et al. 1998; Genevaux et al. 2002), to date, no molecular model has been produced. Therefore, as the first step in the modeling, we have docked auxilin into the lower cleft of the ATPase domain using molecular dynamics. Then, using this complex, we have explored the full range of possible SBD docking sites. These sites are assessed in terms of the interaction energetics with the ATPase domain and J-domain, compatibility with experimental observations, the amount of conserved residue surface area at the interface, and the proximity of the J-domain protein substrate interacting region to the peptide binding groove of the SBD. The last two criteria turn out to be the most crucial in discriminating among the SBD sites. Examining the locations of the substrate binding regions, using both auxilin and another new Hsp40 structure that includes its substrate interacting region, Hsc20 (Cupp-Vickery and Vickery 2000), the model complex favors placement of the SBD on the ATPase domain surface adjacent to the invariant HPD segment of the bound J-domain. Finally, we examine the role of long-range electrostatic interactions between the two domains of Hsc70 in inducing change in the interdomain structure and in stimulation of ATP hydrolysis upon binding substrate and the J-domain.
Results
Docking auxilin to Hsc70 ATPase
The binding interface between the J-domain and the ATPase domain of Hsc70 has been located through a number of mutant binding studies (Gässler et al. 1998; Suh et al. 1998; Genevaux et al. 2002) and NMR chemical shift perturbation studies (Greene et al. 1998; Landry 2003). Figure 1A ▶ summarizes these results visually. These studies identify the lower cleft, also called the minor cleft, of the ATPase domain as the binding site with the HPD loop and the preceding helix comprising the J-domain interface. The lower cleft lies between the two subdomains of the ATPase domain on the opposite side of where the ATP binding cleft is located.
Figure 1.

The auxilin J-domain/ATPase interface. (A) Summary of residues determined to be involved in ATPase/J-domain interaction by mutation (red and yellow) and NMR (pink). The J-domain of auxilin is shown on the left, and the ATPase domain on the right, with the interaction interface surfaces of both proteins facing the viewer. The two red residues are a rescue mutant pair; function lost by the D35N J-domain mutation is restored by a R171H ATPase mutation in the bacterial DnaK/DnaJ system (Gässler et al. 1998). ATPase residue D206, critical for the ATP-induced conformational change of Hsp70 and part of the ATPase active site cleft, is also shown. Residues whose mutation did not affect interaction are shown in dark gray. The J-domain residue numbers correspond to DnaJ except for K847, which is unique to auxilin. (B) Electrostatic potential surfaces at the ATPase/J-domain interface. Blue represents positive potential; red, negative. The J-domain “positive patch” corresponds to the prominent blue area on the auxilin J-domain surface. The ATPase domain acidic region corresponds to the red area to the left and in the bottom portion of the “lower cleft,” seen running vertically through the middle of the ATPase surface in this view.
The most useful result of the mutant studies in terms of molecular modeling is a rescue mutant pair by which loss of function due to a D35N mutation of the DnaJ J-domain was restored by an R167H mutation in DnaK (R171 in Hsc70; Suh et al. 1998), where DnaJ and DnaK are the Escherichia coli analogs of mammalian Hsp40 and Hsc70. Both these residues are invariant and found in very similar positions in the E. coli and mammalian crystal structures (Flaherty et al. 1990; Gruschus et al. 2004). Although it is possible this residue pair interacts through an allosteric mechanism, more likely they lie near each other in the complex because both residues are fully solvent-exposed in the unbound domains. This information, combined with the other mutant binding study results, is sufficient to orient the J-domain in the lower cleft of the ATPase domain. Another J-domain feature that independently verifies this binding orientation is the positive patch, a surface region of primarily positive residues (Greene et al. 1998; Jiang et al. 2003). One expects a corresponding negative patch in the lower cleft region of Hsc70, and indeed, there is such an acidic region, corresponding to Hsc70 residues 199 through 234, as shown in Figure 1B ▶. Inserting the J-domain HPD loop and preceding helix into the part of the Hsc70 lower cleft defined by the mutant binding results, such that the positive patch of auxilin contacts the negative region of the lower cleft, necessitates R167 (R171) being placed close (<8 Å) to D35 (D876).
To better characterize the lower cleft binding site, molecular dynamics (MD) was performed using as starting structures 12 different NMR structures of the auxilin Aux-C20 construct in various initial orientations and translated 8 to 12 Å away from the ATPase domain lower cleft. The Aux-C20 construct used in the NMR structure determination contains the J-domain and the preceding clathrin binding region and is the minimal functional fragment of auxilin required for catalytic uncoating of clathrin-coated vesicles (Ma et al. 2002; Gruschus et al. 2004). The backbones of both the ATPase domain and Aux-C20 were kept semirigid, while the side chains of Aux-C20 and the ATPase side chains of the lower cleft and surrounding residues were fully flexible (Fig. 2 ▶; see Materials and Methods). The non-solvated 100-psec dynamics allowed the complementary electrostatics of the interface to redock the complex and explored the conformational space of possible side chain contacts between the domains. As controls, four more dynamics runs were performed: three with “incorrect” initial conformations, and one with no electrostatic interactions (see Materials and Methods).
Figure 2.
Docking of the auxilin J-domain to the ATPase domain of Hsc70. The backbone of auxilin is shown in violet, and the mesh of Cα-Cα distance restraints are indicated by dashed red lines. The portion of the ATPase domain kept fixed during the docking dynamics is shown in black, while the backbone shown in blue is kept tethered during the dynamics.
To compare with the lower cleft binding results, six additional potential J-domain binding sites were generated using rigid-body docking programs, three with DOT (Vakser 1995; Mandell et al. 2001) and three with ZDOCK (Chen et al. 2003). Each program generated 20,000 decoys, which were then clustered, filtered (including side-chain energy minimization), and ranked by the ClusPro program (Camacho et al. 2000; Comeau et al. 2004). Docking the structures of the free Aux-C20 and free Hsc70 ATPase domain produced no lower cleft binding sites in the 10 highest ranked DOT and ZDOCK hits. The majority of hits lay near the ATP binding cleft. However, when given the structures of Aux-C20 and the ATPase domain already docked at the lower cleft binding site by dynamics, the third highest ranked ZDOCK structure was docked the same way in the lower cleft, although none of the DOT structures were. The three highest ranking hits from ZDOCK and from DOT (see Materials and Methods) were kept for comparison with the lower cleft binding results, and are shown in Figure 3C ▶. To relax side chain conformations, these six structures were also subjected to the same dynamics as the lower cleft bound structures described above, except that only 50 psec of dynamics was performed instead of 100 psec because the DOT and ZDOCK structures were already docked.
Figure 3.

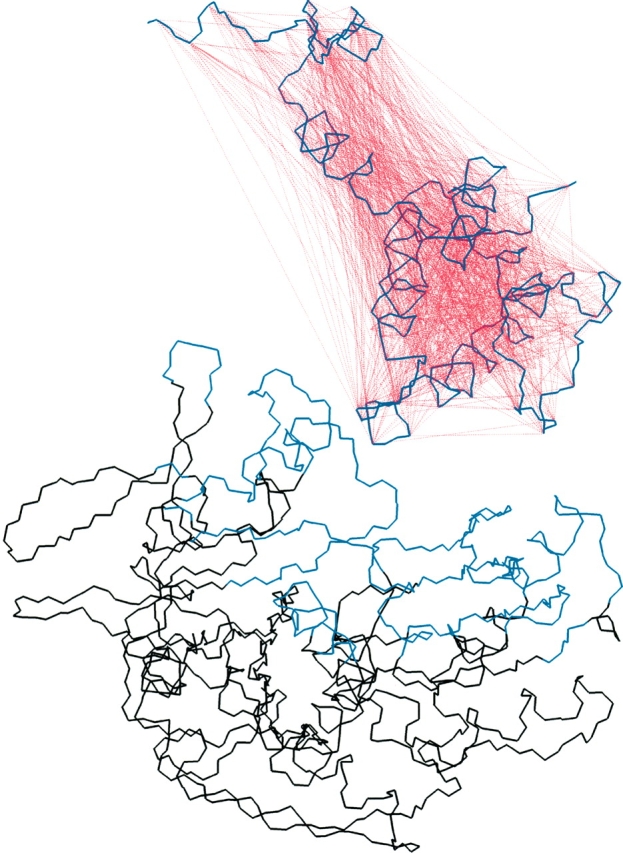
The ensembles of auxilin J-domain structures docked to the Hsc70 ATPase domain. The set of docked J-domains with interfaces most consistent with experiment, the “good” set, is shown on the left (A). The good set has the HPD-loop and preceding helix of the J-domain most fully inserted into the lower cleft. Those docked structures not fully consistent with experiment, the “nonconverged” set including the controls, are shown on the right (B). The three DOT (D1–3) and three ZDOCK (Z1–3) docking sites are shown in (C). The Z3 docking site corresponds to the experimentally determined lower cleft binding site. The ATPase domain is magenta, shown with a bound nucleotide in green.
Following the MD simulations of the lower cleft site structures, the Aux-C20/ATPase interface of each docked structure was examined for agreement with the experimental results. In five of the structures (the “good” set), the docked Aux-C20 conformations were quite similar and their interfaces consistent with the experimental data, as was the structure docked in the lower cleft by the program ZDOCK. For the remaining lower cleft structures (the “nonconverged” set), there was no convergence to any similar docked conformation, nor were their interfaces fully consistent with experimental results. The main difference between the two sets was the depth of insertion into the lower cleft of the J-domain helix preceding the HPD loop. A comparison of these two sets of structures is shown in Figure 3, A and B ▶, and convergence statistics are given in Table 1.
Table 1.
Aux-C20/ATPase domain docking energies, buried surface areas, and convergence statistics
| Good set | Nonconverged set | |
| Interaction energies (kcal/mole): | ||
| A. Direct electrostatic | −159 ± 6 | −93 ± 35 |
| B. van der Waals | −42 ± 7 | −31 ± 6 |
| C. Desolvation enthalpy | +183 ± 12 | +115 ± 38 |
| D. Desolvation free energy | +124 ± 15 | +93 ± 17 |
| A + B + D | −76 ± 5 | −31 ± 27 |
| Buried interface surface (Å2): | ||
| Buried hydrophobic | 606 ± 162 | 362 ± 115 |
| Buried hydrophilic | 582 ± 100 | 428 ± 145 |
| Buried conserved Aux-C20 | 239 ± 67 | 177 ± 53 |
| Buried conserved ATPase | 569 ± 55 | 455 ± 85 |
| Backbone RMSD (Å)a | ||
| All initial Aux-C20 combined | 9.4 | |
| Initial Aux-C20 by set | 5.3 | 11.2 |
| Final Aux-C20 by set | 2.1 | 10.0 |
a For residues 814–905 of auxilin, found by aligning the ATPase domain. Combined and “nonconverged” set RMSD calculations did not include control structures with purposely “incorrect” initial structures (see Materials and Methods).
Examining the MD trajectories showed that Aux-C20 typically contacted the ATPase domain in the first 2 psec and translated very little from this point of initial contact. Instead, Aux-C20 would pivot about this initial contact during the following 10 psec to achieve additional contacts, maintaining this interface for the rest of the simulation. In the case of the seven noncontrol structures in the nonconverged set, it seems the initial contact was too far from the lower cleft to allow Aux-C20 to pivot inside. During the MD of the six structures docked by DOT and ZDOCK, the initial docking interface was maintained and slightly increased through relaxation of side chain conformations and small rotations of Aux-C20.
Direct electrostatic and van der Waals energies of interaction between Aux-C20 and the ATPase domain were calculated, and the averages for the good and nonconverged sets of lower cleft structures are given in Table 1. For the six complexes docked by DOT and ZDOCK, the energies of interaction are given in Table 2. Electrostatic desolvation enthalpies due to complex formation, calculated with DELPHI (Nicholls and Honig 1991) are also shown, as well as empirical estimates of desolvation free energies(Wesson and Eisenberg 1992), based on the buried hydrophobic and buried hydrophilic interfacial surface areas.
Table 2.
DOT and ZDOCK AuxC20/ATPase domain docking energies and buried surface areas
| DOT 1 | DOT 2 | DOT 4 | ZDOCK 1 | ZDOCK 2 | ZDOCK 3 | |
| Interaction energies (kcal/mole): | ||||||
| A. Direct electrostatic | −92 | −149 | −81 | −53 | −36 | −149 |
| B. van der Waals | −44 | −53 | −28 | −60 | −32 | −50 |
| C. Desolvation enthalpy | +112 | +178 | +110 | +97 | +58 | +179 |
| D. Desolvation free energy | +93 | +152 | +87 | +147 | +74 | +127 |
| A + B + D | −43 | −50 | −22 | +34 | +6 | −72 |
| Buried interface surface (Å2): | ||||||
| Buried hydrophobic | 440 | 533 | 344 | 516 | 326 | 758 |
| Buried hydrophilic | 498 | 742 | 404 | 758 | 437 | 666 |
| Buried conserved Aux-C20 | 76 | 0 | 69 | 2 | 18 | 250 |
| Buried conserved ATPase | 302 | 380 | 294 | 448 | 352 | 565 |
In terms of direct electrostatic energies, the good structures and third-ranked ZDOCK structure appear much more favorable on average. However, the electrostatic interaction of the second-ranked DOT structure, with the J-domain bound in the ATP binding cleft of the ATPase domain, is just as favorable as the lower cleft bound structures, so the electrostatic interaction alone is insufficient to distinguish the experimental docking site from other possible sites. The weakest electrostatic interaction (−35 kcal/mole) was seen for the control structure with the J-domain rotated 180 degrees in the lower cleft, such that the J-domain positive patch was on the opposite side of the cleft as the ATPase domain negative patch. The van der Waals interaction energies are more favorable for the good set compared to the nonconverged set, due to greater shape complementary when the Aux-C20 J-domain is fully inserted into the lower cleft. However, three of the DOT and ZDOCK structures not bound in the lower cleft have larger van der Waals interaction energies than the good set structures.
To facilitate a comparison between the structures, an approximate indicator of the relative differences in interaction free energies is provided, given by the sum of the electrostatic, van der Waals and desolvation free energy terms. The desolvation free energy term estimates both electrostatic and van der Waals desolvation enthalpic contributions, as well as entropic contributions (Wesson and Eisenberg 1992). The sum of terms is lowest for the lower cleft binding sites. The desolvation term favors burial of hydrophobic surface and penalizes burial of hydrophilic surface. The ratios of buried hydrophobic surface are higher in the good set, which suggests that burial of hydrophobic surface plays a significant role in the binding of the J-domain to the lower cleft site.
Residues located at protein–protein interfaces are more likely to be conserved than noninterface surface residues (Hu et al. 2000). The amounts of conserved residue surface area buried at the Aux-C20/ATPase domain interface are given in Tables 1 and 2. More conserved surface area is buried for the good set structures than for the nonconverged set. For the non-lower cleft site DOT and ZDOCK structures, even less conserved surface residue area is buried.
A number of contacts between conserved J-domain and Hsc70 residues are observed for the lower cleft binding site structures (Fig. 4 ▶), although each contact described here should be considered tentative until confirmed by experiment. D876 (D35 in DnaJ) of the HPD loop of the J-domain formed a salt bridge with R171 of the Hsc70 ATPase domain in all the good set structures, third ZDOCK structure, and in four structures from the nonconverged set. D876 also always ended up within 8 Å of another ATPase arginine, R155, in all the good set structures and third ZDOCK structure. Both these arginines are very highly conserved in Hsp70 family proteins. The histidine (H874) of the HPD loop typically formed transient hydrogen bonds during the MD with the backbone carbonyls of Hsc70 A148 and Y149 and the side-chain carbonyl of Hsc70 N174. One of the most interesting potential contacts, seen in all the good set structures and the third ZDOCK structure, is the salt bridge between R867 (K26 in DnaJ) and D206 of the ATPase domain. This aspartate, D206, is quite important because it is highly conserved in the Hsp70 family, forming part of the ATP binding site and required for the ATP-binding induced interdomain conformational change (Kamathloeb et al. 1995; Johnson and McKay 1999). R867 is part of the positive patch; other potential salt bridges observed during the dynamics are indicated in Figure 4 ▶. Those between K847 and Hsc70 D213 or E218 are especially interesting because K847 is unique to the auxilin family, and a recent study has shown auxilin/Hsc70 binding is greatly reduced for a K847C mutant (Jiang et al. 2003). As for hydrophobic interactions, the most significant potential contact is between L871 (L30 in DnaJ) and V219 of Hsc70, which lies at the bottom of the lower cleft.
Figure 4.

Potential interprotein contacts in the model ATPase/J-domain complex. The auxilin J-domain backbone is shown as green-blue and the ATPase backbone, as gray. Auxilin residues are labeled in green (DnaJ numbers in parentheses); ATPase residues, in purple. Potential interprotein hydrogen bonds are indicated with dashed red lines.
Docking the Hsc70 substrate binding domain (SBD) to the ATPase/auxilin complex
Small-angle X-ray scattering and fluorescence experiments have shown that after binding ATP, Hsc70 undergoes a conformational change that is accompanied by a reduction in the radius of gyration (Johnson and McKay 1999). J-domains bind more strongly to intact Hsc70 than to just the ATPase alone (Gässler et al. 1998). In an NMR chemical shift perturbation study, perturbation of the J-domain by the ATPase domain alone appeared quite similar to perturbation caused by an Hsc70 construct containing both domains, with the possible exception of the HPD loop aspartate, although this could be due to technical reasons (Greene et al. 1998).
For the possible model structures of the SBD/ATPase/auxilin complex, the interdomain complex should be relatively compact, reflecting the observed reduction in the radius of gyration. Contact with the bound J-domain by the SBD should be minimal, except perhaps in the vicinity of the HPD loop, in agreement with the NMR data. Despite minimal contact, the interaction between the J-domain and the SBD should be favorable in accordance with the stronger binding to intact Hsc70 compared to the ATPase domain alone. The interaction interface likely contains contacts between conserved surface residues (Hu et al. 2000). The covalently linked domains impose a distance restraint between the ATPase C terminus and SBD N terminus (see Materials and Methods). Finally, one expects the peptide binding groove of Hsc70 to be reasonably close to the clathrin binding region of Aux-C20 because this is where the substrate transfer must physically occur.
The ATPase domain has an overabundance of conserved surface regions compared to auxilin and the SBD. Focusing instead on the SBD, in addition to the peptide binding groove, conserved residues are found in the linker and two loops spatially near the linker. The linker consists of residues 385–395, SENVQDLLLLD, and the two SBD loops (designated L2,3 and L6,7) consist of residues 417–421, NTTIP, and residues 481–485, DANGI. Because the linker contains many hydrophobic residues, the surface around the ATPase C terminus was searched for a conserved region with exposed hydrophobic surface. One such region is the remainder of the lower cleft, the part of the lower cleft not occupied by the J-domain. This region lies directly between the bound J-domain and ATPase domain C terminus, making it an obvious choice for potential interaction with the linker.
As with the docking of the J-domain, MD simulations docking the SBD to the ATPase domain/J-domain complex were first carried out with the SBD initially separated from the complex, and the resulting docked structures were then compared with DOT and ZDOCK results. Most of the linker is flexible in the NMR structure of the SBD, especially the N-terminal portion (Morshauser et al. 1999), and in the X-ray structure this portion is truncated (Zhu et al. 1996), so in the initial structures the linker was simply placed above the lower cleft (see Materials and Methods). For the remainder of the SBD, three orientations yielding relatively compact interdomain complexes are possible. One places the domain to the right of the lower cleft near D152 of the ATPase domain and the HPD loop of the J-domain, one places it to left of the lower cleft near E218 of the ATPase domain and the J-domain positive patch, and one directs the domain away from the J-domain towards the ATP binding cleft. The third choice is unlikely because it would place the SBD too far from the clathrin binding region of auxilin. Eleven initial structures forming a “fan” of conformations (Fig. 5 ▶) encompassing the other two orientations and gradations in between were generated with roughly 15 Å between the nonlinker portion of the SBD and the ATPase domain. In these initial structures the SBD was oriented such that two conserved SBD loops near the linker faced the ATPase domain. Like the J-domain docking simulation, the nonlinker SBD backbone was held semirigid during the 50-psec dynamics by a network of Cα distance restraints (see Materials and Methods).
Figure 5.

Initial (A) and final (B) structures of the substrate binding domain (SBD) docked with the ATPase/J-domain complex. (C) The DOT and ZDOCK docking sites for the SBD. The ATPase domain is shown in blue, and in A and B the J-domain is in magenta. In C, the NoJ docking site for the SBD occupies the J-domain binding site. In the final structures (B) the clump of structures to the upper right of the J-domain corresponds to the HPD-loop/D152 set, and the clump to the upper left corresponds to the positive-patch/E218 set.
During the dynamics, the separation between the ATPase and substrate binding domains closed slowly over the course of 15–25 psec. This is in contrast to the docking of the J-domain to the ATPase domain, where the separation typically closed in the first 2 psec of the simulation. The tendency of the two Hsc70 domains to remain separated longer might be due to electrostatic repulsion; the total charges were −5 for the SBD and −2.5 for the ATPase domain (the nucleotide is treated as partially protonated; see Materials and Methods). The linker conformations varied substantially due to the various initial placements of the linker. The final docked structures fell into two categories, those where the SBD ended up contacting the ATPase domain to the right of the lower cleft, and those to the left of the lower cleft (Fig. 5 ▶). The structures to the right of the lower cleft, the “HPD-loop/D152” set, formed more compact complexes than the set bound to the left, the “positive-patch/E218” set, with average radii of gyration of 37 Å and 39 Å, respectively (Table 3). The radius of gyration for Hsc70 with the SBD fully extended away from the ATPase domain is 45 Å, so both sets are consistent with the experimental observation of a more compact Hsc70 structure. Neither set of bound SBD structures seemed to converge to a particular conformation, as indicated by the root-mean-square deviations (RMSD) for the SBD backbone (Table 3).
Table 3.
Substrate binding domain (SBD) docking energies, buried surfaces areas, and convergence statistics
| HPD-loop/D152 set | Pos.-patch/E218 set | |||
| J-domain | ATPase | J-domain | ATPase | |
| Interaction energies (kcal/mole): | ||||
| A. Direct electrostatic | −20 ± 5 | −35 ± 18 | −28 ± 13 | −1 ± 16 |
| B. van der Waals | −13 ± 9 | −42 ± 14 | −6 ± 5 | −22 ± 7 |
| C. Desolvation enthalpy | +31 ± 10 | +79 ± 21 | +31 ± 17 | +20 ± 14 |
| D. Desolvation free energy | +32 ± 19 | +97 ± 25 | +16 ± 14 | +60 ± 25 |
| A + B + D | −1 ± 9 | +20 ± 27 | −19 ± 7 | +37 ± 32 |
| Buried interface surface (Å2): | ||||
| Buried hydrophobic | 181 ± 153 | 505 ± 229 | 117 ± 9 | 289 ± 139 |
| Buried hydrophilic | 189 ± 93 | 585 ± 205 | 93 ± 75 | 299 ± 103 |
| Buried conserved SBD | 49 ± 48 | 79 ± 35 | 16 ± 14 | 22 ± 21 |
| Buried conserved J/A | 8 ± 13 | 188 ± 124 | 0 | 32 ± 20 |
| Backbone RMSD (Å) | ||||
| All initial SBD combined | 23.9 | |||
| Initial SBD by set | 10.2 | 13.0 | ||
| Final SBD by set | 10.4 | 11.8 | ||
| Av. Hsc70 Rad. of Gyration (Å) | 37.1 ± 0.6 | 39.2 ± 1.3 | ||
The DOT and ZDOCK docking programs were first provided with the NMR structure of the free SBD (Morshauser et al. 1999) and a “good” set structure of the ATPase/J-domain complex, and then filtered and ranked by ClusPro. Neither program docked the SBD in either the HPD-loop/D152 site or the positive-patch/E218 site; the docking sites were all near the ATP binding cleft. As with the docking of Aux-C20, DOT and ZDOCK were run again, this time with the SBD in one of two conformations from the MD docking simulations, one with the SBD in its HPD-loop/D152 site conformation and one in its positive-patch/E218 site conformation. For the HPD-loop/D152 site conformation, both docking programs reproduced the docking at the HPD-loop/D152 site, top-ranked for DOT and third-ranked for ZDOCK. For the positive-patch/E218 site, neither program reproduced the docking at this site. Interestingly, the fifth-ranked ZDOCK site from the HPD-loop/D152 conformation run was moderately similar to the positive-patch/E218 set structures. Although located 25 Å on average from the positive-patch/E218 set structures, this docked structure still contacted ATPase residue E218 and the positive patch of the J-domain.
For comparison with the MD docking simulations, seven DOT and ZDOCK SBD docking sites were kept for further analysis (Fig. 5C ▶). These include the DOT and ZDOCK HPD-loop/D152 docking sites. Also included are the top-ranked sites docked near the ATP binding cleft, for the free SBD conformation (ATPcleft f), and from ZDOCK (ATP-cleft z) and DOT (ATPcleft d) using the positive-patch/E218 conformation. The ZDOCK result with the SBD docked moderately near the positive-patch/E218 set of structures was kept. The ZDOCK site (NoJ), with the SBD docked in the lower cleft, was generated with the J-domain not present. These structures were also subjected to the same restraints and 50 psec dynamics as the previous SBD docking simulations.
The SBD interaction energies for the HPD-loop/D152 and positive-patch/E218 sets are given in Table 3, and the interaction energies for the DOT and ZDOCK SBD sites in Table 4. One should first consider the SBD/ATPase interactions because J-domain proteins typically bind the ATP-bound form of Hsp70; the reduction in size of Hsp70 upon binding ATP is independent of J-domain binding (Johnson and McKay 1999; Suh et al. 1999). In contrast with the J-domain electrostatic interaction energies, those between the SBD and the ATPase domain are relatively weak, roughly the same strength as the van der Waals forces.
Table 4.
DOT and ZDOCK SBD docking energies and buried surfaces areas
| HPD/D152a | Pos/E218 | ATPcleft z | ATPcleft d | ATPcleft f | No Jc | ||||||
| Jb | Ab | J | A | J | A | J | A | J | A | A | |
| Interaction energies (kcal/mole) | |||||||||||
| A. Direct electrostatic | −12 | −32 | −73 | −44 | −19 | −88 | −20 | −61 | −28 | −57 | −53 |
| B. van der Waals | −22 | −33 | −18 | −40 | 0 | −72 | 0 | −45 | 0 | −51 | −52 |
| C. Desolvation enthalpy | +33 | +58 | +84 | +83 | +17 | +144 | +19 | +88 | +26 | +94 | +102 |
| D. Desolv. free energy | +47 | +82 | +39 | +110 | 0 | +194 | 0 | +112 | 0 | +129 | +135 |
| A + B + D | +13 | +17 | −52 | +26 | −2d | +34 | −1d | +6 | −2d | +21 | +30 |
| Buried interface surface (Å2) | |||||||||||
| Buried hydrophobic | 267 | 450 | 158 | 622 | 0 | 803 | 0 | 684 | 0 | 506 | 538 |
| Buried hydrophilic | 253 | 466 | 237 | 595 | 0 | 1028 | 0 | 579 | 0 | 750 | 810 |
| Buried conserved SBDe | 47 | 56 | 16 | 0 | 0 | 0 | 0 | 130 | 0 | 51 | 101 |
| Buried conserved J/Af | 3 | 202 | 0 | 29 | 0 | 84 | 0 | 51 | 0 | 60 | 448 |
a The values for the ZDOCK and DOT HPD/D152 sites were quite similar, and the averages are given.
b J: J-domain; A: ATPase domain.
c No J: No J-domain bound to the ATPase domain with SBD bound in the lower cleft J-domain binding site.
d For the three ATP binding cleft sites, the J-domain and SBD do not contact, so the desolvation enthalpy (representing solvent screening) was used instead.
e Conserved surface of the SBD buried by the J-domain (J) and ATPase domain (A).
f Conserved surface of the J-domain (J) and ATPase domain (A) buried by the SBD.
Looking at the sum of interaction energy terms, none of the SBD sites appear to have a favorable interaction with the ATPase domain because the sums are all positive. One possibility is that the charge states of the domains have not been treated correctly, because long-range electrostatic interactions can be quite significant. This important issue and its implications regarding the ATP hydrolysis-driven mechanism of the Hsp70/Hsp40 system are discussed in a following section. Of course, the sum of terms is intended as an aid in the comparison of interaction free energies; where this sum equals zero depends on the choice of dielectric constant and the method chosen for estimating the desolvation free energy. The other point to keep in mind is that, unlike the J-domain, the SBD is covalently linked to the ATPase domain. Even with the SBD fully extended away from the ATPase domain, the direct interaction between the two domains is still unfavorable, due to a long-range electrostatic repulsion on the order of 10 kcal/mole. Thus, it is not implausible that, under the right conditions, a compact form of Hsc70 is favorable.
Looking again at the interaction energy sums, the DOT docking site at the ATPase active site (ATPcleft d) appears the least unfavorable, followed by the HPD/D152 sites and the ATPcleft f site. The ATPcleft d site also has the largest buried hydrophobic to hydrophilic surface ratio. The most unfavorable sites in terms of SBD/ATPase interaction energy sums appear to be the Pos/E218 sites, the lower cleft (NoJ) site, and the ATPcleft z site. The overall spread in the sums, from +6 kcal/mole to +37 kcal/mole, is much less than the spread seen for the J-domain binding sites. Given that the sums are only an approximate indicator of binding free energies, it is not clear whether these smaller differences are significant. In fact, it could be that there is no strongly preferred SBD site on the ATPase domain surface, although the modeling results presented here are too approximate to draw any firm conclusion.
Tables 3 and 4 also show the interaction energies between the SBD and the J-domain. A favorable interaction is consistent with the experimentally observed stronger binding to intact Hsc70 compared to the ATPase domain alone (Gässler et al. 1998). Although the HPD-loop/D152 set structures have the least favorable SBD/J-domain interactions, the three with the least contact with the J-domain have more favorable interactions, with an average energy term sum of −8 kcal/mole. The positive-patch/E218 sites have the strongest SBD/J-domain interactions. These sites place the negatively charged SBD near the positive patch of the J-domain, but in so doing, also place the SBD in contact with the ATPase negative patch. The positive-patch/E218 sites, especially the one docked by ZDOCK, also contact the loop between the first and second helices of the canonical J-domain (helices 4 and 5 of Aux-C20), and no NMR perturbations were observed in this region.
Although the positive-patch/E218 sites with their more favorable SBD/J-domain interaction energies would appear to be more consistent with the stronger measured binding of J-domain proteins to intact Hsc70, the NMR results seem to rule out these sites. Experiment and the model structure energetics do not appear to point toward a mutually consistent conclusion with regard to a specific ATPase/SBD site. However, there are two additional aspects of the potential SBD sites to consider: One is the amount of buried conserved residue surface area (Tables 3, 4), and the other, discussed in the next section, is the distance between the substrate binding region of Aux-C20 and the substrate binding groove of the SBD (Table 5).
Table 5.
SBD substrate binding cleft to auxilin and Hsc20 substrate binding regions distances (Å)
| HPD-loop/D152 set | Pos-patch/E218 set | HPD/D152 d and z av.a | Post/E218 za | ATPcleft za | ATPcleft da | ATPcleft fa | |
| Auxilinb | 29 ± 11 | 51 ± 13 | 25 ± 9 | 64 ± 10 | 81 ± 11 | 92 ± 11 | 68 ± 10 |
| Hsc20c | 42 | 82 | 48 | 66 | 62 | 98 | 76 |
a d: docked by DOT; z: docked by ZDOCK; f: SBD in free structure conformation, docked by ZDOCK.
b Distance taken between D781 Cα of the clathrin binding helix of auxilin and L540 Cα of the SBD (in the substrate binding groove).
c Distance taken between E100 Cα of Hsc20 and L540 Cα of the SBD (in the substrate binding groove).
To the extent that the SBD positioning relative to the ATPase and bound J-domain is important for substrate transfer, one expects evolutionary pressure to conserve surface residues at the corresponding protein–protein interfaces (Hu et al. 2000). Although the lower cleft (NoJ) site has the most buried conserved surface area, this is the J-domain binding site. After the NoJ site, the HPD-loop/D152 sites involve the most burial of conserved residue surface. The least conserved interfaces are observed for the positive-patch/E218 sites. Thus, surface residue conservation implies the HPD-loop/D152 sites are more likely than the positive-patch/E218 sites to correspond to the SBD location where substrate transfer occurs.
Despite the lack of convergence to a particular bound structure, some potentially interesting contacts were observed between conserved residues of the SBD and the ATPase domain and J-domain. Although these contacts should be considered tentative, many of these residues would make excellent candidates for additional mutational analysis. For the HPD-loop/D152 set the invariant residue D395 of the linker often ended up within 7 Å of the invariant ATPase residue R171, the same arginine that interacts with the HPD loop aspartate of the J-domain. In addition, the leucines and valine of the linker typically contacted the conserved hydrophobic lower cleft residues L380, I379, F217, and I181. P421 of the conserved SBD loop NTTIP often ended up between the ATPase residues K159 and I172; this SBD loop has been shown to change conformation when the SBD binds peptide substrate (Stevens et al. 2003). The solvent-exposed hydrophobic residue I485 of the conserved SBD loop DANGI was frequently situated near Q156 of the ATPase domain and P875 (P34 in DnaJ) of the HPD-loop of the J-domain. Consistent contacts between conserved residues were not observed for the positive-patch/E218 sites.
Clathrin binding region of auxilin
One of the main goals of this study is to explore where the clathrin binding region of auxilin might be located with respect to the SBD of Hsc70. Using one HPD-loop/D152 SBD structure and one positive-patch/E218 SBD structure, each closest to the average structure for their respective sets, the 20 auxilin NMR structures were superimposed, and the distance was calculated between helix 1 of Aux-C20, the clathrin binding helix, and the substrate binding groove of the SBD. The same was done for each DOT and ZDOCK SBD structure. The results are shown in Table 5, and the two representative SBD complexes are shown in Figure 6A ▶. Assuming that the clathrin binding helix is physically close to the clathrin peptide that the SBD binds, the shorter average distance for the HPD-loop/D152 set structures, and corresponding DOT and ZDOCK structures, supports the argument that this set more closely represents the structure in which substrate transfer is likely to occur. In addition to the shorter distance, there is little or no intervening protein structure between the clathrin binding helix and substrate binding groove for the HPD-loop/D152 site structures; this is in contrast to all other potential SBD sites. The interaction of helix 2 of Aux-C20 with the SBD in the HPD-loop/D152 site is also quite interesting. In the NMR structure this helix is loosely packed against the surface of the J-domain (Gruschus et al. 2004). When superimposed on the J-domain in the complex, this helix makes extensive contact with the SBD (Fig. 6A ▶). This suggests that helix 2 of Aux-C20 might play a role in positioning the clathrin binding helix of auxilin with respect to the SBD.
Figure 6.

Alternate SBD sites in relation to Hsp40 substrate binding regions. (A) The SBD in relation to the clathrin binding region of auxilin. The two possible docked conformations of the SBD are shown in green, representing the HPD-loop/D152 set, and yellow, representing the positive-patch/E218 set. The SBD C-terminal segment bound in the substrate binding groove is shown in red. The auxilin clathrin binding region is shown in dark blue except for the clathrin binding helix, which is shown in pink. The J-domain of auxilin is purple, and the ATPase domain is blue. (B) The SBD in relation to Hsc20. The color scheme is the same as above, with the J-domain of Hsc20 shown in purple and the C-terminal domain, in dark blue, with the conserved acidic residues of the putative substrate interaction region shown in pink.
Other J-domains and their substrate binding regions
An important test of the model structures is their compatibility with other known J-domain structures. The J-domain protein Hsc20 provides a crucial test of the model, because its C-terminal domain, the putative substrate interacting domain, is rigidly determined with regard to the J-domain (Cupp-Vickery and Vickery 2000). The superimposed structure of Hsc20 fits quite well with the model, and is shown in Figure 6B ▶. Although the physiological partner of Hsc20 is Hsc66, the sequences of Hsc70 and Hsc66 are 33% identical (39% for just the ATPase domain), so their structures should be similar. A conserved acidic patch on the Hsc20 C-terminal domain has been suggested to play a role in substrate interaction (Cupp-Vickery and Vickery 2002). Although the location of the Hsc20 acidic patch is different than the clathrin binding helix of auxilin, this is not necessarily a contradiction because their respective substrates, IscU (Fe-S cluster assembly protein) and clathrin, are quite different. The superimposed Hsc20 structure provides an additional test of the plausibility of the different SBD docking sites in the context of substrate transfer. The distances between the acidic patch and SBD substrate binding groove for the different sites are given in Table 5. Like auxilin, the HPD-loop/D152 site structures have shorter distances and less intervening protein structure between the acidic patch and SBD substrate binding groove.
The J-domains of DnaJ and its human homolog superpose easily on the model structures, with their additional C-terminal helix oriented such that the expected location of the following G/F-rich region, an unstructured domain, is situated similarly to the clathrin binding helix of auxilin (Pellecchia et al. 1996; Qian et al. 1996; Huang et al. 1999; Gruschus et al. 2004), and thus nearer to the SBD docked at the HPD-loop/D152 sites. The interaction of the G/F-rich region with DnaK is indispensable for DnaJ-enhanced hydrolysis (Karzai and McMacken 1996). The structure of another J-domain/substrate system, the viral large T-antigen complex with retinoblastoma-associated protein (PDB code 1GH6; Kim et al. 2001), is not compatible with the model structures; both the substrate and the substrate interacting region of the large T antigen overlap extensively with the ATPase domain upon superposition of the J-domain.
Discussion
With the large quantity of experimental data identifying the ATPase domain/J-domain interface available, and given the energetics, buried conserved surface area, and convergence of the model ATPase/J-domain structures, the lower cleft bound J-domain model structure should be a reasonable approximation to the actual structure. Determining the SBD location in the complex presents a more difficult modeling challenge and reflects the more indirect experimental observations pertaining to its ATPase domain and J-domain interactions. Surface residue conservation and distance from the SBD to the substrate interacting regions of auxilin and Hsc20 support the HPD-loop/D152 site as the SBD location, at least for substrate transfer. In contrast, no clearly favored SBD site was evident from the modeling energetics. A likely possibility is that the position of the SBD during substrate transfer actually results from an adaptivity in its precise location responsive to the particular interactions with its various substrates presented by different J-domain proteins. Yet even having only an approximate structure of the SBD/ATPase/J-domain complex allows one to pose specific questions regarding Hsc70 and its J-domain interactions that heretofore were impossible to broach, and two of these questions are probed here.
Hsc70 interdomain conformation and the ATP cycle
The mechanism by which binding of ATP by the ATPase domain is translated into a conformational change at the SBD (step 1 in Fig. 7 ▶) is unknown (Johnson and McKay 1999). The X-ray structures of the Hsc70 ATPase domain in its ATP, ADP, and ADP + Pi bound forms are practically identical; even perturbations at the active site are relatively small. This is in marked contrast to the large changes seen upon hydrolysis for hexokinase and actin, whose ATPase domains are close structural relatives of the Hsc70 ATPase domain (Kabsch and Holmes 1995; Sablin et al. 2002). However, interdomain communication does not necessarily require major conformational changes of the ATPase domain, but instead, can occur due to charge distribution changes at the active site due to ATP binding and hydrolysis. An important clue toward the resolution of this mystery is the size reduction upon binding ATP (Johnson and McKay 1999); part of the driving force in this size reduction could be an ATP-induced change in the interdomain electrostatics.
Figure 7.

The ATP hydrolysis-driven cycle of substrate binding by Hsc70 in the Hsp70/Hsp40 chaperone system: 1. Exchanging bound ADP with ATP results in a decrease in the separation between the Hsc70 ATPase domain (A) and the SBD (S), causing the SBD to adopt its low-affinity, rapid on/off substrate binding state, perhaps by displacing the “lid” domain (L), providing access to the SBD peptide binding groove. In the DnaK/DnaJ system, a nucleotide exchange factor protein, GrpE, is required for this step. 2. The J-domain protein (J), already bound to substrate (sub), recruits Hsc70 to the substrate location, binding in the lower cleft. Interactions between the J-domain protein and the SBD and between the substrate and the SBD are probably also important for recruiting and binding Hsc70 at this step. 3. Substrate peptide binds in the SBD peptide binding groove, setting the stage for ATP hydrolysis. 4. ATP hydrolysis occurs, the Hsc70 interdomain separation increases, the SBD with its bound substrate is transformed into its high affinity, slow on/off state, and the J-domain protein dissociates. 5. The fifth step depends on the particular system. For the Hsc70/auxilin system Hsc70 remains bound to its clathrin triskelia substrate, causing it to dissociate from the clathrin-coated vesicle (Jiang et al. 2000). For the DnaK/DnaJ system, the substrate dissociates after some degree of folding into its native state, freeing DnaK to repeat the cycle (Mayer et al. 2000).
Using the model structures presented here, the electrostatic interaction energies between the SBD and the ATPase domain in its ATP, ADP, and ADP + Pi bound forms were calculated for both the HPD-loop/D152 and positive-patch/E218 sites (see Materials and Methods). The interaction energies for the ATP and ADP bound forms for both sets of sites were almost identical, differing by 0 ± 1 kcal/mole, while the energy for the ADP + Pi bound form was only very slightly lower, by −2 ± 1 kcal/mole. The closest atom–atom distance between the SBD and bound nucleotide is close to 20 Å for both the HPD-loop/D152 and positive-patch/E218 SBD sites, so these small numbers are not surprising. Screening effects could further reduce this interaction, and because there is almost certainly a desolvation penalty for any SBD/ATPase domain contact, it is unclear whether a direct electrostatic interaction of −2 kcal/mole could provide enough driving force to bring the domains together. Also, experiments have shown that the size reduction occurs upon binding ATP, not upon hydrolysis to the ADP + Pi form, so other hypotheses should be considered.
Another possible driving force could be that an additional positive counterion binds along with ATP, making the electrostatic interaction between domains more favorable (the ADP + Pi form has one Mg2+ and two K+, and the ADP form has one Mg2+ and one K+). In fact, in structures of the ATPase domain where K71 is mutated to prevent hydrolysis of the bound ATP (O’Brien et al. 1996), a third K+ ion is present. Including this third K+ yields a much stronger additional electrostatic attraction between the domains for the ATP-bound form, −13 ± 2 kcal/mole. However, size reduction is blocked in the K71 mutants (Johnson and McKay 1999), and their substrate binding rates are quite different from those of wild-type Hsc70 (Rajapandi et al. 1998). Furthermore, in two X-ray structures of mutant ATPase domains where a mixture of ATP and ADP + Pi bound forms are observed (T13G [Sousa and McKay 1998] and E175S [Johnson and McKay 1999]), there is no evidence for this additional K+ ion.
A more likely possibility is that the charge states of the bound nucleotides differ. The pKa values of ATP and ADP in solution are very similar: 6.95 and 6.88, respectively. This is because these numbers are so close to neutral pH that ATP and ADP were considered to be 50% protonated in this modeling study. However, the bound nucleotides could have significantly different pKa values due to the active site environment. If the pKa difference between bound ATP and bound ADP were significantly larger than in solution, the increased protonation of the bound ATP could have a pronounced effect on the electrostatic interaction between the ATPase domain and the SBD. To illustrate this effect, the ATP-bound ATPase/SBD electrostatic interaction energy was calculated for the model structures, first taking the bound ATP as singly protonated at the O1A oxygen (see Materials and Methods) and then with no protonation. On average, the direct electrostatic interaction was lowered by −12 ± 1 kcal/mole for the singly protonated case for both the HPD-loop/D152 and positive-patch/E218 site structures. More realistically, this additional attraction would be smaller, multiplied by the fractional increase in protonation of ATP relative to ADP. Measuring the pH dependence of the reduction in size of Hsc70 upon binding ATP might provide more information on the role of nucleotide pKa.
J-domain and substrate stimulation of ATP hydrolysis
J-domain proteins stimulate the ATP hydrolysis activity of Hsc70; some do so mildly, such as auxilin and Hsc20 (Jiang et al. 1997; Hoff et al. 2002), while with others, the stimulation is more dramatic, as with DnaJ and its homologs (Karzai and McMacken 1996). Given the model structure, it is trivial to hypothesize how J-domains could provide stimulation; the γ phosphoryl group of the bound ATP lies directly between the rest of the ATP and the J-domain, 12 Å from R867 of auxilin (which corresponds to K26 of DnaJ; see Figs. 4 ▶, 8 ▶). The positively charged J-domain should pull the negatively charged phosphoryl group towards it, facilitating hydrolysis. The forces between the J-domain and the γ phosphoryl group are the same within error for both the HPD-loop/D152 and positive-patch/E218 set structures, −3 ± 1 kcal/mole-Å.
Figure 8.

The Hsc70/auxilin complex showing bound ADP + Pi relative to the J-domain and SBD, and showing that the Hsc70 C-terminal “lid” domain and GrpE protein are compatible with the model structure. Auxilin is shown in violet, with the clathrin binding region shown in purple except for the clathrin binding helix, which is shown in pink. The ATPase domain is shown in blue, and the bound nucleotide (ADP + Pi) is shown in red. The SBD, which is shown in its HPD-loop/D152 docking site, is green with bound peptide in red. The lid domain is shown in closed form (yellow) and a hypothetical open form (orange), modeled by superposing lid X-ray structure backbone atoms of residues 518–526 (PDB code 1DKX; Zhu et al. 1996) with the corresponding NMR structure residues (PDB code 7HSC; Morshauser et al. 1999). The GrpE protein was placed by superposing the DnaK ATPase/GrpE complex (PDB code 1DKG; Harrison et al. 1997) on the Hsc70 ATPase domain.
Of course, this “trivial” explanation provides at best only a partial explanation of ATP hydrolysis in Hsc70/J-domain systems. In the model structures the J-domain comes within 12 Å of the ATP, and so one expects at least some structural perturbation of the active site environment. Indeed, the conformation of D206, which forms part of the active site, and which contacts the J-domain, varied considerably in the docked structures. Differences in J-domain protein residues contacting Hsc70 might account for some of the differences in stimulation seen for different J-domains, which might also be related to differences in their binding affinities; auxilin and Hsc20 bind to their Hsp70 partners more tightly than DnaJ and its homologs (Jiang et al. 1997, 2003). To complicate matters further, the presence of substrate dramatically enhances J-domain stimulation by auxilin and Hsc20 (Hoff et al. 2000; Gruschus et al. 2004). In fact, it has been proposed that the much greater ATPase stimulation by DnaJ could be due to a DnaJ peptide segment outside the J-domain binding to the SBD (Karzai and McMacken 1996). Even without J-domain present, binding of substrate can mildly stimulate ATPase activity (Gragerov et al. 1994; Greene et al. 1995; Jordan and McMacken 1995; Hoff et al. 2002). Although both sets of SBD binding sites lie no closer than 20 Å to the bound ATP, the negatively charged SBD still lies slightly closer to the γ phosphoryl group than the rest of the ATP. The average repulsive force due to direct electrostatic interactions between the SBD and the γ phosphoryl group is the same for both sets, +1 ± 0 kcal/mole-Å. An increase in distance upon binding substrate could therefore facilitate hydrolysis, as could the binding of positively charged peptide substrate (Liu et al. 2003).
In the peptide-bound form of the SBD, a helix of the lid region lies over the peptide binding groove, while in the nonpeptide-bound form it has been proposed that the helix might be displaced, leaving the groove more exposed (see Figs. 7 ▶, 8 ▶; Zhu et al. 1996; Morhauser et al. 1999). In X-ray and NMR structures of the SBD, the interdomain linker is undergoing conformational exchange. One of the linker conformations is extended, as in the model structures presented here. This conformation corresponds to the ATP-bound, reduced-sized form of Hsc70. The other linker conformation involves a small hydrophobic pocket formed in part by the beginning of the helix that forms the lid over the substrate binding groove (Zhu et al. 1996; Morshauser et al. 1999), and this conformation would then presumably correspond to the expanded, ADP-bound form of Hsc70. The L2,3 loop of the SBD, containing the conserved sequence NTTIP, has been shown to be allosterically affected by the binding of peptide (Stevens et al. 2003), and this loop is near the linker and contacts the ATPase domain in the HPD-loop/D152 site structure. Thus, linker conformation, L2,3 loop conformation, substrate binding, and ATP hydrolysis could all be coupled; that is, the lid helix closing over the groove upon binding peptide along with the L2,3 loop conformational change could favor a shift of the linker from its extended to its hydrophobic pocket conformation, moving the SBD away from the ATPase domain, facilitating hydrolysis.
Materials and methods
Constructing the Hsc70/auxilin model complex
Models of the complex of auxilin with mammalian Hsp70 cognate Hsc70 were constructed using the Discover module of the InsightII program (version 2000.1, Accelrys). For auxilin, the NMR structure of the 182-residue Aux-C20 construct was used (Han et al. 2000; Gruschus et al. 2004; PDB code 1N4C). Aux-C20 was interactively docked onto the ATPase domain of Hsc70, with helix five of Aux-C20 (the helix preceding the HPD loop) placed in the lower cleft of Hsc70 and with the aspartate of the invariant HPD loop of the auxilin J-domain placed near Arg171 of Hsc70 in accordance with the rescue mutant pair experiment (Suh et al. 1998), and the J-domain positive patch in contact with the ATPase domain negative region. The X-ray structure of ADP-bound wild-type mammalian Hsc70 ATPase (Osipiuk et al. 1999; PDB code 1HJO) was used at this stage. From this initial docked structure, Aux-C20 was then translated 8 to 12 Å away from Hsc70 and rotated up to 30° about a random axis. This procedure was repeated using 12 different structures of the Aux-C20 NMR ensemble. The first 47 residues of Aux-C20 were not included in the modeling because these residues are unstructured. Four additional initial starting structures were generated as controls. One control was generated with the J-domain rotated 180° in the lower cleft, so that the aspartate of the HPD loop (D876 in auxilin) was above the opposite end of the lower cleft far (25 Å) from Arg171 of Hsc70. Another control was generated with D876 placed close (8 Å) to R171, but with the helix of the J-domain (helix 5 in Aux-C20) running out the other end of the lower cleft, and another was generated with the J-domain rotated 90° with respect to the lower cleft. The fourth control was generated the same way as the 12 noncontrol initial structures, but the molecular dynamics were run without the electrostatic term to explore the role of van der Waals forces in the docking simulations. Each complex was subjected to 100 psec of nonsolvated molecular dynamics (AMBER force field, 4*r distance dependent dielectric, 400 K, 1-fsec time step, 24 Å cutoff), allowing the net electrostatic attraction between the J-domain and ATPase to redock the complex.
The backbone of Aux-C20 was kept semirigid during the molecular dynamics through the use of distance restraints between its α carbons. To generate the distance restraints, for each Cα the distance was calculated from the NMR structure to every 10th subsequent Cα in the sequence, and a harmonic distance restraint was then employed (100 kcal/mole-Å2) for a total of 845 restraints (Fig. 2 ▶). In addition, to ensure the J-domain core remained intact, a set of hydrophobic core carbon atoms were chosen, one per core residue; distances between all these atoms were calculated for each NMR structure, yielding 164 additional restraints (100 kcal/mole-Å2). For the ATPase domain, the backbone atoms of all residues within 12 Å of the initial interactively docked Aux-C20 structure were tethered (100 kcal/mole-Å2). All ATPase residues beyond 12 Å and all heteroatoms were held fixed. Following molecular dynamics each complex was minimized with the same restraints using 1000 steps of conjugate gradient minimization.
For the docking of the substrate binding domain of Hsc70 to the Aux-C20/ATPase complex, the NMR structure of the SBD of mammalian Hsc70 (Morshauser et al. 1999; PDB code 7HSC) was used because it included most of the linker region (residues 385 through 396) between the two Hsc70 domains. One Aux-C20/ATPase complex with an interfacial region that corresponded well with mutation and NMR experiments was chosen for this phase. For the ATPase structure the ADP plus inorganic phosphate bound (ADP + Pi) form of wild-type mammalian Hsc70 ATPase (Wilbanks and McKay 1995; PDB code 1HPM) was used. Eleven initial docked complexes were generated with the substrate binding domain translated and rotated so that the ATPase domain and nonlinker portion of the SBD were separated by roughly 15 Å. The termini were kept within 7Å, with a distance restraint imposed between the termini (N to C), upper bound of 10 Å and a lower bound of 7 Å (force constant 20 kcal/mole-Å2). For the nonlinker portion of the SBD, all residues past 396, Cα distance restraints were generated in the same manner as was done for Aux-C20 (1008 restraints). The backbone atoms of Aux-C20 and ATPase residues within 20 Å of the initial docked SBD were tethered (100 kcal/mole-Å2), and all residues beyond 20 Å were kept fixed. To speed the docking simulation, only the canonical J-domain portion of auxilin (residues 825 through 910) was used in the SBD docking dynamics, and the full-length Aux-C20 was then superimposed on the final complexes. Following dynamics, each complex was minimized with the same restraints using 1000 steps of conjugate gradient minimization.
DOT and ZDOCK docking and ClusPro filtering and ranking
The DOT (Vakser 1995; Mandell et al. 2001) and ZDOCK (Chen et al. 2003) programs were used to obtain rigid-body docking sites for the auxilin J-domain and SBD on the ATPase domain. Up to 20,000 rigid-body docking sites from each program were then filtered, clustered (9 Å clustering radius) and ranked by the automated Cluspro Web server (http://nrc.bu.edu/cluster) (Camacho et al. 2000; Comeau et al. 2004). DOT version 1.0 α and ZDOCK version 2.3 were used with a 10° Euler angle increment, 1 Å grid step and 4 Å surface layer. DOT was run using only shape complementarity, while ZDOCK included desolvation and electrostatic terms in its target function. Bound nucleotide, ions and active site water molecules were removed from the ATPase structures (PDB codes 1HPM and 1HJO) before submitting to DOT and ZDOCK because nonprotein groups are not supported. Only the canonical J-domain part of the Aux-C20 structure (residues 825–910) was used for docking. The full-length Aux-C20 structure was superimposed on the top-ranked ClusPro results, and those complexes with steric clashes with the full-length Aux-C20 structure were discarded. The DOT and ZDOCK programs used have not yet implemented distance restraints, and ~75% of the docked SBD sites were not plausible, with the linker N terminus too far from the ATPase C terminus, and were discarded.
Energy calculations
Connolly surface calculations were done using InsightII with a probe radius of 1.4 Å, with hydrophobic surfaces corresponding to all aliphatic and aromatic carbon atoms and their attached hydrogen atoms. Direct electrostatic energy and force terms were calculated with the InsightII Discover module (AMBER force field, ɛ = 2, 120 Å cutoff), and solvation enthalpies from reaction field energies calculated with the InsightII DELPHI module (Nicholls and Honig 1991) (ɛ internal = 2, ɛ external = 80, 1.4 Å probe radius, 329 × 329 × 329 grid with 0.5 Å spacing). Solvation free energies were obtained using an empirical, surface area-dependent method (Wesson and Eisenberg 1992) in the Solvation module of InsightII.
Crystallographic water molecules and counter ions in the nucleotide binding site of the ATPase domain were included in the energy and DELPHI calculations. The atom identified as water 405H in the 1HJO structure was replaced with a positive ion (K+) in accordance with subsequent X-ray studies (Johnson and McKay 1999). To generate the ATP bound ATPase structures for electrostatic energy comparisons, the K71M mutant 1KAX ATPase structure was superimposed with the 1HPM (ADP+Pi) structure, and the 1KAX ATP, counterions, and water molecules kept. The K+ counterion identified as 492H was replaced with a water molecule as suggested by (Johnson and McKay 1999). The ATP bound structures were subjected to 1000 steps of additional minimization, allowing active site residue side chains, water molecules and Aux-C20 and SBD side chains to relax, but keeping the nucleotide and counterions fixed. The default AMBER charges were used for ADP and ATP where Amber assumes 50% singly protonated ADP and ATP, with no explicit proton and the +0.5 charge spread equally among the phosphoryl atoms, yielding net charges of −2.5 and −3.5, respectively. The inorganic phosphate (Pi) was doubly protonated with no explicit protons with a net charge of −1. The radius of gyration of truncated Hsc70 (ATPase plus SBD) was calculated as the root-mean-square radius calculated for all atoms about the Hsc70 centroid.
The O1A site of ATP protonation was chosen based on examination of the X-ray structures of the ATP, ADP, and ADP + Pi bound forms of the ATPase domain. In the ADP-bound case, all the potential phosphoryl oxygen protonation sites either have at least two potential hydrogen bond donors, from the protein or from crystallographic water, or are bound to Mg2+. However, in the ATP-bound and ADP+Pi bound forms the O1A oxygen appears to have no obvious hydrogen-bonding partners. In the ADP-bound case, this oxygen becomes bound to Mg2+. Detailed electrostatic potential analysis, perhaps coupled to quantum mechanical calculations, could yield a more definitive argument regarding the O1A site (Okimoto et al. 2001). The Aux-C20/ATPase/SBD model structures with the bound ATP in its protonated and nonprotonated forms were further minimized 500 steps, allowing active site residue side chains, water molecules, and Aux-C20 and SBD side chains to relax.
Accession numbers
Coordinates have been deposited with the Protein Data Bank, accession code 1Q2G. The Aux-C20/ATPase/SBD complex with the SBD docked closest to the average for the HPD-loop/D152 set was deposited.
Acknowledgments
The publication costs of this article were defrayed in part by payment of page charges. This article must therefore be hereby marked “advertisement” in accordance with 18 USC section 1734 solely to indicate this fact.
Article and publication are at http://www.proteinscience.org/cgi/doi/10.1110/ps.03390504.
References
- Camacho, C.J., Gatchell, D.W., Kimura, S.R., and Vadja, S. 2000. Scoring docked conformations generated by rigid-body docking. Proteins 40 525–537. [DOI] [PubMed] [Google Scholar]
- Chen, R., Li, L., and Weng, Z. 2003. ZDOCK: An initial-stage protein docking algorithm. Proteins 52 80–87. [DOI] [PubMed] [Google Scholar]
- Comeau, S.R., Gatchell, D.W., Vajda, S., and Camacho, C.J. 2004. ClusPro: An automated docking and discrimination method for the prediction of protein complexes. Bioinformatics 20 45–50. [DOI] [PubMed] [Google Scholar]
- Cupp-Vickery, J.R. and Vickery, L.E. 2000. Crystal structure of Hsc20, a J-type co-chaperone from Escherichia coli. J. Mol. Biol. 304 835–845. [DOI] [PubMed] [Google Scholar]
- Fink, A.L. 1999. Chaperone-mediated protein folding. Physiol. Rev. 79 425–449. [DOI] [PubMed] [Google Scholar]
- Flaherty, K.M., DeLuca-Flaherty, C., and McKay, D.B. 1990. Three-dimensional structure of the ATPase fragment of a 70K heat-shock cognate protein. Nature 346 623–628. [DOI] [PubMed] [Google Scholar]
- Gässler, C.S., Buchberger, A., Laufen, T., Mayer, M.P., Schröder, H., Valencia, A., and Bukau, B. 1998. Mutations in the DnaK chaperone affecting interaction with the DnaJ cochaperone. Proc. Natl. Acad. Sci. 95 15229–15234. [DOI] [PMC free article] [PubMed] [Google Scholar]
- Genevaux, P., Schwager, F., Georgopoulos, C., and Kelley, W.L. 2002. Scanning mutagenesis identifies amino acid residues essential for the in vivo activity of the Escherichia coli DnaJ (Hsp40) J-domain. Genetics 162 1045–1053. [DOI] [PMC free article] [PubMed] [Google Scholar]
- Gragerov, A., Li, Z., Xun, Z., Burkholder, W., and Gottesman, M.E. 1994. Specificity of DnaK peptide binding. J. Mol. Biol. 235 848–854. [DOI] [PubMed] [Google Scholar]
- Greene, L.E., Zinner, R., Naficy, S., and Eisenberg, E. 1995. Effect of nucleotide on the binding properties of peptides to 70-kDa heat shock protein. J. Biol. Chem. 270 2963–2973. [DOI] [PubMed] [Google Scholar]
- Greene, M.K., Maskos, K., and Landry, S.J. 1998. Role of the J-domain in the cooperation of Hsp40 with Hsc70. Proc. Natl. Acad. Sci. 95 6108–6113. [DOI] [PMC free article] [PubMed] [Google Scholar]
- Gruschus, J.M., Han, C.J., Greener, T., Greene, L., Ferretti, J.A., and Eisenberg, E. 2004. The structure of the functional fragment of auxilin required for catalytic uncoating of clathrin-coated vesicles. Biochemistry 43 3111–3119. [DOI] [PubMed] [Google Scholar]
- Han, C.J., Gruschus, J.M., Greener, T., Greene, L., Ferretti, J.A., and Eisenberg, E. 2000. H-1, N-15, and C-13 NMR backbone assignments and secondary structure of the C-terminal recombinant fragment of auxilin including the J-domain. J. Biomol. NMR 17 281–282. [DOI] [PubMed] [Google Scholar]
- Harrison, C.J., Hayer-Hartl, M., Di Liberto, M., Hartl, F., and Kuriyan, J. 1997. Crystal structure of the nucleotide exchange factor GrpE bound to the ATPase domain of the molecular chaperone DnaK. Science 276 431–435. [DOI] [PubMed] [Google Scholar]
- Hoff, K.G., Silberg, J.J., and Vickery, L.E. 2000. Interaction the iron–sulfur cluster assembly protein IscU with the Hsc66/Hsc20 molecular chaperone system of Escherichia coli. Proc. Natl. Acad. Sci. 97 7790–7795. [DOI] [PMC free article] [PubMed] [Google Scholar]
- Hoff, K.G., Ta, D.T., Tapley, T.L., Silberg, J.J., and Vickery, L.E. 2002. Hsc66 substrate specificity is directed toward a discrete region of the iron–sulfur cluster template protein IscU. J. Biol. Chem. 277 27353–27359. [DOI] [PubMed] [Google Scholar]
- Hu, Z.J., Ma, B.Y., Wolfson, H., and Nussinov, R. 2000. Conservation of polar residues as hot spots at protein interfaces. Proteins 39 331–342. [PubMed] [Google Scholar]
- Huang, K., Flanagan, J.M., and Prestegard, J.H. 1999. The influence of C-terminal extension on the structure of the “J-domain” in E. coli DNAJ. Protein Sci. 8 203–214. [DOI] [PMC free article] [PubMed] [Google Scholar]
- Jiang, R.F., Greener, T., Barouch, W., Greene, L., and Eisenberg, E. 1997. Interaction of auxilin with the molecular chaperone, Hsc70. J. Biol. Chem. 272 6141–6145. [DOI] [PubMed] [Google Scholar]
- Jiang, R., Gao, B., Prasad, K., Greene, L.E., and Eisenberg, E. 2000. Hsc70 chaperones clathrin and primes it to interact with vesicle membranes. J. Biol. Chem. 275 8439–8447. [DOI] [PubMed] [Google Scholar]
- Jiang, J., Taylor, A.B., Prasad, K., Ishikawa-Brush, Y., Hart, P.J., Lafer, E.M., and Sousa, R. 2003. Structure–function analysis of the auxilin J-domain reveals an extended Hsc70 interaction interface. Biochemistry 42 5748–5753. [DOI] [PubMed] [Google Scholar]
- Johnson, E.R. and McKay, D.B. 1999. Mapping the role of active site residues for transducing an ATP-induced conformational change in the bovine 70-kDa heat shock cognate protein. Biochemistry 38 10823–10830. [DOI] [PubMed] [Google Scholar]
- Jordan, R. and McMacken, R. 1995. Modulation of the ATPase activity of the molecular chaperone DnaK by peptides and the DnaJ and GrpE heat-shock proteins. J. Biol. Chem. 270 4563–4569. [DOI] [PubMed] [Google Scholar]
- Kabsch, W. and Holmes, K.C. 1995. Protein motifs 2. The actin fold. FASEB J. 9167–174. [DOI] [PubMed] [Google Scholar]
- Kamathloeb, A.S., Lu, C.Z., Suh, W.C., Lonetto, M.A., and Gross, C.A. 1995. Analysis of 3 DnaK mutant proteins suggests that progression through the ATPase cycle requires conformational changes. J. Biol. Chem. 270 30051–30059. [DOI] [PubMed] [Google Scholar]
- Karzai, A.W. and McMacken, R. 1996. A bipartite signaling mechanism involved in DnaJ-mediated activation of the Escherichia coli DnaK protein. J. Biol. Chem. 271 11236–11246. [DOI] [PubMed] [Google Scholar]
- Kelley, W.L. 1998. The J-domain family and the recruitment of chaperone power. Trends Biochem. Sci. 23 222–227. [DOI] [PubMed] [Google Scholar]
- Kim, H.Y., Ahn, B.Y., and Cho, Y. 2001. Structural basis for the inactivation of retinoblastoma tumor suppressor by SV40 large T antigen. EMBO J. 20 295–304. [DOI] [PMC free article] [PubMed] [Google Scholar]
- King, C., Eisenberg, E., and Greene, L.E. 1999. Interaction between Hsc70 and DnaJ homologues: Relationship between Hsc70 polymerization and ATPase activity. Biochemistry 38 12452–12459. [DOI] [PubMed] [Google Scholar]
- Landry, S.J. 2003. Structure and energetics of an allele-specific genetic interaction between DnaJ and DnaK: Correlation of nuclear magnetic resonance chemical shift perturbations in the J-domain of Hsp40/DnaJ with binding affinity for the ATPase domain of Hsc70/DnaK. Biochemistry 42 4926–4936. [DOI] [PubMed] [Google Scholar]
- Liu, W., Bratko, D., Prausnitz, J.M., and Blanch, H.W. 2003. Electrostatic interactions between peptides and the molecular chaperone DnaK. J. Phys. Chem. B 107 11563–11569. [Google Scholar]
- Ma, Y., Greener, T., Pacold, M.E., Kaushal, S., Greene, L.E., and Eisenberg, E. 2002. Identification of domain required for catalytic activity of auxilin in supporting clathrin uncoating by Hsc70. J. Biol. Chem. 277 49267–49274. [DOI] [PubMed] [Google Scholar]
- Mandell, J.G., Roberts, V.A., Pique, M.E., Kotlovyi, V., Mitchell, J.C., Nelson, E., Tsigelny, I., and Ten Eyck, L.F. 2001. Protein docking using continuum electrostatics and geometric fit. Protein Eng. 14 105–113. [DOI] [PubMed] [Google Scholar]
- Mayer, M.P., Rudiger, S., and Bukau, B. 2000. Molecular basis for interactions of the DnaK chaperone with substrates. Biol. Chem. 381 877–885. [DOI] [PubMed] [Google Scholar]
- Morshauser, R.C., Hu, W., Wang, H., Pang, Y., Flynn, G.C., and Zuiderweg, E.R.P. 1999. High-resolution solution structure of the 18 kDa substrate-binding domain of the mammalian chaperone protein Hsc70. J. Mol. Biol. 289 1387–1403. [DOI] [PubMed] [Google Scholar]
- Nicholls, A. and Honig, B. 1991. A rapid finite difference algorithm, utilizing successive over-relaxation to solve the Poisson-Boltzmann equation. J. Comput. Chem. 12 435–445. [Google Scholar]
- O’Brien, M.C., Flaherty, K.M., and McKay, D.B. 1996. Lysine 71 of the chaperone Hsc70 is essential for ATP hydrolysis. J. Mol. Biol. 271 15874–15878. [DOI] [PubMed] [Google Scholar]
- Okimoto, N., Yamanaka, K., Ueno, J., Hata, M., Hoshino, T., and Tsuda, M. 2001. Theoretical studies of the ATP hydrolysis mechanism of myosin. Biophys. J. 81 2786–2794. [DOI] [PMC free article] [PubMed] [Google Scholar]
- Osipiuk, J., Walsh, M.A., Freeman, B.C., Morimoto, R.I., and Joachimiak, A. 1999. Structure of a new crystal form of human Hsc70 ATPase domain. Acta Crystallogr. D 55 1105–1107. [DOI] [PubMed] [Google Scholar]
- Pellecchia, M., Szyperski, T., Wall, D., Georgopoulos, C., and Wüthrich, K. 1996. NMR structure of the J-domain and the gly/pherich region of the Escherichia coli DnaJ chaperone. J. Mol. Biol. 260 236–250. [DOI] [PubMed] [Google Scholar]
- Qian, Y.Q., Patel, D., Hartl, F.U., and McColl, D.J. 1996. Nuclear magnetic resonance solution structure of the human Hsp40 (HDJ-1) J-domain. J. Mol. Biol. 260 224–235. [DOI] [PubMed] [Google Scholar]
- Rajapandi, T., Wu, C.B., Eisenberg, E., and Greene, L. 1998. Characterization of D10S and K71E mutants of human cytosolic Hsp70. Biochemistry 37 7244–7250. [DOI] [PubMed] [Google Scholar]
- Sablin, E.P., Dawson, J.F., VanLoock, M.S., Spudich, J.A., Egelman, E.H., and Fletterick, R.J. 2002. How does ATP hydrolysis control actin’s associations? Proc. Natl. Acad. Sci. 99 10945–10947. [DOI] [PMC free article] [PubMed] [Google Scholar]
- Scheele, U., Alves, J., Frank, R., Duwel, M., Kalthoff, C., and Ungewickell, E. 2003. Molecular and functional characterization of clathrin and AP-2 binding determinants within a disordered domain of auxilin. J. Biol. Chem. 278 25357–25368. [DOI] [PubMed] [Google Scholar]
- Stevens, S.Y., Cai, S., Pellecchia, M., and Zuiderweg, R.P.E. 2003. The solution structure of the bacterial HSP70 chaperone protein domain DnaK(393–507) in complex with the peptide NRLLLTG. Protein Sci. 12 2588–2596. [DOI] [PMC free article] [PubMed] [Google Scholar]
- Sousa, M.C. and McKay, D.B. 1998. The hydroxyl of threonine 13 of the bovine 70-kDa heat shock cognate protein is essential for transducing the ATP-induced conformational change. Biochemistry 37 15392–15399. [DOI] [PubMed] [Google Scholar]
- Suh, W.C., Burkholder, W.F., Lu, C.Z., Zhao, X., Gottesman, M.E., and Gross, C.A. 1998. Interaction of the Hsc70 molecular chaperone, DnaK, with its cochaperone DnaJ. Proc. Natl. Acad. Sci. 95 15223–15228. [DOI] [PMC free article] [PubMed] [Google Scholar]
- Suh, W.C., Lu, C.Z., and Gross, C.A. 1999. Structural features required for the interaction of the Hsp70 molecule chaperone DnaK with its cochaperone DnaJ. J. Biol. Chem. 274 30534–30539. [DOI] [PubMed] [Google Scholar]
- Ungewickell, E., Ungewickell, H., Holstein, S.E.H., Lindner, R., Prasad, K., Barouch, W., Martin, B., Greene, L.E., and Eisenberg, E. 1995. Role of auxilin in uncoating clathrin-coated vesicles. Nature 378 632–635. [DOI] [PubMed] [Google Scholar]
- Vakser, I.A. 1995. Protein docking for low-resolution structures. Protein Eng. 8 371–377. [DOI] [PubMed] [Google Scholar]
- Wesson, L. and Eisenberg, D. 1992. Atomic solvation parameters applied to molecular dynamics of proteins in solution. Protein Sci. 1 227–235. [DOI] [PMC free article] [PubMed] [Google Scholar]
- Wilbanks, S.M. and McKay, D.B. 1995. How potassium affects the activity of the molecular chaperone Hsc70. Potassium binds specifically in the ATPase active site. J. Biol. Chem. 270 2251–2257. [DOI] [PubMed] [Google Scholar]
- Young, J.C., Barral, J.M., and Hartl, F.U. 2003. More than folding: Localized functions of cytosolic chaperones. Trends Biochem. Sci. 28 541–547. [DOI] [PubMed] [Google Scholar]
- Zhu, X., Zhao, X., Burkholder, W.F., Gragerov, A., Ogata, C.A., Gottesmann, M.E., and Hendrickson, W.A. 1996. Structural analysis of substrate binding by the molecular chaperone DnaK. Science 272 1606–1614. [DOI] [PMC free article] [PubMed] [Google Scholar]