Abstract
Matrix-assisted laser desorption ionization–ion mobility–orthogonal time-of-flight mass spectrometry (MALDI-IM-oTOF MS) is a new technique that allows laser desorbed ions to be preseparated on the basis of their shape prior to mass analysis. Using this instrument, we tested the postulate that addition of a quaternary ammonium compound such as acetylcholine to the model phosphorylated peptide angiotensin II would enhance its detection by MALDI in two ways. First of all, the acetylcholine–peptide complex could ionize more efficiently than the bare phosphopeptide. Furthermore, the ion mobility could separate the complex ion on the basis of its charge/volume from isobaric interferences, which would otherwise limit detection sensitivity.
Keywords: ion mobility, angiotensin, phosphorylated peptides, acetylcholine
Ion mobility mass spectrometry (IM MS) is an emerging technique in the areas of separations coupled to mass spectrometry. It can be used in investigations of biomolecular conformations in the gas phase.1– 4 The technique has been applied to the analysis of peptide mixtures using matrix-assisted laser desorption ionization (MALDI)5, 6 and to the study of noncovalent interaction.7 Others have employed electrospray ionization (ESI) sources in combination with IM MS to facilitate high-throughput analysis of complex peptide mixtures.8, 9 Ion mobility (IM) separates ions based on their collision cross section (Ω) and, because Ω is dependent on the gas-phase conformation of the ion, structural information can be obtained.10 Recent results also suggest that MALDI-IM coupled to time-of-flight (TOF) mass spectrometry may have utility in high-throughput screening for structurally significant and post-translationally modified peptides.11, 12
This work will focus on our recent efforts to explore the utility of MALDI-IM-TOF MS to distinguish phosphorylated and nonphosphorylated peptides. Detection of phosphorylated peptides by various mass spectrometric techniques is often time consuming and challenging, largely due to the low level of available modified peptide present. It has been observed that if the phosphorylated residues (S, T, or Y) are surrounded by basic amino acids (R, K) (such as in the consensus sites of protein kinase C), detection of the phosphorylated peptides is easily observed by MALDI or ESI in both positive and negative ion mode.13, 14 However, if the residues to be phosphorylated are surrounded by negatively charged amino acids (E, D) (such as in the consensus sites of casein kinase I and II), or in the case of phosphorylated tyrosine residues, especially in a mixture, the phosphorylated peptides often are not detected. Formation of quaternary amine complexes has recently been shown to increase ion formation during MALDI analysis of hard-to-detect phosphorylated peptides at such consensus sites.15
We have taken the first step toward using MALDI-IM-TOF MS for separation of these complexes by choosing angiotensin II (phosphorylated and nonphosphorylated forms) as a model system. We show that the mobility drift time of an ionized quaternary ammonium salt–phosphorylated peptide complex slows enough that the complex ion can be distinguished by both its drift time and its mass. The results of this study are promising for future work in which the MALDI-IM-TOF MS technique will be used to separate and mass analyze ionized complexes formed between acetylcholine or other quaternary amines and otherwise hard-to-detect phosphorylated peptides. The hope is that the salt bridge formation will both enhance the ionization probability and change the ion shape. Such complexation may result in better detection of phosphorylated peptides using our new instrument.
MATERIALS AND METHODS
Materials
Angiotensin II (An) (DRVYIHPF; molecular weight [MW] = 1046.2) and phosphorylated angiotensin II (pAn) (DRVpYIHPF; MW = 1126.2) were purchased from Anaspec (San Jose, CA) and diluted to a concentration of 10 pmol/μL. Acetylcholine and 6-aza-2-thiothymine (ATT) were purchased from Sigma (St. Louis, MO). Acetylcholine (MW = 146.2) was diluted to a concentration of 1 nmol/μL. Endoproteinase Glu-C was purchased from Roche Diagnostics (Indianapolis, IN) and diluted to a concentration of 0.25 μg/μL. The ATT matrix was a saturated solution in 50% ethanol, prepared daily. A drop of 100 mM ammonium sulfate was added to the mixture of An and pAn before addition of the matrix to enhance in-source decay.16
Enzymatic Digest
To 1 μL of peptide pAn or An was added 1 μL of endoproteinase Glu-C and 3 μL of 25 mM ammonium bicarbonate, pH 8.0. The digest was incubated for 3 min, then 1 μL of the digest was added to 1 μL of acetylcholine, the mixture was vortexed, 0.3 μL of the mixture was deposited on the sample plate, and the reaction was stopped by adding 0.3 μL of matrix (ATT) solution.
MALDI-IM-TOF MS Instrument
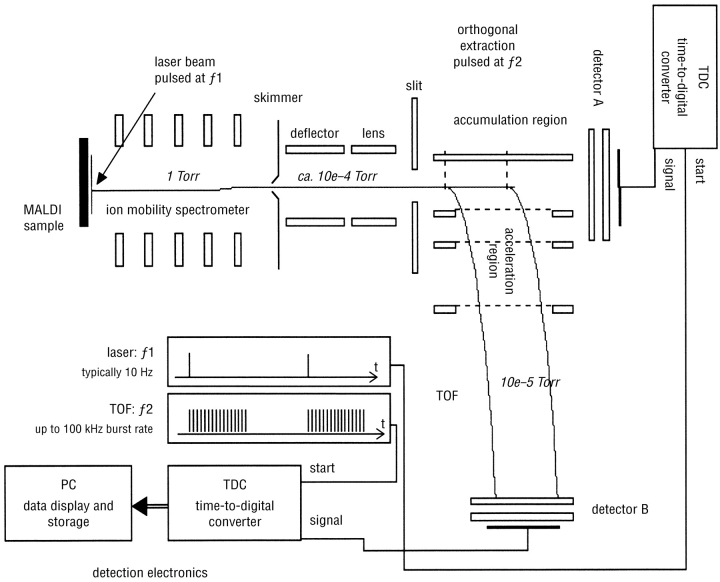
Spectra were acquired with a home-built periodic focusing MALDI-IM-TOF MS instrument (Fig. 1 ) that has been described elsewhere.17 Ions were formed at the operating pressure of the drift cell (4 torr He). After pulsed laser irradiation, the ablation plume is cooled within microseconds by interaction with the helium buffer gas, and the ions drift through the helium under the force of a periodic electric field. The nitrogen laser (LSI, Cambridge, MA) intensity is attenuated so that the mobility resolution (defined as the arrival time divided by peak width at half-height) is maximized. The ions’ arrival times ranged from hundreds of microseconds to 1.5 ms, with a routinely achieved mobility resolution of 60 or greater. The mass-to-charge ratios (m/z) of the peptides and complex ions are measured after the mobility separation by an orthogonal TOF (oTOF) mass spectrometer (m/z resolution of 400). Flight times of the ions within the mass spectrometer are less than 20 μs, so several hundred mass spectra are obtained during the 1.5-ms time of the largest ions. Two-dimensional plots of mobility as a function of m/z can then be reconstructed from the data. The mass spectrometer was externally calibrated with a mixture of C60 and C70. All mobility–m/z contour plots were made using Transform software (Research Systems, Boulder, CO).
FIGURE 1.
Schematic diagram of a MALDI–ion mobility–orthogonal TOF mass spectrometer.
Definition of a Trend Line
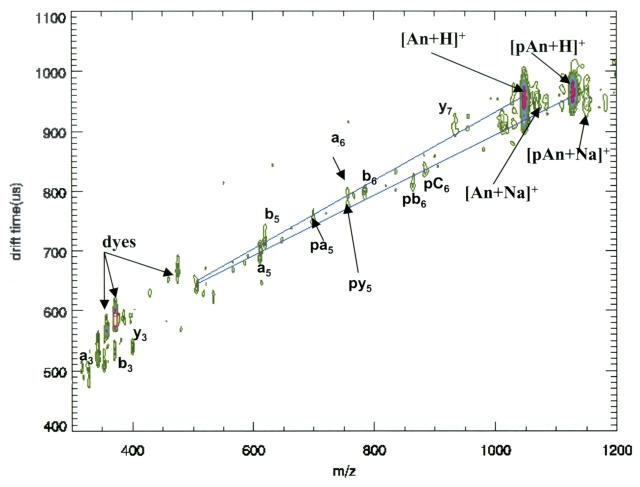
Molecules that have the same molecular weight but different conformations (such as phosphorylated and nonphosphorylated peptide fragments in Fig. 2 ) are seen along ion groupings that have different slopes in the two-dimensional contour plots of ion mobility versus mass. We add “trend lines” by visual inspection to help guide the eye through these common groupings.
FIGURE 2.
Ion mobility–orthogonal TOF separation of MALDI-desorbed angiotensin II (equal mixture of phosphorylated and nonphosphorylated forms). Note the separation by mobility above mass 537 of the phosphorylated and nonphosphorylated fragments.
High-Vacuum MALDI-TOF
High-vacuum MALDI-TOF mass spectra were the average of 50 shots acquired in positive ion mode (linear, delayed extraction, 20 kV extraction voltage) on a DE-Pro from Applied Biosystems (Framingham, MA) equipped with a nitrogen laser (337 nm).
RESULTS AND DISCUSSION
Mobility of Phosphorylated and Nonphosphorylated Angiotensin II Molecular Ions and Fragments
Figure 2 shows a two-dimensional contour plot of the ion mobility as a function of m/z from a mixture of pAn and An. The [M+H]+ ions for pAn and An are abundant along with their corresponding in-source fragments, which in the case of pAn remain phosphorylated (a, b, c and x, y, z). Trend lines have been added to the plot to emphasize the differences in mobility between phosphorylated and nonphosphorylated ions. The trend line for the phosphorylated parent ion and its fragments has a lower slope than the trend line for the nonphosphorylated ions. This indicates that the phosphorylated ions have a faster drift time through the mobility cell than nonphosphorylated ions of the same mass. The difference in mobility is especially obvious when comparing two fragments, one phosphorylated and one not, at nominal mass 756. As shown in Figure 2 , these appear as two spots, both at mass 756, that are separated by nearly 40 μs in mobility drift time. The two possibilities for these fragments are mass 756.3 (y5 from phosphorylated) and mass 756.4 (a6 from nonphosphorylated). We are tentatively designating the ion group of fastest mobility as the phosphorylated fragment, given that other phosphorylated peptide fragments tend to have a higher mobility than their nonphosphorylated fragments.
MALDI Analysis of Noncovalent Interactions Between Acetylcholine (Ach) and Phosphorylated Angiotensin II (pAn) or Angiotensin II (An)
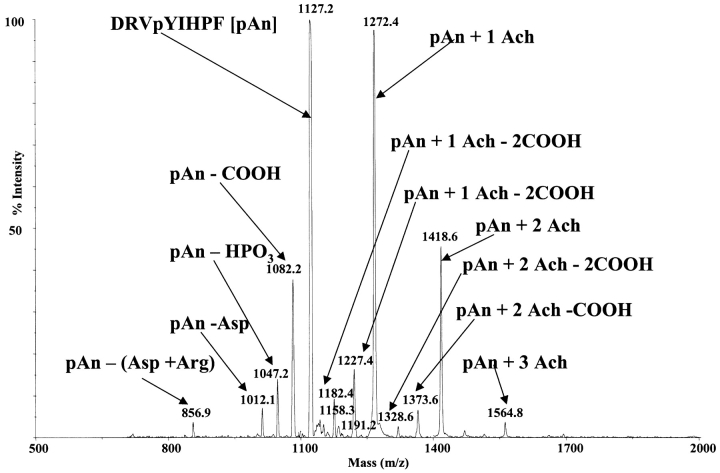
Figure 3 shows a high-vacuum MALDI spectrum of a mixture of acetylcholine and pAn. The parent ions at m/z 1127.2 (pAn + H), 1272.4 (pAn + 1 Ach), 1418.6 (pAn + 2 Ach), and 1564.8 (pAn + 3 Ach) are all identified. As many as three Ach molecules can be added to each molecule of pAn. Each of the pAn–Ach complex ions is stable, even with the loss of two consecutive carboxyl groups at m/z 1373.6 (=1418.6 − 45) and 1328.6 (=1418.6 − 2(45)). The acetylcholine complex is still intact even after the loss of two carboxyl groups. This indicates that at least a portion of the acetylcholines associate with a part of the molecule other than the terminal carboxyl group or the carboxyl group from the aspartic acid side chain; most likely the association site is the phosphorylated tyrosine (Fig. 3 ). Also, an enzymatic digestion was performed to cleave the amino-terminal aspartic acid. The acetylcholine remains complexed with these fragments in spite of the loss of the terminal aspartic acid. As seen in Figures 3 and 4 , the digest was incomplete. The digest was performed to confirm, in the case of the phosphorylated peptide, that an interaction between the phosphate group and the acetylcholine does take place.
FIGURE 3.
MALDI spectrum of a mixture of acetylcholine (Ach) and phosphorylated angiotensin II (pAn). Ions at m/z 1127.2 (pAn + H), 1272.4 (pAn + 1 Ach), 1418.6 (pAn + 2 Ach), and 1564.8 (pAn + 3 Ach) are identified.
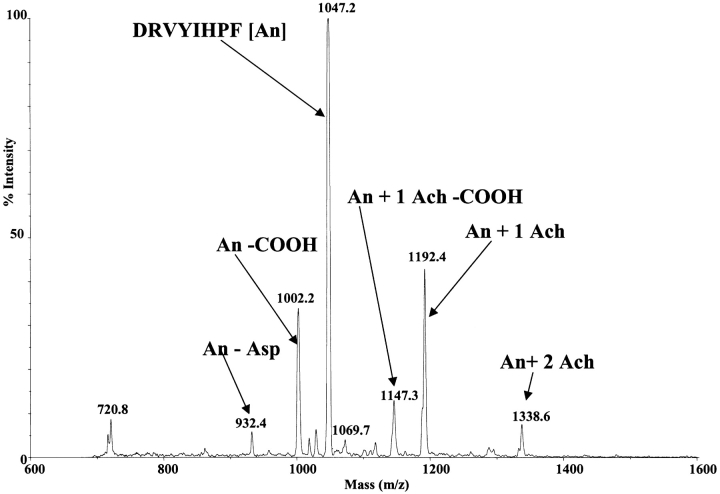
FIGURE 4.
MALDI spectrum of a mixture of acetylcholine (Ach) and angiotensin II (An). Ions at m/z 1047.2 (An + H), 1192.4 (An + 1 Ach), and 1338.6 (An + 2 Ach) are identified. The second addition of acetylcholine is barely seen.
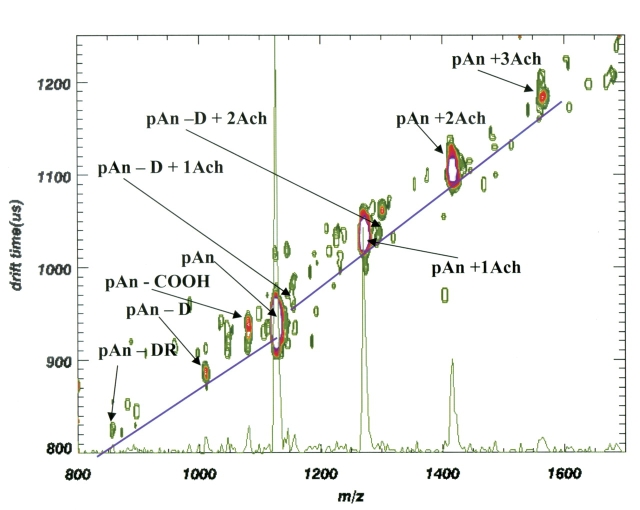
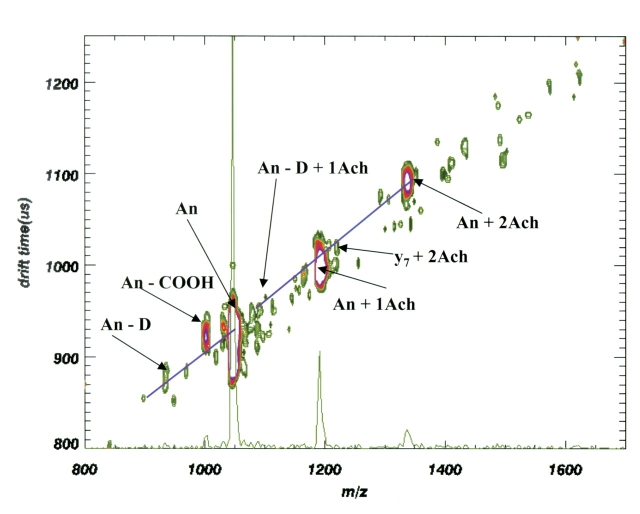
In contrast, the intensity of the acetylcholine complex ions relative to the parent ion is much weaker, as shown in Figure 4 . Furthermore, the maximum number of acetylcholine molecules in the complexed ion is limited to only two acetylcholines. In addition to the acetylcholine complex there is also evidence for one matrix adduct (+143.2), which can be seen as a shoulder on both of the acetylcholine adduct peaks. These matrix adducts are not present in the spectrum for phosphorylated angiotensin II. The matrix adduct ions are also usually not seen in either case during mobility analysis (see Figs. 5 , 6 ). In the few cases where we have seen some matrix addition during MALDI-IM-oTOF, the matrix adduct ions are slower than the acetylcholine adduct ions (+146.2) by over 50 μs. Thus, the matrix adduct ions, if present, are separated both by mass and mobility from the acetylcholine adduct ions.
FIGURE 5.
Mobility–mass contour of a mixture of acetylcholine (Ach) and phosphorylated angiotensin II (pAn). Also shown is the one-dimensional mass spectrum derived by adding all masses at all mobilities.
FIGURE 6.
Mobility–mass contour of a mixture of acetylcholine (Ach) and angiotensin II (An). Also shown is the one-dimensional mass spectrum derived by adding all masses at all mobilities.
The ratio of the intensities of the Ach complex ions compared with the parent angiotensin is much higher for pAn (m/z 1272.4) than for An (m/z 1192.4). This greater relative intensity for complex ion formation between acetylcholine and phosphorylated angiotensin compared with angiotensin is even more pronounced if the contribution of the matrix adduct intensity is subtracted from each of the acetylcholine adduct peaks in Figure 4 . The second addition of acetylcholine to angiotensin is minimal. The role of the phosphate in increasing the relative intensity of the complex ions may be due to either a stronger binding interaction or an increase in the ionization efficiency of the Ach–pAn complex ion as it is desorbed from the matrix.
Noncovalent Interactions Between Acetylcholine and Phosphorylated Angiotensin II and Angiotensin II, as Measured by MALDI-IM-TOF MS
The ion mobility data in Figures 5 and 6 show contour plots of ion mobility drift time as a function of m/z. We have added a one-dimensional collapsed plot of m/z to make it easier to compare the relative intensity of the various mobility-separated ions with traditional MALDI spectra. The MALDI-IM-TOF MS data of Figures 5 and 6 replicate the relative intensity variations of the high-vacuum MALDI data. The ratio of the intensities of phosphorylated complex/parent ion (pAn + 1 Ach)+/(pAn + H)+ is significantly larger than the intensity ratio from the nonphosphorylated angiotensin. The ratio of the intensities of the phosphorylated ions (pAn + 1 Ach)+/(pAn + H)+ is nearly 0.6, whereas (An + 1 Ach)+/(An + H)+ is less than 0.1 for the nonphosphorylated angiotensin, as shown in Figure 6 .
The very broad mobility peak at 900 μs in Figure 6 for the (An + H)+ ion at m/z 1047.2 shows several maxima. This is also observed for both An and pAn in Figure 2 . The presence of multiple mobility peaks for the same mass may indicate different conformations of the peptide. The idea of multiple conformations of the angiotensins is further reinforced by the presence of two and three maxima in the peaks for the sodium and potassium adducts of the angiotensins. In addition, we observe several maxima in the mobility peaks for the complex of a single acetylcholine-y7 fragment (loss of terminal aspartic acid) at m/z 1012 and the complex of y7 with two acetylcholines at m/z 1225.
Most of the ions in Figures 5 and 6 show COOH (m/z 45) losses, as shown earlier for high-vacuum MALDI. These ions (pAn + Ach − COOH, An + Ach − COOH) have mobility drift times nearly identical to those of the parent ions. Other fragment ions fall below the trend line. For example, the peak at m/z 1256 in Figure 5 can be assigned to loss of choline ((CH3)3N(CH2)2 = 87) from the An + 2 Ach ion at m/z 1337. We interpret this to mean that one acetylcholine and an acetate group remain associated with An in such a way that the acetate is “hidden” and does not change the collision cross section of the molecule appreciably. Unassigned peaks at m/z 1500 and in the m/z 1600 region are likely to be fragments from noncovalent complexes between the parent ion and three acetylcholines (very weak interactions).
The most important point of this article is the comparison of the ion mobilities shown in Figure 5 for phosphorylated angiotensin, its phosphorylated fragments, and the noncovalent complexes of acetylcholine with each. The (pAn + H)+ ion and its corresponding y7 (m/z 1013) and y6 (m/z 857) fragment ions are on a trend line that has a very different slope from that of the acetylcholine complexes. We see complexes containing up to three acetylcholines with pAn, as well as two with y7 at m/z 1157 and m/z 1303. Figure 5 shows one trend line drawn through the peptide–acetylcholine complex ions and another trend line drawn through the noncomplexed parent ion (pAn + H)+ and its fragments. The two trend lines are offset by about 50 μs. The formation of acetylcholine complexes with the phosphorylated molecules increases their mobility drift time by approximately 5% over what would be predicted by extrapolation of the trend line of the noncomplexed molecules. This can be seen most easily by comparing the drift times of (pAn + H)+ at 930 μs and (y7 + 1 Ach)+ at 970 μs.
The presumption is that the acetylcholine attachment through salt bridges to the phosphate ion changes the overall size of the molecular ion compared with the shape it would have if the acetylcholine attached linearly to a terminal carboxylic acid. This interpretation is supported by the data in Figure 6 in which the acetylcholine adduct peaks are on the same trend line as the nonphosphorylated angiotensin and its fragments.
CONCLUSIONS
Our data indicate that quaternary ammonium compounds can form noncovalent complexes with phosphorylated residues in a peptide. These complexes with phosphorylated angiotensin II as well as its phosphorylated fragments exhibit “slower” trend lines in plots of mobility drift time versus m/z when compared with the drift behavior of noncomplexed phosphorylated peptides and their fragments. In contrast, adducting alkali with the phosphorylated (as well as nonphosphorylated) forms produces a complex that is faster than the noncomplexed ions. Until this work, adduct formation in MALDI experiments has been a nuisance to be avoided because of the addition of redundant peaks to an already congested mass spectrum. However, the MALDI ion mobility separation yields trend lines differing by around 5% for the complexed and noncomplexed phosphorylated peptide ions. It is, therefore, possible to begin searching for adducts that will simultaneously increase the intensity of hard-to-detect residues while providing a shift in the mobility spectra. Thus, the complexity of one-dimensional MALDI spectra can be simplified by the preseparation offered by ion mobility prior to mass spectral analysis. The application of MALDI-IM-TOF MS to these problems allows researchers to consider adduction reactions that could increase the overall detection of analyte but that have hitherto been avoided because they increased spectral complexity in MALDI.
Adding acetylcholine to a peptide mixture is a simple procedure that does not require any complex derivatization but, nevertheless, potentially makes it easier to detect peptide residues that would otherwise be difficult to ionize. We will extend our work in the future to examine acetylcholine complexes with consensus sites that are not as amenable to MALDI analysis as that on angiotensin II. We will also use the separation power of MALDI-IM to test other types of adducts both for increasing ionization and for moving analyte away from ion congestion in the spectra.
Acknowledgments
Ionwerks is grateful for support from NIH Phase II SBIR (2R43 GM057736-01).
REFERENCES
- 1.Srebalus CA, Li J, Marshall WS, Clemmer DE. Gas-phase separations of electrosprayed peptide libraries. Anal Chem 1999;71:3918–3927. [DOI] [PubMed] [Google Scholar]
- 2.Wu C, Siems WF, Asbury RG, Hill HH. Secondary electrospray ionization ion mobility spectrometry/mass spectrometry of illicit drugs. Anal Chem 1998;70:4929–4938. [DOI] [PubMed] [Google Scholar]
- 3.Valentine SJ, Anderson JG, Ellington AD, Clemmer DE. Disulfide-intact and -reduced lysozyme in the gas phase: conformations and pathways of folding and unfolding. J Phys Chem B 1997;101:3891–3900. [Google Scholar]
- 4.Kinnear BS, Jarrold MF. Helix formation in unsolvated peptides: side chain entropy is not the determining factor. J Am Chem Soc 2001;123:7907–7908. [DOI] [PubMed] [Google Scholar]
- 5.Gillig KJ, Ruotolo BT, Stone EG, et al. Coupling high-pressure MALDI with ion mobility/orthogonal time-of-flight mass spectrometry. Anal Chem 2000;72:3965–3971. [DOI] [PubMed] [Google Scholar]
- 6.Ruotolo BT, Gillig KJ, Stone EG, et al. Analysis of protein mixtures by matrix assisted laser desorption/ionization ion mobility-orthogonal time of flight mass spectrometry. Int J Mass Spectrom. In press.
- 7.Woods AS, Koomen J, Ruotolo B, et al. A study of peptide–peptide interactions using MALDI ion mobility o-TOF and ESI-TOF mass spectrometry. JASMS 2002;13: 166–169. [DOI] [PubMed] [Google Scholar]
- 8.Valentine SJ, Counterman AE, Hoaglund CS, Reilly JP, Clemmer DE. Gas-phase separations of protease digests. J Am Soc Mass Spectrom 1998;9:1213–1216. [DOI] [PubMed] [Google Scholar]
- 9.Taraszka JA, Counterman AE, Clemmer DE. Gas-phase separations of complex tryptic peptide mixtures. Fresenius J Anal Chem 2001;369:234–245. [DOI] [PubMed] [Google Scholar]
- 10.McDaniel EW, Mason EA. The Mobility and Diffusion of Ions in Gases. New York: Wiley, 1973:68–72.
- 11.Ruotolo BT, Verbeck GF IV, Thomson LM, Gillig KJ, Russell DH. Observation of conserved solution-phase secondary structure in gas-phase tryptic peptides. J Am Chem Soc 2002;16:4214–4215. [DOI] [PubMed] [Google Scholar]
- 12.Ruotolo BT, Verbeck GF IV, Thomson LM, Gillig KJ, Woods AS, Russell DH. Distinguishing between phosphorylated and non-phosphorylated peptides with ion-mobility-mass spectrometry. J Proteome Res 2002;1:303306. [DOI] [PubMed] [Google Scholar]
- 13.Moyer SC, Cotter RJ, Woods AS. Fragmentation of phosphopeptides by atmospheric pressure MALDI and ESI/ ion trap mass spectrometry. JASMS 2002;13:274–283. [DOI] [PubMed] [Google Scholar]
- 14.Plafker SM, Woods AS, Gibson W. Phosphorylation of simian cytomegalovirus assembly protein precursor (pAPNG.5): multiple attachment sites identified, including two adjacent serines in a casein kinase II consensus sequence. J Virol 1999;73:9053–9062. [DOI] [PMC free article] [PubMed] [Google Scholar]
- 15.Woods AS. Chlorisondamine interaction with the neuronal nicotinic acetylcholine receptor. Presentation at 50th American Society for Mass Spectrometry (ASMS) Conference, June 2–5, 2002, Orlando, FL.
- 16.Marzilli L, Golden T, Cotter RJ, Woods AS. The complementary use of pronase and in source decay for peptide sequencing. JASMS 2000;11:1000–1008. [DOI] [PubMed] [Google Scholar]
- 17.Gillig KJ, Ruotolo BT, Verbeck GF IV, Stone EG, Russell DH. Periodic field focussing ion mobility spectrometer-mass spectrometer. Rev Sci Instrum. Submitted.


