Abstract
The key benefits of Lab-on-a-Chip technology are substantial time savings via an automation of lab processes, and a reduction in sample and reagent volumes required to perform analysis. In this article we present a new implementation of cell assays on disposable microfluidic chips. The applications are based on the controlled movement of cells by pressure-driven flow in microfluidic channels and two-color fluorescence detection of single cells. This new technology allows for simple flow cytometric studies of cells in a microfluidic chip-based system. In addition, we developed staining procedures that work “on-chip,” thus eliminating time-consuming washing steps. Cells and staining-reagents are loaded directly onto the microfluidic chip and analysis can start after a short incubation time. These procedures require only a fraction of the staining reagents generally needed for flow cytometry and only 30,000 cells per sample, demonstrating the advantages of microfluidic technology. The specific advantage of an on-chip staining reaction is the amount of time, cells, and reagents saved, which is of great importance when working with limited numbers of cells, e.g., primary cells or when needing to perform routine tests of cell cultures as a quality control step. Applications of this technology are antibody staining of proteins and determination of cell transfection efficiency by GFP expression. Results obtained with microfluidic chips, using standard cell lines and primary cells, show good correlation with data obtained using a conventional flow cytometer.
Keywords: Lab-on-a-Chip, microfluidic, flow cytometry, cell analysis, protein expression, on-chip staining
A variety of cell lines are commonly used to study the cellular function of proteins or to develop and test new drugs against targets of interest. Experiments with primary cell cultures come close to in vivo conditions and are becoming increasingly important in spite of limitations in availability and lifespan. For the analysis of single cells or subpopulations of cell cultures, fluorescence-based detection methods are commonly applied. A range of functional fluorescence dyes, as well as many fluorescently labeled antibodies, are available. Protein expression can be analyzed by such antibody staining procedures on a cellular level. The natural fluorescence of some proteins and fusion proteins can be exploited for the analysis of their cellular expression. Fluorescence microscopy and flow cytometry are commonly used for such types of analysis. While cellular localization of proteins provides additional information with microscopy, obtaining statistically relevant results by manual counting is tedious and time consuming. On the other hand, automated imaging systems and flow cytometric instrumentation are expensive and highly complex.
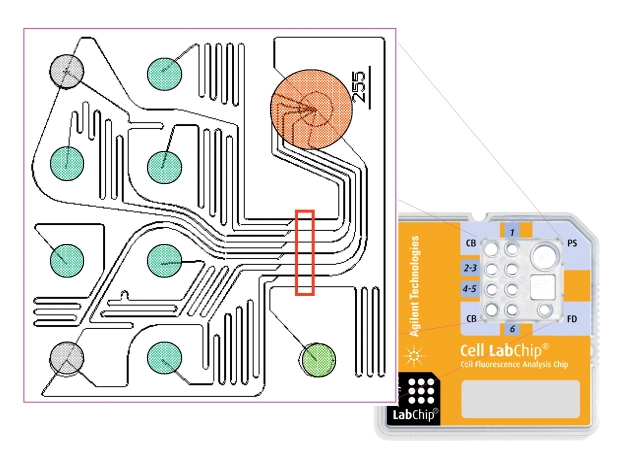
Recently, the implementation of simple flow cytometric assays on a microfluidic platform using disposable glass chips was demonstrated.1 The Lab-on-a-Chip system is well established for a variety of separation techniques—e.g., sizing and quantitation of DNA, RNA, and protein molecules—and can be modified to analyze fluorescent-labeled cells within minutes.2,3 For cell assays, the system applies pressure/vacuum to the microfluidic chip and six cell samples per chip are sequentially measured for individual cell fluorescence intensities in two wavelength channels (λex 470 nm/λem 525 nm, λex 635 nm/λem 680 nm). The complete analysis takes 25 min. Each microfluidic channel is connected to a cell buffer channel, which leads to hydrodynamic focusing and cells moving toward the detection point in single file (Fig. 1). About 750 cell events are measured per sample when 20,000 cells in 10 μL are initially loaded per sample. The chip design and the assay setup allow for on-chip staining for certain applications. This means that the cell suspension and all required staining reagents are loaded, mixed, and incubated directly in the chip sample wells. Time required for staining as well as cell and reagent consumption are reduced significantly. As the whole system is designed for ease of use, it is an excellent tool for the routine testing of cellular protein expression requiring flow cytometry.
FIGURE 1.
Chip layout and features. The microfluidic glass chip is fixed in a plastic caddy which accommodates six sample wells (green), two buffer wells (grey), one well for a reference dye (light green), and one well for a vacuum interface and collection of fluid waste (orange). A common buffer channel joins each sample channel in close proximity to the detection area (marked in red).
METHODS AND MATERIALS
Reagents and Cells
Calcein-AM and carboxynaphthofluorescein diacetate (CBNF) were purchased from Molecular Probes, Inc. (Leiden, Netherlands). All antibodies (anti-hu-CD80 CY-chrome, anti-hu-CD86-APC) were obtained from BD Pharmingen (San Diego, USA). The original calcein- AM stock was initially diluted with water-free DMSO to yield a 500-μM solution. Lipofectamine 2000 transfection reagent and Opti-MEM I were ordered from Invitrogen (Karlsruhe, Germany).
The 293 cells and clone CD86-V6, expressing CD86 (B7-2), respectively, were kindly provided by Dr. M. Sester (University of Homburg, Germany). Cells were cultured in RPMI medium containing 10% FBS, 10 mM HEPES, Pen/Strep, 1 mM sodium pyruvate, and 2 mM L-glutamine (Invitrogen).
Adherent Chinese hamster ovary (CHO-K1) cells were obtained from ATCC (Manassas, VA) and cultured in F12 medium containing 10% FBS, 10 mM HEPES, Pen/Strep, 1 mM sodium pyruvate, and 2 mM l-glutamine (Invitrogen, Karlsruhe, Germany).
Transfection
pEGFP-C2 (Clontech, Palo Alto, CA) plasmid DNA was purified using the Perfectprep XL kit (Eppendorf, Wesseling-Berzdorf, Germany). Twenty hours before transfection, CHO-K1 cells were seeded in a 6-well tissue culture plate at a density of 5 ∞ 105 in 2 mL of growth medium and incubated overnight. On the day of transfection, 1 μg of plasmid DNA was diluted into OPTI-MEM I (Invitrogen) and mixed with different volumes of Lipofectamine 2000 (Invitrogen) as described in Figure 4. Prior to transfection, the growth medium was replaced with 2 mL of OPTI-MEM. DNAL-ipofectamine complexes were added to the cells and incubated for 6 h. The transfection medium was then replaced by growth medium and cells incubated for an additional 18 h.
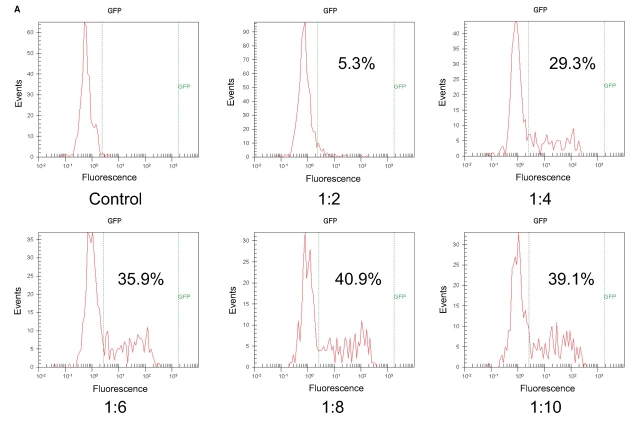
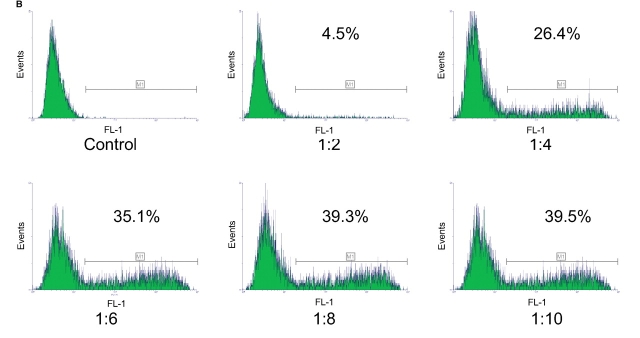
FIGURE 4.
Optimization of transfection conditions for GFP. CHO-K1 cells were transfected with GFP DNA at various DNA:lipofectamine ratios (1:2 to 1:10) or with lipofectamine in the absence of DNA (control). Cells were then stained on-chip with the live-cell stain CBNF and analyzed on the 2100 bioanalyzer (A). Blue fluorescence histograms of CBNF positive cells and percentages of transfection are shown. The same cells were stained with CBNF according to conventional procedures and analyzed on a flow cytometer (B) (10,000 events were measured per sample).
On-Chip Staining Protocol
For staining the cells on-chip, cells were trypsinized, harvested, and the cell concentration was adjusted to 3 × 10⁶ cells/mL in cell buffer (CB) provided in the Cell Fluorescence LabChip® kit (Agilent Technologies). Subsequently, the chip was primed by loading 10 μL priming solution (PS) into the PS well and left for 1 min. Then, 10 μL focusing dye (FD) was added to the FD well. After placing 30 μL CB in the buffer wells, 10 μL of the cell suspension was placed into each sample well. For antibody staining, 2 μL of a 1:50 dilution of calcein in CB (final calcein concentration = 1.4 μM) and 2 μL of the diluted antibody (prediluted 1:8 in CB) were added to each cell sample. For measurment of transfection efficiency, 4 μL of a 1:30 dilution of CBNF in CB (final CBNF-concentration in the sample well = 10 μM) was added to each sample well. Then, the chip was vortexed for 1 min on an IKA vortexer at ~1000 rpm and incubated in the dark for 25 min (antibody staining) or 15 min (transfection efficiency) at room temperature. After the incubation, the chip was vortexed again for 1 min and run on the 2100 bioanalyzer. For comparison, conventional staining procedure was performed as described elsewhere.5
RESULTS AND DISCUSSION
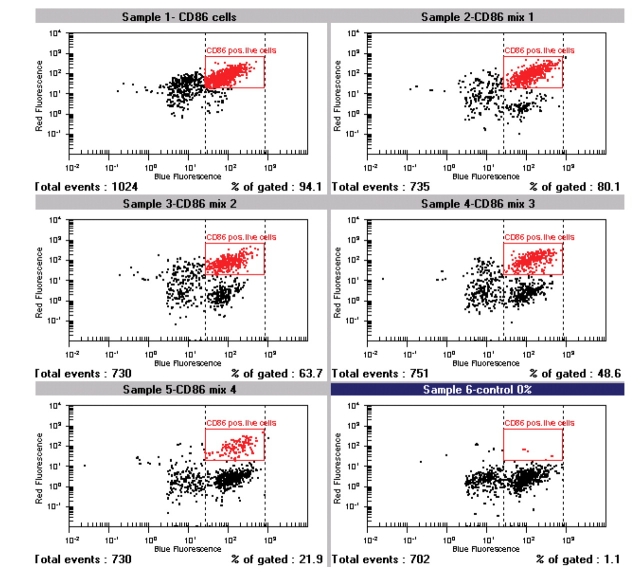
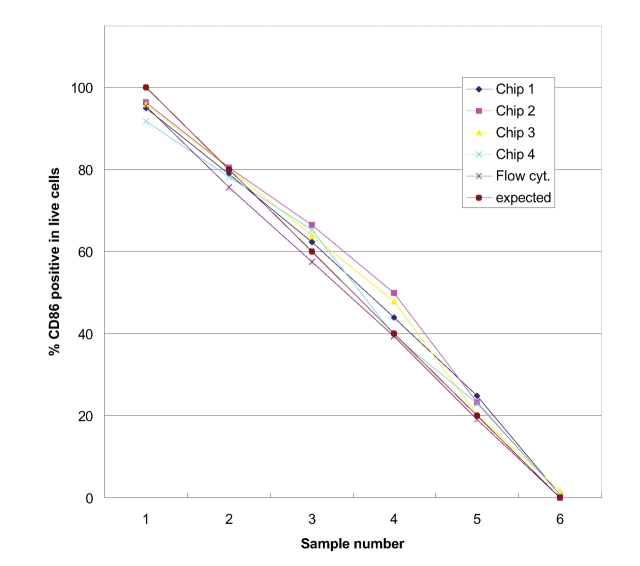
Lab-on-a-Chip technology achieves integration and simplification of many laboratory processes in an automated manner, on a miniaturized platform. The technology is already well established for separationbased analysis.2,3 The integration of flow cytometric analysis and cell staining in a microfluidic chip-based system is, however, a logical and new approach. Flow cytometric analysis requires that cells pass by the detector in single file. The special design of the chip device (Fig. 1) facilitates a hydrodynamic focusing of cells to one side of the microfluidic channel. Seven hundred fifty cells per sample are measured for fluorescence emission. During one chip run, six samples are sequentially analyzed in 25 min. Measurement of two fluorescence parameters enables a broad range of flow cytometric applications on the microfluidic platform. One example is the analysis of protein expression on a cellular level. In Figure 2 experimental data for antibody staining assay for CD86 is displayed. The CD86 protein is expressed on the cell surface and plays a role in the development and progression of immune response.4 For the assay on-chip, staining was applied—e.g., live cell dye (calcein-AM)—and APC-labeled antihuman CD86 antibody were incubated with 30,000 cells in each of the six sample wells of the chip. Optimal antibody concentration was determined in one on-chip staining experiment with six samples by titrating different antibody dilutions (data not shown). To test the performance of the antibody staining assay, mixtures of parental 293 cells and 293 cells stably transfected with CD86 were prepared at different ratios and analyzed. Data analysis is easy, as there is only one marker for live cells (having a bright live dye stain; see dotted lines in Fig. 2). This marker is adjusted and in a second step the region for positive antibody stain within this live cell population is set. The same cell mixtures were analyzed on 4 chips and compared with expected values. Figure 3 shows that the data from chip to chip was reproducible and compared well with the expected results. In addition, the cells were stained with the classic staining approach and measured with a conventional flow cytometer.5 The on-chip staining procedure significantly reduced cell and reagent consumption. A very small volume of diluted antibody solution is loaded directly onto the chip; approximately 80-fold less volume of valuable antibody is required compared with classical staining procedures. An efficient on-chip staining procedure that eliminates time-consuming washing steps was also developed for GFP detection. GFP is commonly used as reporter gene in several functional assays.6 Figure 4 summarizes results from a GFP transfection on-chip staining experiment. Here, time for straining of six samples in parallel was reduced from 35 min to 15 min. The on-chip staining results, e.g., which percentage of live cells were positively transfected and express GFP protein in cells (Fig. 4A), are very similar to results obtained with the flow cytometer reference instrument (Fig. 4B). The outcome of the optimization study with both instruments was that 8 μL of lipofectamine and 1 μg of plasmid DNA were identified as optimal conditions for this cell type and reagent.
FIGURE 2.
On-chip antibody staining results are displayed as dot plots for all six samples. Each dot represents one cell displayed at two fluorescent values on logarithmic scale. Red region marks double positive cell population. The 293 cells and a CD86 expressing cell clone were harvested and washed and cell density was adjusted to 3 million cells per milliliter in an isobuoyant cell buffer. Positive and negative control (sample 1 and 6) and four mixtures of parental and transfected cells were prepared at different ratios. Ten microliters of cell suspension were incubated with calcein-AM and anti hCD86-APC antibody (prediluted in 1:8 in CB) directly in the chip wells.
FIGURE 3.
Comparison between on-chip CD86 antibody staining results from four different experiments. The data were obtained with classically stained samples measured on a conventional flow cytometer. Data are in good agreement with those obtained by the reference technique and the theoretical prediction.
CONCLUSION
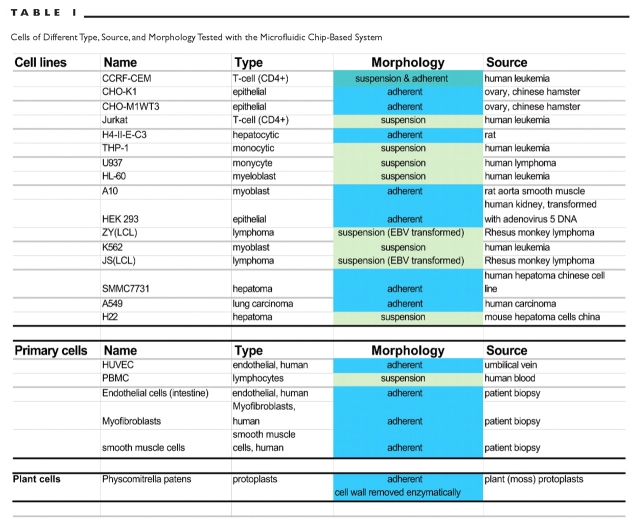
Lab-on-a-Chip technology was used to develop staining and analysis procedures, making the routine testing of cell cultures more efficient with an automated easy-to-use system. With the capability for simple flow cytometric studies, a broad range of additional applications can be performed using this instrument. This microfluidic chip-based system was designed to handle most eukaryotic cells and it was tested along with several applications for compatibility with many different cell types, including primary cells and plant cells (Table 1). The data demonstrate that cellular protein expression can be analyzed with miniaturized flow cytometric assays. The results are in good agreement with conventional flow cytometry. The system requires few cells (30,000) and, with the new on-chip staining procedures, cell and reagent consumption as well as staining time are significantly reduced. The combination of analysis capabilities for sizing and quantitation of molecules, such as DNA, RNA, and proteins, with the capability for measurement of fluorescence parameters of single cells makes the Lab-on-a-Chip system an ideal analysis tool for molecular and cell biology laboratories.
TABLE 1.
REFERENCES
- 1.Preckel T, Luedke G, Chan SDH, Wang B, Dubrow R, Buhlmann C. Detection of cellular parameters using a microfluidic chip-based sytem. J Assoc Lab Autom 2002; 7:85–89 [Google Scholar]
- 2.Ohashi R, Otero JM, Chwistek A, Hamel JFP. Determination of monoclonal antibody production in cell culture using novel microfluidic and traditional assays. Electrophoresis 2002;23:3623–3629 [DOI] [PubMed] [Google Scholar]
- 3.Fuller RA, Clark J, Kretzner L, et al. Use of microfluidics chips for the detection of human telomerase RNA. Anal Biochem 2003;313:331–334 [DOI] [PubMed] [Google Scholar]
- 4.Girndt M, Sester M, Sester U, Kaul H, Kohler H. Defective expression of B7-2 (CD86) on monocytes of dialysis patients correlates to the uremia-associated immune defect. Kidney Int 2001:59:1382–1389 [DOI] [PubMed] [Google Scholar]
- 5.Luedke G, Preckel T. Detection of antibody stained cell surface and intracellular protein targets with the Agilent 2100 bioanalyzer. Agilent App Note 2001; 5988–4322EN
- 6.Deo SK, Daunert S. Luminescent proteins from Aequorea victoria: Applications in drug discovery and in high throughput analysis. Fresenius J Anal Chem 2001; 369:258–266. [DOI] [PubMed] [Google Scholar]


