Abstract
Background: The identification of interacting proteins within protein complexes is key to understanding the transduction and regulation of cell signaling pathways, and is also a useful tool for identifying novel disease markers. Immunoprecipitation of protein complexes followed by liquid chromatography–tandem mass spectrometry (LC-MS/MS) has been used to identify targets that bind to a protein of interest. Here, we report a high-throughput nanoflow LC-MS/MS method for analysis of protein/peptide complexes.
Approach: To overcome the large dwell volume from connecting lines and the injector when using an autosampler in microcapillary LC-MS/MS, we employed a valve-controlled variable flow method with a peptide trap. This method enables fast trapping of peptides from samples injected by an autosampler within minutes followed by a split-controlled nanoflow of acetonitrile gradient through a microcapillary C18 column to separate and elute peptides into the ion-trap MS/MS. Over 40 protein/peptide samples at femtomole levels could be analyzed continuously using the same in-house packed microcapillary C18 column. The p38 mitogen-activated protein kinase (p38 MAP kinase) is a signaling protein that is involved in transduction of extracellular signals including oxidative stress, growth factors, and cytokines, with diverse cellular consequences such as cell proliferation, differentiation, or apoptosis. Immunocomplex of monoclonal anti-p38β antibodies from 2 mg total lysates from the OCI LY-1 lymphoma cell line was resolved in 1D-PAGE gel followed by silver staining of the gel. Protein bands were excised and digested with trypsin. Peptides were extracted and analyzed using the automated LC-MS/MS method.
Results and Conclusions: From 37 excised protein bands in the 1D-PAGE gel, we identified more than 50 proteins, including cytoskeletal proteins, ribosomal proteins, transcription factors, and KIAA potential signaling proteins. These proteins are the potential targets that may interact directly or indirectly with the p38 MAP kinase proteins. Our studies demonstrate the utility of automated nanoflow LC-MS/MS for sensitive and high-throughput analysis of protein/peptide complexes. Utilization of methods based on this principle would greatly facilitate peptide interaction mapping and other proteomic studies requiring high-throughput pre-analytical sample preparation.
Keywords: High-throughput, protein/peptide analysis, immunoprecipitation, LC-MS/MS
Protein–protein interactions are critical events involved in many cellular processes.1–7 Many signaling proteins also need to bind their downstream effectors to convey signals.8 One proven technique for the enrichment and separation of interacting proteins is immunoprecipitation. Immunoprecipitation followed by nanoflow liquid chromatography–tandem mass spectrometry (LC-MS/MS) leads to identification of proteins that directly or indirectly bind each other.9
Analysis of the immunoprecipitation protein complex can be very tedious when using conventional nanoflow LC-MS/MS methods in which samples are loaded manually. Automated nanoflow LC-MS/MS for the analysis of multiple samples requires the use of an autosampler. However, the large dwell volume of injector and connecting tubing in the autosampler renders the long duration required for sample loading too prohibitive to be practical. Here we report an automated method for high-throughput analysis of multiple protein samples derived from the anti-p38 immunoprecipitates using the LCQ DECA XP ion trap mass spectrometer and an HPLC pump equipped with an autosampler.
MATERIALS AND METHODS
Protein Lysates
Cells of a lymphoma cell line LY-1 were cultured in RPMI 1640 medium supplemented with 10% fetal bovine serum. After centrifugation and washing with phosphate buffer saline wash, the cell pellets were resuspended in a hypertonic buffer (20 mM Tris-HCL pH 7.4, 150 mM NaCl, 10 mM EDTA, 1 mM sodium orthovanadate, 1% NP-40, and 0.1% Sigma protease inhibitor cocktail) and then lysed using a tissue homogenizer (Ultra-Turrax T8, IKA Labortechnik, Germany). The lysates were microcentrifuged at 14,000 rpm for 10 min at 4°C and the supernatant collected as the protein source.
Immunoprecipitation, 1D SDS-PAGE, and Silver Staining
In each 2-mL tube, 2-mg proteins in 1 mL of lysates were mixed with 2 mg of monoclonal antibodies against p38b mitogen-activated protein (MAP) kinase (Santa Cruz Inc., Santa Cruz, CA) and incubated overnight at 48C with gentle shaking. Immune complexes were collected on protein G-agarose beads (GibCo BRL, Rockville, MD) and washed five times to remove nonspecific binding using the same buffer as for cell lysis.
Proteins were eluted off the protein G-agarose beads using a low pH buffer (50 mM glycine, 1% NP-40 pH 2.5) and reduced by 5 mM TCEP (PIERCE, New York, NY) for 30 min. One-dimensional SDS-PAGE was performed in a 20 × 20-cm 10% gel running at 140 V for 2 h. Separated protein bands in the SDS-PAGE gel were visualized with an MS-compatible silver stain kit (Silver Quest, Invitrogen, Carlsbad, CA).
In-Gel Digestion and Extraction of Peptides
Each excised protein gel band is transferred to a 2-mL tube and destained using the Silver Quest kit (Invitrogen) following the manufacturer’s protocol. In-gel digestion was then performed by adding 50–100 μL of 50 mM ammonium bicarbonate containing 10 ng/μL modified trypsin (Promega, Madison, WI) and incubated at 37°C overnight. Tryptic peptides were extracted twice in 100 μL extraction buffer (0.1% TFA, 50% acetonitrile pH 2.5). Two extracted peptide solutions were combined and dried in a speed-vac device until proper volumes were reached (25–50 μL). These peptide samples were ready for automated LC-MS/MS analysis. If precipitates or suspended particles were present in the samples, centrifugation was required to remove nonsoluble materials before samples were loaded.
Automated Microcapillary LC-MS/MS
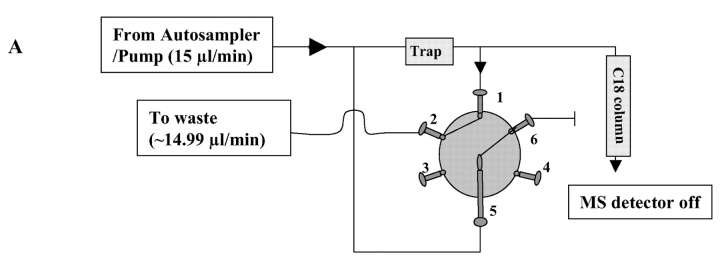
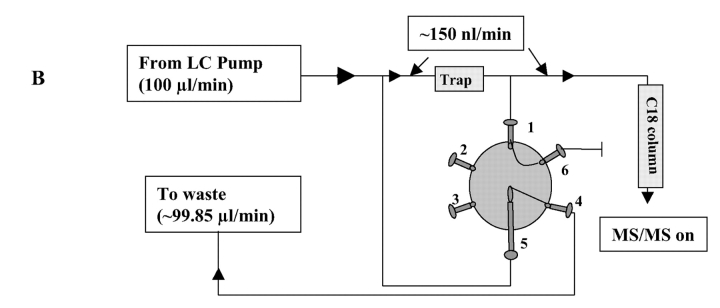
The Surveyor HPLC system (with an autosampler and LC pump, ThermoFinnigan, San Jose, CA) was used for automatic sample loading and flow control. The variable flow was controlled by the divert valve of the LCQ DECA XP ion trap mass spectrometer (ThermoFinnigan) (Fig. 1). In detail, each tryptic peptide sample (20 μL) was pipetted into a 50 μL LV insert (Alltech, Nicholasville, KY), which was then placed in a 1.8-mL screw-cap autosampler vial. Our in-house packed C18 microcapillary column (75 μm × 12 cm packed with 5 μm, 300 Å Magic C18; Michrom BioResources, Auburn, CA) was tested for processing up to 40 samples. The no-waste injection method was used to inject 15 μL of each peptide solution into the 20 μL loop and subsequently carried into the peptide trap (Cap Trap, Michrom BioResources) by solvent A (5% acetonitrile, 0.4% acetic acid, and 0.005% HFBA) at 15 μL/min. During peptide trapping, the divert valve was set to waste mode for 10 min to allow all sample and solvent to flow through the peptide trap (Fig. 1A). The divert valve was then switched to source mode (detector mode) to allow nanoflow (~150 nL/min) of solvent gradient (5–40% of solvent B for 30 min, 40–100% of solvent B for 10 min and solvent A for 20 min; solvent B: 95% acetonitrile, 0.4% acetic acid and 0.005% HFBA) (Fig. 1B) to elute peptides out of the peptide trap and into the C18 column. Separated peptides from the column were automatically analyzed by the ion trap equipped with a nanospray ionization source for MS and MS/MS analysis.
FIGURE 1.
Plumbing for automated analysis of multiple peptide samples using the HPLC autosampler and divert valve of LCQ mass spectrometer. A: In the waste mode, flow split before the peptide trap was blocked at valve position 6, so that all sample and solvent flowed through the trap. Peptides were trapped and solvent diverted to waste. The mass detector was set to Off during peptide trapping. B: In the source mode, flow split before the trap was on and diverted most solvent to waste. Flow split after the trap was blocked at valve position 6 to allow 150 nL/min of solvent gradient (detailed in Materials and Methods) to flow through the peptide trap to elute peptides into C18 microcapillary column. Separated peptides were injected into the mass spectrometer for MS and MS/MS analysis. Backpressure was controlled with the length of peek tubing (0.0025″ ID) at valve position 4.
To optimize the analysis of peptides by the mass spectrometer, angiotensin I was used to tune the mass spectrometer. The spray voltage was adjusted to 1.8 kV and the capillary temperature set to 200°C. The fragmentations of peptide ions were obtained in data-dependent mode using the following conditions: 35 units of collision energy, 0.25 units of activation Q, and 30 msec of activation time. Each full MS scan was followed by three MS/MS scans of the three most intense peaks in the full MS spectrum with dynamic exclusion enabled to allow detection of less abundant peptide ions.
Data Analysis
Peptides and proteins were identified using TurboSequest® software (ThermoFinnigan), which uses the MS and MS/MS spectra of peptide ions to search against the publicly available NCBI nonredundant protein database (www.ncbi.nlm.nih.gov). The protein identification criteria that we used were reported previously.10
RESULTS AND DISCUSSION
Immunoprecipitation Followed by 1D SDS-PAGE
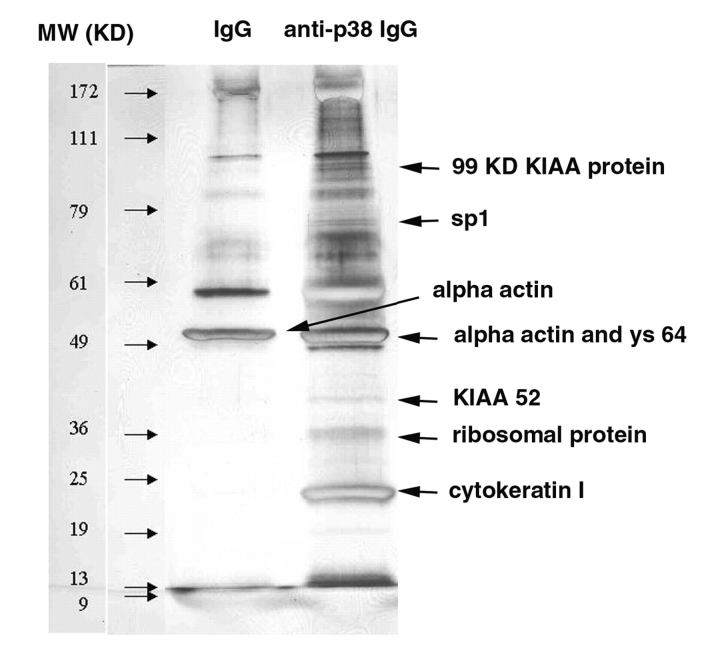
Immunoprecipitation of target protein and other proteins associated with target protein is an efficient tool to study protein–protein interaction. The interacting proteins can then be separated by their sizes by SDS-PAGE. We used a monoclonal anti-p38 MAP kinase antibody to target p38β proteins and other proteins that may bind to p38 directly or indirectly. The immunocomplex was precipitated as described in Materials and Methods. Approximately 37 p38-associated protein bands were visualized when the immunoprecipitates were separated by SDS-PAGE and silver-stained (Fig. 2). Some of these protein bands may be the nonspecific binding products, since they also appeared in the control (mouse IgG immunoprecipitates). Further studies might be required to optimize immunoprecipitation conditions so that nonspecific binding can be reduced to minimal levels.
FIGURE 2.
Silver-stained SDS-PAGE gel of the immunoprecipitates.
Validation of the Automated LC-MS/MS Method Using Angiotensin I
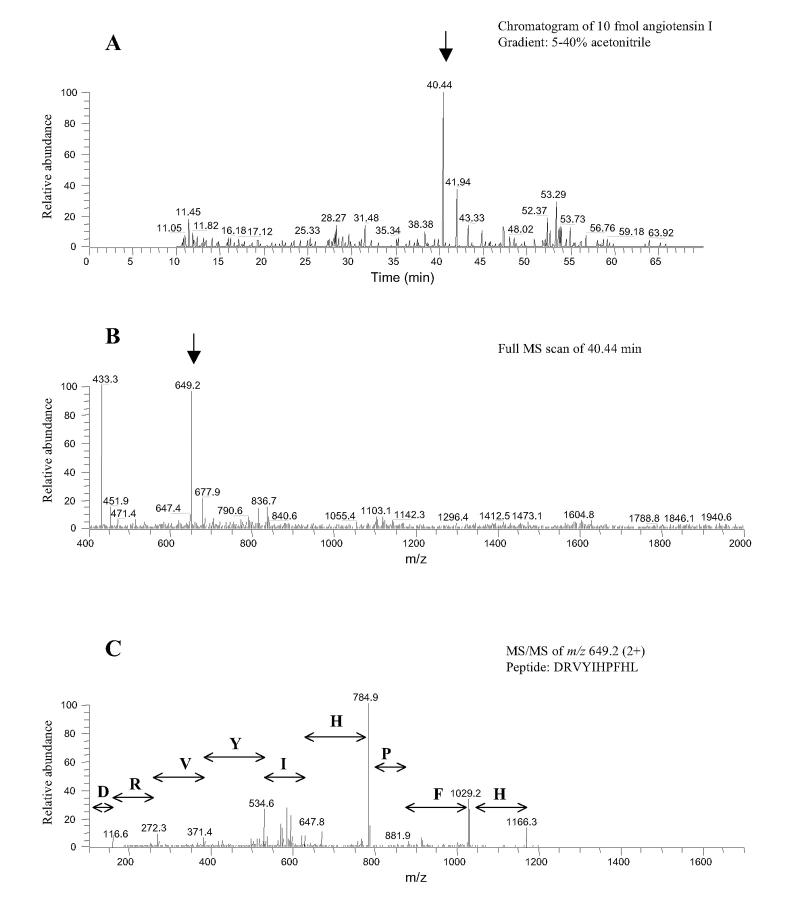
The manual sample loading process of the conventional LC-MS/MS method for protein/peptide analysis is time consuming and labor intensive when tens or hundreds of samples are involved. The obstacle of automation is the large dwell volume from connecting lines and the injector when using an autosampler for nanoflow LC-MS/MS. To overcome this problem we made use of the divert valve of the mass spectrometer and a peptide trap (2 μg capacity) which allows faster flow rate and automated sample analysis (Fig. 1). This automated setting potentially allows for the continuous processing of up to 200 samples. The largest number of digested protein samples we tested was 40 using the same in-house packed C18 column. To validate the automated LC-MS/MS method for sensitive and specific analysis of peptides, we tested the method using pure angiotensin I (molecular weight 1296.5; Sigma, St. Louis, MO). Figure 3 shows that at the level of 10 fmol angiotensin I, consistent and accurate detection of the peptide was achieved. The peptide was well separated by the C18 column at the middle of a 5–40% acetonitrile gradient (see Figure 3A, arrow). The doubly charged ion of angiotensin I (m/z 649.25; Fig. 3B) was selected for MS/MS analysis (Fig. 3C), which led to the identification of the peptide after database search by TurboSequest®. These results confirmed the sensitivity and specificity of the automated method. The sensitivity of our method may be further improved by using a peptide trap with smaller internal diameter, which has just become commercially available.
FIGURE 3.
Detection of 10 fmol angiotensin I using the automated method.
Automated Analysis of Multiple Samples Derived from Immunoprecipitation Complex
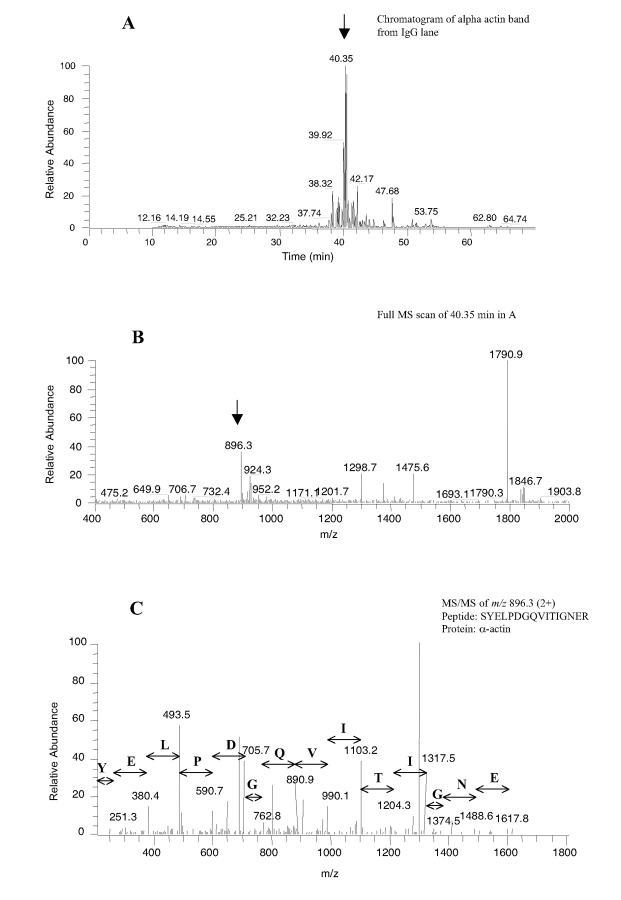
After in-gel digestion of each separated protein band by trypsin, the peptide samples from each protein band were analyzed using the automated LC-MS/MS method. All peptide samples from the anti-p38 immunoprecipitation complex and 3 samples from the mouse IgG immunoprecipitation complex were analyzed. Out of the 37 anti-p38 samples derived from the excised protein bands in the SDS-PAGE gel, over 50 proteins were identified, including cytoskeletal proteins, ribosomal proteins, transcription factors, and KIAA potential signaling proteins. These proteins are the potential targets that may interact directly or indirectly with p38 MAP kinase. Further studies will be required to determine the precise nature of the interaction of these proteins with the p38 MAP kinase protein. The identities and gel bands of some potential p38-binding proteins are shown in Figure 2. Analysis of the alpha actin band from IgG gel was shown as an example of peptide identification (Fig. 4). The tryptic peptides were well separated by the C18 column with several dominant peaks observed (Fig. 4A). Full MS spectrum at retention time 40.35 (Fig. 4B) showed two abundantly charged ions from one peptide, a doubly charged (m/z 896.3) and a singly charged ion (m/z 1790.9). MS/MS spectrum of the doubly charged ion (Fig. 4C) matched a 16-amino acid tryptic peptide (SYELPDGQVITIGNER) which matched the protein alpha actin. Our studies demonstrate the utility of automated nanoflow LC-MS/MS for sensitive and high-throughput analysis of protein/peptide complexes. Peng at al.11 recently reported an automated method for multidimensional LC-MS/MS analysis of the yeast proteome. An in-house vented C18 column was used for peptide trapping at about a two- to threefold slower flow rate than our method. The sensitivity was similar to what we observed in our experiments.
FIGURE 4.
Detection of alpha actin from an in-gel digested sample of the control IgG immunoprecipitates using the automated method.
In our experiments, proteins including alpha actin and several cytokeratins were detected from both anti-p38 and mouse IgG immunoprecipitates. Most of these were considered nonspecific binding proteins to p38. However, Edmondson et al.9 found that some IgG binding proteins were also specific target binding proteins. Thus, caution needs to be taken when determining the binding status of these proteins, and validation by reciprocal immunoprecipitation and Western blot is required.
In conclusion, our approach provides a high-throughput nanoflow LC-MS/MS method to quickly analyze a large number of protein/peptide samples with high sensitivity and specificity using the regular setting of an HPLC and autosampler.
Acknowledgments
We would like to thank Dr. Steven P. Gygi for providing valuable information on equipment and column packing. We also thank Dr. Alan Rockwood and Mark Kushnir for their helpful discussion.
REFERENCES
- 1.Flatman PW. Regulation of Na-K-2Cl cotransport by phosphorylation and protein–protein interactions. Biochim Biophys Acta 2002;1566:140–151. [DOI] [PubMed] [Google Scholar]
- 2.Gallie DR. Protein–protein interactions required during translation. Plant Mol Biol 2002;50:949–970. [DOI] [PubMed] [Google Scholar]
- 3.Hink MA, Bisselin T, Visser AJ. Imaging protein–protein interactions in living cells. Plant Mol Biol 2002;50:871–883. [DOI] [PubMed] [Google Scholar]
- 4.Kiyokawa H, Kineman RD, Manova-Todorova KO, et al. Enhanced growth of mice lacking the cyclin-dependent kinase inhibitor function of p27(Kip1). Cell 1996;85: 721–732. [DOI] [PubMed] [Google Scholar]
- 5.Coleman KG, Wautlet BS, Morrissey D, et al. Identification of CDK4 sequences involved in cyclin D1 and p16 binding. J Biol Chem 1997;272:18869–18874. [DOI] [PubMed] [Google Scholar]
- 6.Ball KL. p21: Structure and functions associated with cyclin–CDK binding. Prog Cell Cycle Res 1997;3:125–134. [DOI] [PubMed] [Google Scholar]
- 7.Hung WC, Chang HC, Pan MR, Lee TH, Chuang LY. Induction of p27(KIP1) as a mechanism underlying NS398-induced growth inhibition in human lung cancer cells. Mol Pharmacol 2000;58:1398–1403. [DOI] [PubMed] [Google Scholar]
- 8.Lewis TS, Hunt JB, Aveline LD, et al. Identification of novel MAP kinase pathway signaling targets by functional proteomics and mass spectrometry. Mol Cell 2000;6:1343–1354. [DOI] [PubMed] [Google Scholar]
- 9.Edmondson RD, Vondriska TM, Biederman KJ, et al. Protein kinase C epsilon signaling complexes include metabolism- and transcription/translation-related proteins: Complimentary separation techniques with LC/MS/MS. Mol Cell Proteomics 2002;1:421–433. [DOI] [PubMed] [Google Scholar]
- 10.Lee H, Griffin TJ, Gygi SP, Ristand B, Aebersold R. Development of a multiplexed microcapillary liquid chromatography system for high-throughput proteome analysis. Anal Chem 2002;74:4353–4360. [DOI] [PubMed] [Google Scholar]
- 11.Peng J, Elias JE, Thoreen CC, Licklider LJ, Gygi SP. Evaluation of multidimensional chromatography coupled with tandem mass spectrometry (LC/LC-MS/MS) for large-scale protein analysis: The yeast proteome. J Proteome Res. 2003;2:43–50. [DOI] [PubMed] [Google Scholar]


