Abstract
The mechanisms by which peptides and proteins form ordered aggregates are not well understood. Here we focus on the physicochemical properties of amino acids that favor ordered aggregation and suggest a parameter-free model that is able to predict the change of aggregation rates over a large set of natural sequences. Furthermore, the results of the parameter-free model correlate well with the aggregation propensities of a set of peptides designed by computer simulations.
Keywords: amyloid, prion, aggregation rate, Alzheimer, protein deposit, mutation
Amyloid fibrils are involved in a number of diseases, including Alzheimer’s disease, Parkinson’s disease, Huntington’s disease, prion disease, and type II diabetes (Kelly 1998; Rochet and Lansbury Jr. 2000). Therefore, it is of fundamental medical interest to understand the mechanisms of fibrillogenesis with the ultimate goal of designing inhibitors. The amyloid fibril formation is not a property limited to a selected few proteins: Under certain conditions it has been shown that any polypeptide chain can form fibrils (Dobson 1999). Because aggregation conditions vary sensibly with the composition and sequence of the polypeptide, single amino acid substitution has been used to investigate the fibril formation (Chiti et al. 2002). In this study we propose a formula to predict the change of aggregation and disaggregation rate upon mutation. The agreement between the experimental data and our formula leads us to the conclusion that the formation of fibrils can be explained with a simple model based on physicochemical properties of amino acids. We found that the polar and the nonpolar water-accessible surface areas, the dipole moment, and the π-stacking interaction of aromatic residues (Gazit 2002) are essential beside the charge and the β-propensity of the sequence (Chiti et al. 2003). To have the most possible general model, we do not use any parameter that needs to be experimentally estimated. Furthermore, our equation does not present any redundancy, whereas in previous work by others charge and hydrophobicity were considered independent and used as two different variables in the best-fitting (Chiti et al. 2003).
We propose the following function to predict the effect of a mutation on aggregation rate:
 |
(1) |
where νwt and νmut are the aggregation rates of the wild type and mutant, respectively. The factor φh captures most of the nonpolar and polar interactions. An amino acid is called p if its side chain carries a charge or a dipole; otherwise it is called a.
For mutations that involve same type of amino acids a →a or p →p
 |
where ASAa and ASAp are the nonpolar and polar water-accessible surface areas of the amino acid side chains (Makhatadze and Privalov 1990; Karplus 1997). Interestingly, experimental evidence has been published recently on the importance of nonpolar solvent-accessible surface area for the amyloid-like properties of apomyoglobin (Chow et al. 2003).
For mutations that involve different types of amino acids (a →p or p →a)
 |
where D is the magnitude of the dipole of the amino acid side chains. The function φhI implies that the hydrophobicity and aggregation rate increase as the mutation results in a larger nonpolar surface or smaller polar surface. In φhII, it has been assumed that the nonpolar surface of p amino acids compensates the nonpolar surfaces of a amino acids so that the dipole of p amino acids exclusively characterizes the mutation (see Supplementary Table 1).
The factor φβ is related to the ratio of β-sheet propensities (Street and Mayo 1999; see Supplementary Table 1):
 |
Functions φa and φc approximate the effect of the aromatic residues A and total charge C, respectively:
 |
The factor ½ before C has been introduced to have the same range [−1, 1] for the arguments of the two exponential functions.
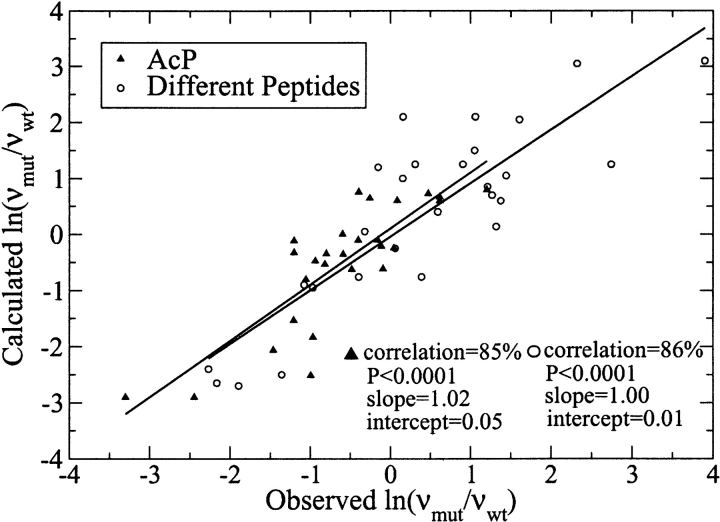
In Figure 1 ▶ our model is used to predict the changes in aggregation rates occurring in human muscle acylphosphatase (AcP), islet amyloid polypeptide, prion peptides, α-synuclein, amyloid β-peptide, tau, leucine-rich repeat, and some model peptides. As in Chiti et al. (2003), we divided the data set in two parts to compare with their equation. The correlation obtained with equation 1 is significant (85% and 86% and P < 10−4), and slightly better than the one obtained by Chiti et al. using three parameters derived from best fitting (76% and 85% and P < 10−4). The good agreement with experiments shows that our simple equation, which does not contain any parameter, is very general and can be used to describe the aggregation of several and heterogeneous protein systems.
Figure 1.
Calculated vs. observed (Chiti et al. 2003) changes in aggregation rate upon mutation: AcP (28 triangles) and heterogeneous groups of peptide and protein systems, including islet amyloid polypeptide, prion peptides, α-synuclein, amyloid β-peptide, τ, leucine-rich repeat and some model peptides (27 circles).
The validity of the formula is proved also by rearranging the whole data set per a and p mutations: Slopes and correlations are very close (see Supplementary Fig. 1 ▶; p →p: slope = 1.01, correlation = 80%, number of points = 28; a →a: slope = 0.92, correlation = 82%, number of points = 15; a →p and p →a: slope = 1.01, correlation = 89%, number of points = 12).
Aggregation and disaggregation are intrinsically different, but the role played by the hydrophobicity, β-propensity, π-stacking, and charge is the same. Considering that disaggregation and aggregation are opposite processes, the direct proportionality relation between νmut/νwt and φhφβ φaφc that describes the aggregation turns into a relation of inverse proportionality for the disaggregation. Therefore, the reciprocal of equation 1 can be used to describe the disaggregation:
 |
(2) |
To verify the validity of this assumption, we applied equation 2 to heptapeptide sequences suggested by a genetic algorithm approach (G. Tartaglia and A. Caflisch, in prep.). The genetic algorithm searches the space of sequences for those that have the best match to a certain three-dimensional target conformation (an in-register parallel aggregate of three heptapeptides [Gsponer et al. 2003]). For each peptide sequence, three replicas are submitted to a 330 K molecular dynamics simulation, starting from the β-parallel aggregated conformation (CHARMM parameter 19 [Brooks et al. 1983] and solvent accessible surface-based solvation model [Ferrara et al. 2002]). A temperature of 330 K is used to obtain enough sampling in the time scale of the simulations (Gsponer et al. 2003). Peptide sequences are ranked according to their ability to prevent disaggregation. The disaggregation rate is estimated for each sequence as the reciprocal of the number of snapshots whose Cα root mean square deviation (RMSD) from the template is lower than 1 Å. Best matches, called best parents, are replicated and subjected to mutations and crossover: 103 sequences have been studied for a total amount of 50 μ sec of simulation. The genetic algorithm predicted several sequences similar to segments of amyloidogenic protein as well as the sequence HFWLVFF, which presents five matches with the amyloid β-peptide fragment HQKLVFF (Tjernberg et al. 1999; Williams et al. 2004). By considering that the genetic algorithm sampled 103 sequences and a random search approximately needs 106 sequences to scan before finding five matches, we conclude that the genetic algorithm approach performs 103 better than random.
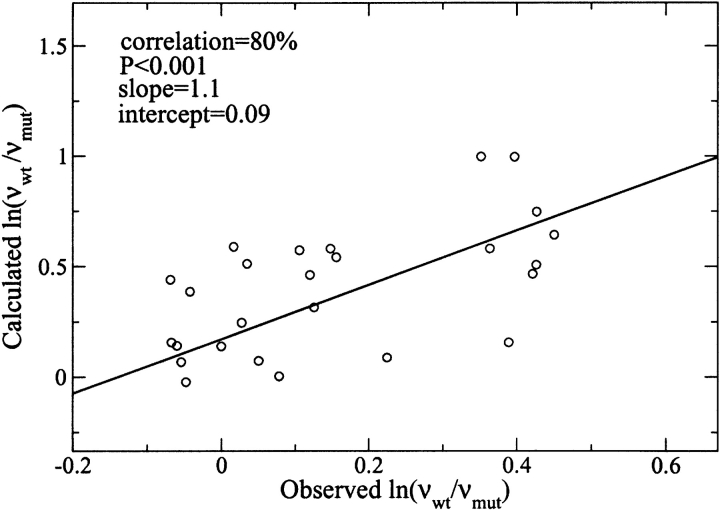
Disaggregation rates are analyzed with equation 2 only for best parents (4% of data) for which false positives are supposed to be less than the false negatives in the remaining set. Furthermore, to have statistical significance, each disaggregation rate has been averaged over a set of five molecular dynamics trajectories. Figure 2 ▶ shows that equation 2 holds and the correlation is very high (80% and P < 10−3). In conclusion, the present results indicate that a simple model based on physicochemical properties without parametrization is able to predict aggregation and disaggregation rates.
Figure 2.
Calculated vs. observed changes in disaggregation rate upon mutation: Best parents of genetic algorithm approach (27 circles). (See Supplementary Table 2.)
Acknowledgments
We thank Dr. E. Paci for interesting discussions and Prof. F. Chiti for providing rates of AcP. This work was supported by the Swiss National Science Foundation (grant no. 31-64968.01 to A.C.) and the National Center of Competence in Research (NCCR) in Structural Biology.
The publication costs of this article were defrayed in part by payment of page charges. This article must therefore be hereby marked “advertisement” in accordance with 18 USC section 1734 solely to indicate this fact.
Article published online ahead of print. Article and publication date are at http://www.proteinscience.org/cgi/doi/10.1110/ps.04663504.
Supplemental material: see www.proteinscience.org
References
- Brooks, B.R., Bruccoleri, R.E., Olafson, B.D., States, D.J., Swaminathan, S., and Karplus, M. 1983. CHARMM: A program for macromolecular energy, minimization, and dynamics calculations. J. Comput. Chem. 4 187–217. [Google Scholar]
- Chiti, F., Calamai, M., Taddei, N., Stefani, M., Ramponi, G., and Dobson, C. 2002. Studies of the aggregation of mutant proteins in vitro provide insights into the genetics of amyloid diseases. Proc. Natl. Acad. Sci. 99 16419–16426. [DOI] [PMC free article] [PubMed] [Google Scholar]
- Chiti, F., Stefani, M., Taddei, N., Ramponi, G., and Dobson, C. 2003. Rationalization of the effects of mutations on peptide and protein aggregation rates. Nature 424 805–808. [DOI] [PubMed] [Google Scholar]
- Chow, C., Chow, C., Raghunathan, V., Huppert, T.J., Kimball, E.B., and Cavagnero, S. 2003. Chain length dependence of apomyoglobin folding: Structural evolution from misfolded sheets to native helices. Biochemistry 42 7090–7099. [DOI] [PubMed] [Google Scholar]
- Dobson, C.M. 1999. Protein misfolding, evolution and disease. Trends Biochem. Sci. 24 329–332. [DOI] [PubMed] [Google Scholar]
- Ferrara, P., Apostolakis, J., and Caflisch, A. 2002. Evaluation of a fast implicit solvent model for molecular dynamics simulations. Proteins 46 24–33. [DOI] [PubMed] [Google Scholar]
- Gazit, E. 2002. A possible role for π-stacking in the self-assembly of amyloid fibrils. FASEB J. 16 77–83. [DOI] [PubMed] [Google Scholar]
- Gsponer, J., Haberthür, U., and Caflisch, A. 2003. The role of side-chain interactions in the early steps of aggregation: Molecular dynamics simulations of an amyloidforming peptide from the yeast prion Sup35. Proc. Natl. Acad. Sci. 100 5154–5159. [DOI] [PMC free article] [PubMed] [Google Scholar]
- Karplus, P. 1997. Hydrophobicity regained. Protein Sci. 6 1302–1307. [DOI] [PMC free article] [PubMed] [Google Scholar]
- Kelly, J. 1998. The alternative conformations of amyloidogenic proteins and their multi-step assembly pathways. Curr. Opin. Struct. Biol. 8 101–106. [DOI] [PubMed] [Google Scholar]
- Makhatadze, G. and Privalov, P. 1990. Heat capacity of proteins 1 partial molar heat capacity of individual amino acid residues in aqueous solution: Hydration effect. J. Mol. Biol. 213 375–384. [DOI] [PubMed] [Google Scholar]
- Rochet, J.C. and Lansbury Jr., P.T. 2000. Amyloid fibrillogenesis: Themes and variations. Curr. Opin. Struct. Biol. 10 60–68. [DOI] [PubMed] [Google Scholar]
- Street, A. and Mayo, S. 1999. Intrinsic β-sheet propensities result from van der Waals interactions between side chains and the local backbone. Proc. Natl. Acad. Sci. 96 9074–9076. [DOI] [PMC free article] [PubMed] [Google Scholar]
- Tjernberg, L., Callaway, D., Tjernberg, A., Hahne, S., Lilliehook, C., Terenius, L., Thyberg, J., and Nordstedt, C. 1999. A molecular model of Alzheimer amyloid β-peptide fibril formation. J. Biol. Chem. 274 12619–12625. [DOI] [PubMed] [Google Scholar]
- Williams, A., Portelius, E., Kheterpal, I., Guo, J., Cook, K., Xu, Y., and Wetzel, R. 2004. Mapping Aβ amyloid fibril secondary structure using scanning proline mutagenesis. J. Mol. Biol. 335 833–842. [DOI] [PubMed] [Google Scholar]


