

Abstract
A proteomics-based method using stable isotope labeling to assess the relative abundance of peptides or proteins is described. Bradykinin and carbonic anhydrase were labeled with sulfosuccinimidyl-2-(biotinamido) ethyl-1,3-dithiopropionate, a membrane impermeant reagent that is reactive with primary amines. Specificity of the label to primary amines was demonstrated using tandem mass spectrometry. Also, relative quantitation was achieved by secondary labeling with natural isotopic abundance and stable isotope-labeled methyl iodide. We believe this to be an effective stable isotope-labeling method for quantitative proteomics.
Keywords: stable isotope labeling, Sulfo-NHS-SS-biotin, proteomics
Proteomics has burgeoned in the past decade due to significant developments in the areas of sample preparation, protein and peptide fractionation, instrumental analysis, and bioinformatics tools. One advancement, for example, is the improvement and commercialization of mass spectrometers that allow for better protein identification and characterization.1,2 Other specific innovations include the development of methods in proteomics that allow for facile determination of relative expression levels of proteins. Currently, the two primary techniques used for quantitation in proteomics are 2-dimensional polyacrylamide gel electrophoresis (2D-PAGE) and stable isotope labeling.
2D-PAGE coupled to mass spectrometry (MS) has formed the basis of many quantitative proteomics studies. Quantitation of the proteins separated by 2D-PAGE involves the detection of the protein spots using visualization tools such as dyes or fluorescent tags. Changes in relative abundances are determined by comparing the protein spot intensities between different samples that have been separated on two separate gels. The ability to quantitate is dependent on the method used to visualize the proteins. Innovations in fluorescent dyes such as Sypro Ruby have allowed for increased detection limits and wider dynamic ranges in relative quantitation, enabling research with small amounts of tissue or cells from patients with various disorders and diseases, such as ductal carcinoma in situ.3 Additionally, development of difference gel electrophoresis (DIGE) using fluorescent protein coupling reagents has improved variability issues related to 2D-PAGE, since two distinct proteome samples can be separated on a single gel.4
Another common technique for quantitative proteomics involves stable isotope incorporation into the protein and relies on signals recorded by the mass spectrometer to assay for relative changes in expression levels. This method is based on differentially labeling proteins from two different sources with stable isotopes. When peptides from the two sources are analyzed concurrently, two distinct peaks representing the differentially labeled species are detected by MS. Relative quantitation is measured by comparing the areas of the peaks of the identical, yet isotopically distinct, peptides. The stable isotopes can be introduced either during cell growth (metabolic labeling) or after proteins are extracted. Innovative methods for the post-extraction isotopic labeling of proteins include acrylamide-labeling of cysteines,518O-labeling of tryptic peptides,6 and methyl esterification of carboxylic acids.7 The most popular example of introduction of a stable isotope into proteins or peptides is the use of reagents termed isotope coded affinity tags (ICAT).8 ICAT reagents consist of a cysteine reactive moiety and either a linker region that contains eight protons (D0)m termed the “light” reagent, or a linker region that contains eight deuteriums (D8), termed the “heavy” reagent, plus a biotin moiety that can be used to affinity-purify cysteine-containing peptides labeled with ICAT. A new generation of ICAT reagents is now available in which nine 12C atoms in the light reagent have been replaced with 13C atoms in the heavy reagent.
We have devised a stable isotope-labeling strategy similar to ICAT. Instead of targeting cysteines, however, our strategy utilizes a membrane-impermeant biotinylating reagent, sulfosuccinimidyl-2-(biotinamido) ethyl-1,3-dithiopropionate (Sulfo-NHS-SS-biotin), which reacts with primary amines, i.e., lysines and the unmodified amino termini of proteins. We have used this reagent to successfully label and enrich for lysine-containing peptides and proteins. Additionally, we have been able to introduce a secondary heavy isotope label (D0- or 13CD3-methyl iodide) to allow for the assessment of relative amounts of protein between two samples.
MATERIALS AND METHODS
Materials
Bradykinin, carbonic anhydrase I, dithiothreitol (DTT), methyl iodide, and Trypan blue were purchased from Sigma (St Louis, MO). EZ-Link Sulfo-NHS-SS-biotin, Ultralink Plus Immobilized Streptavidin Gel, and FITC-conjugated avidin were purchased from Pierce (Rockford, IL). Asp-N was obtained from Roche Diagnostics (Indianapolis, IN). 13CD3-methyl iodide was purchased from Cambridge Isotope Laboratories (Andover, MA). α-cyano-4-hydroxycinnamic acid was purchased from Agilent Technologies (Palo Alto, CA). RPMI 1640, fetal bovine serum (FBS), penicillin, streptomycin, and glutamine were acquired from Invitrogen (Carlsbad, CA).
Labeling and Digestion of Bradykinin and Carbonic Anhydrase
Bradykinin and carbonic anhydrase were incubated with the membrane-impermeable reagent, Sulfo-NHS-SS-biotin, for 30 min at room temperature in Ca2+- and Mg2+-free PBS (PBS-CMF), pH 8.0. After incubation, carbonic anhydrase was digested with Asp-N (9 ng/μL) overnight at 37°C. Labeling experiments were completed in triplicate.
Isolation of Biotinylated Peptide, Mass Spectrometry, and Data Processing and Analysis
Peptides were applied to a streptavidin resin, reduced off of the resin with 5 mM DTT in PBS-CMF, and alkylated with either 100 mM methyl iodide or 13CD3-methyl iodide at room temperature for 2 h. The labeled peptides were co-crystallized in a matrix of α-cyano-4-hydroxycinnamic acid and analyzed by MALDI-TOF/TOF MS (matrix-assisted laser desorption/ionization time-of-flight/TOF-MS) using an ABI 4700 Proteomics Analyzer (Applied Biosystems, Foster City, CA) as previously described.9 MS and MS/MS spectra were interpreted to yield protein identities using the MS-Fit and MS-Tag programs.10 Additional LC-MS/MS analysis was done using an Agilent HP1100 coupled on-line with an ion trap mass spectrometer (LCQ Deca, Finnigan, San Jose, CA). The peptides were separated using a 0.75 × 100-mm column packed with Jupiter resin (5 μm particle size; 300 Å pore size). Peptides were eluted over 40 min from 5% to 40% solvent B and then to 95% solvent B over the next 40 min. Solvent A was 0.1% formic acid and solvent B was 0.1% formic acid in acetonitrile. MS/MS data were searched against the nonredundant.fasta database with the Sequest algorithm as previously described.11,13 Only peptides with a delta-correlation score of at least 0.1 and cross-correlation scores of at least 1.9 for singly charged peptides, 2.5 for doubly charged, and 3.0 for triply charged peptides were accepted.
RESULTS
In our strategy, proteins are labeled with the primary amine specific reagent, Sulfo-NHS-SS-biotin. The biotin moiety of this reagent allows for the enrichment and isolation of the labeled peptides with immobilized streptavidin. The disulfide bond within the linker region serves two purposes. First, it provides a convenient way to elute the labeled peptides from the streptavidin column through the addition of a reducing agent. Second, after the elution, the presence of the free thiol is exploited for quantitation by methylation with D0- or 13CD3-methyl iodide. This introduces either a “light” or “heavy” isotope label onto the peptide and allows for the relative quantitation of labeled peptides from different samples to be measured.
In a proof-of-concept experiment, a control peptide was labeled with Sulfo-NHS-SS-biotin. Bradykinin was chosen because it contains a single primary amine, i.e., the amino terminus of the peptide. Figure 1A shows the MALDI-TOF/TOF spectrum of bradykinin. The other peaks present in the spectra represent contaminants in the procured sample. The effective labeling of bradykinin with NHS-SS-biotin was monitored by MS as shown in Figures 1A and 1B. The mass difference between these two signals is in agreement with the expected difference between the labeled (Figure 1B) and unlabeled peptides (Figure 1A). Also, this derivatization step is shown to be highly effective, as the unlabeled bradykinin (m/z 1060.57) is not present in Figure 1B. Furthermore, we did not detect any dramatic changes in sensitivity between the underivatized and derivatized peptides by MALDI.
FIGURE 1.
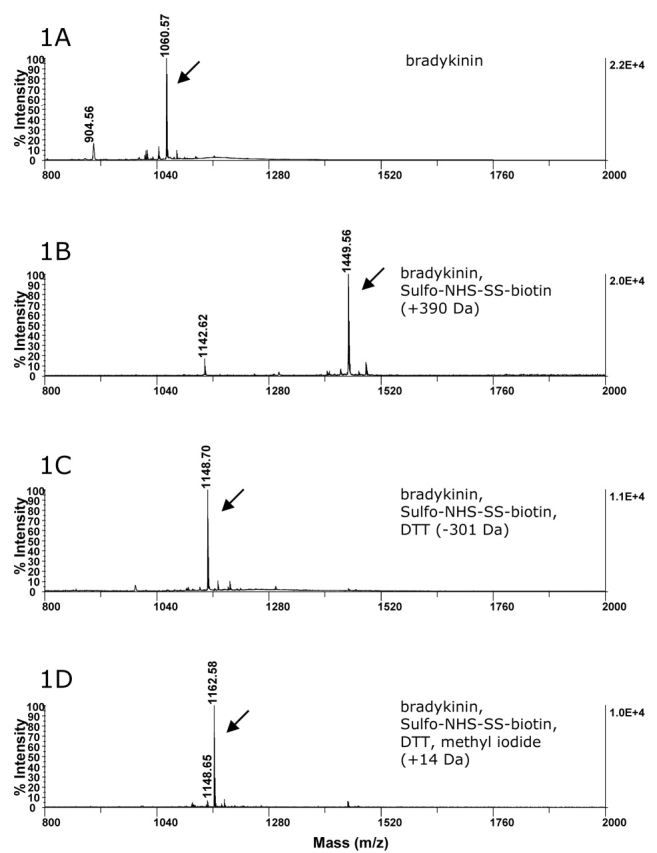
MALDI-TOF/TOF spectra of bradykinin control. Arrows denote bradykinin peaks. Bradykinin (A) was labeled with Sulfo-NHS-SS-biotin (B). After application of the sample to a streptavidin column, the peptide was retrieved with the addition of 5 mM DTT. The biotin moiety and part of the linker arm were retained on the column (C). The resulting free thiol on the labeled peptide was methylated with methyl iodide (D).
Next, the labeled peptide was introduced to a streptavidin column and eluted with the addition of DTT. This treatment resulted in a decrease in the mass of the labeled peptide of 301.4 Da, corresponding to the loss of the biotin moiety and part of the linker region of the label (Figure 1C). The resulting free thiol in the linker region of the labeling reagent after reduction with DTT was subsequently alkylated using methyl iodide. This reaction resulted in a 14-Da increase in the mass of the modified peptide, as shown in Figure 1D. Also, as seen by the present of m/z 1148.65 in Figure 1D, a small percentage of the sample remained unalkylated even though excess methyl iodide was used.
A tandem MS experiment was conducted to identify b- and a-ions to ensure the specificity of both Sulfo-NHS-SS-biotin labeling on the N-terminal arginine and secondary labeling of the free thiol with methyl iodide. Multiple b- and a-ions were observed within the MS/MS spectrum of the labeled, reduced, and methylated bradykinin that showed an increase in mass of 102 Da, confirming the specificity of the overall labeling reaction (Figure 2). Additionally, bradykinin was identified when database searches with this MS/MS spectrum were done.
FIGURE 2.
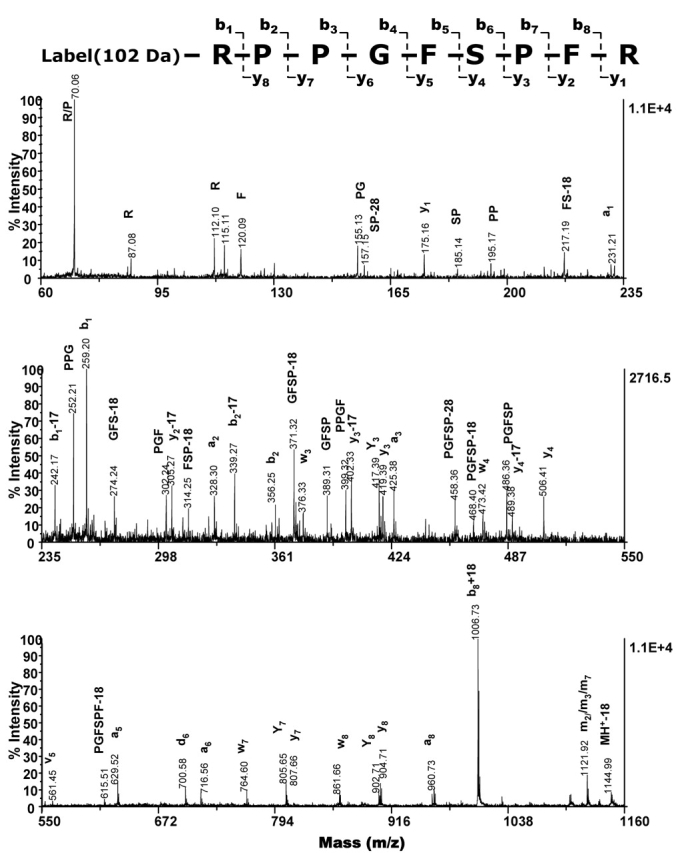
Tandem MS spectrum acquired using a MALDI-TOF/TOF shows that Sulfo-NHS-SS-biotin specifically labels the primary amine of bradykinin. Bradykinin was biotinylated, applied to a streptavidin column, reduced off of the resin, and methylated with methyl iodide. Fragment ions including immonium ions are indicated above peaks, and the cleavage sites in the y- and b-series are labeled. The observed m/z of the b1-, a1-, b2-, a2-, a3-, a5-, and b8+18-ions shows the expected increase in m/z of 102 Da.
We investigated the effect of stable isotope labeling with either D0-methyl iodide or 13CD3-methyl iodide. Comparison of methylation with these reagents revealed the expected difference of 4 Da between the “light” and “heavy” labels (Figure 3). Mixing of the two samples at various ratios with either the normal isotopic abundance (Figure 3A) or the 13CD3-labeled peptide in excess (Figure 3B) was performed to see if the method was viable for determining relative abundances. The relative ratios of normal and 13CD3-labeled species were calculated according to previous reports.14 Plotting the relative ratios of the average of three measured values vs. expected values, i.e., ratios of the intensities of labeled peptides vs. the ratios of quantities of labeled peptides, shows that relative quantitation at ratios up to 1:10 were established using these reagents (Figure 3C). Additional experiments using ratios of 1:50 and 1:100 were conducted. While the differences in levels of abundance were detected at 1:50 and 1:100, the relative ratios of intensities were not in the linear range and, as a result, did not afford reliable quantitation (data not shown).
FIGURE 3.


Stable isotope tagging allowed for quantitation of relative levels of bradykinin. Sulfo-NHS-SS-biotin-labeled bradykinin was applied to a streptavidin column, reduced off of the resin, methylated with either normal isotopic abundance methyl iodide or 13CD3-methyl iodide, and mixed at various ratios either with the D0-methyl iodide-labeled peptide in excess (A) or with the 13CD3-methyl iodide-labeled peptide in excess (B).
Calculations of the relative ratios of intensities of the monoisotopic peaks of the normal and 13CD3-labeled peptides were used to establish quantitation (C). Ratios of the intensity of D0-labeled peptide: intensity of 13CD3-labeled peptide plotted against the ratios of the quantity of D0-labeled peptide: quantity of 13CD3-labeled peptide (D0-methyl iodide labeled peptide in excess) and ratios of the intensity of 13CD3-labeled peptide: intensity of D0-labeled peptide plotted against the ratios of the quantity of 13CD3-labeled peptide: quantity of D0-labeled peptide (13CD3-methyl iodide labeled peptide in excess) show relative quantiation at ratios up to 1:10 were achieved. Error bars reflect the standard deviation derived from three separate experiments. Spectra were acquired on a MALDI-TOF/TOF.
To further assess this labeling strategy, carbonic anhydrase was labeled with Sulfo-NHS-SS-biotin and digested with Asp-N. MS and MS/MS analysis by MALDI-TOF/TOF and LC-MS/MS after affinity isolation of the biotinylated peptides and reduction of the linker region confirmed successful labeling of the protein. We were able to identify by MS and MS/MS 11 of the 18 possible sites of modification by Sulfo-NHS-SS-biotin (Figure 4). The remaining sites were either unlabeled or not detected. Peptides that were unique to MALDI-TOF/TOF analysis are underlined and those unique to LC-MS/MS are shown in bold print. Comparison of sequence coverage between analysis by MALDI-TOF/TOF or by LC-MS/MS showed a high percentage of overlap, as indicated by the bold, underlined peptides seen in Figure 4.
FIGURE 4.

Sequence coverage of Sulfo-NHS-SS-biotin labeled carbonic anhydrase digested with Asp-N and affinity purified. Peptides were analyzed on both a MALDI-TOF/TOF and also by nano-LC/MS/MS on an LCQ Deca XP coupled to an Agilent HPLC. Underlined peptides were recovered and identified by MALDI-TOF/TOF and confirmed with MS/MS. Bold peptides were recovered and identified by LC-MS/MS. Italicized residues are potential sites of modification, i.e., lysines and the N-terminus.
DISCUSSION
A new method to incorporate stable isotopes into proteins for quantitative proteomics has been presented. This method is capable of specifically labeling primary amines and has the capability of measuring the relative abundances of labeled peptides through a second labeling reaction with normal and isotopically labeled methyl iodide. This method has been demonstrated using both bradykinin and carbonic anhydrase.
The approach presented here is analogous to ICAT labeling with a few key differences. First, Sulfo-NHS-SS-biotin contains a cleavable linker, which provides the increased benefit of allowing for the analysis of larger peptides, since part of the linker region and also the biotin moiety are removed before MS. Two second-generation versions of ICAT that use cleavable linkers have also been reported: one contains an acid-cleavable linker and the other a photocleavable linker.15 There are a few differences, however, between Sulfo-NHS-SS-biotin and these ICAT reagents. The commercially available acid-cleavable ICAT reagent is cleaved by a two-step process and occurs post-elution from an avidin affinity column, whereas our cleavage and elution of labeled peptides occurs in one step while the modified peptides are still bound to the streptavidin column, making our procedure easier and quicker to perform. As in our method, elution of the labeled peptide using the photocleavable ICAT reagent occurs through cleavage of the reagent’s linker. Additionally, the sample remains very clean because the cleaving reagent is light. This photocleavable reagent, however, is not commercially available, unlike Sulfo-NHS-SS-biotin, which is readily obtainable. Although the standard and acid-cleavable ICAT reagents are commercially available, the costs of obtaining Sulfo-NHS-SS-biotin and isotopically labeled methyl iodide are small in comparison to the costs of these two ICAT reagents. Finally, Sulfo-NHS-SS-biotin targets lysines, whereas the ICAT reagents label cysteines. This is an added advantage of our strategy: Since lysines occur at a higher frequency in proteins than do cysteines, this will allow for a higher percentage of peptides from an individual protein to be recovered and analyzed.
While good coverage of carbonic anhydrase was obtained, it is not crucial to label and retrieve all lysine-containing peptides because unambiguous protein identification from a single peptide is frequently possible by searching with sequence tags.10,16 Additionally, relative quantitation through stable isotope incorporation has been reported to be accurate when based on one peptide because multiple peptides from the same protein yield similar and redundant measured changes in protein abundances.8,16
Although carbonic anhydrase has 18 sites available for possible labeling, only 11 sites were identified as labeled. While the use of denaturing conditions would have most likely allowed the label to access more potential sites and increase the efficiency of the labeling procedure, we chose to use nondenaturing conditions for specific reasons. Currently, global proteomics of mammalian cells and tissues, i.e., studies that use whole cell or tissue lysates, are geared toward studying the most abundant proteins in a cell. Additionally, these studies ignore the importance of protein localization. In order to study low abundance proteins and to address the possibility of a protein’s cellular translocation, subcellular fractionation must be done.18 These methods, however, are neither trivial nor easy. We used native conditions in these labeling experiments to design a method that has the potential to be applied to proteomics studies that target an important subset of proteins, those on the cells’ surface. Although these proteins play an important role in regulating a cell’s interactions with its surrounding milieu—and serve as attractive drug targets in defining a specific subset of cells—techniques to characterize these proteins by MS have been limited. Sulfo-NHS-SS-biotin is membrane impermeable and the conditions described would maintain mammalian cell viability and allow for targeting and enrichment of cell surface proteins without the use of subcellular fractionation. We predict that the reported method can potentially serve as another tool used to study these proteins.
Acknowledgments
This work was supported by NCI Contract No. NO-CO-12400. Also, we thank Lindsey Smith for editorial assistance.
REFERENCES
- 1.Chernushevich IV, Loboda AV, Thomson BA. An introduction to quadrupole-time-of-flight mass spectrometry.J Mass Spectrom 2001;36:849–865. [DOI] [PubMed] [Google Scholar]
- 2.Medzihradszky KF, Campbell JM, Baldwin MA, et al. The characteristics of peptide collision-induced dissociation using a high-performance MALDI-TOF/TOF tandem mass spectrometer.Anal Chem 2000;72:552–558. [DOI] [PubMed] [Google Scholar]
- 3.Wulfkuhle JD, Sgroi DC, Krutzsch H, et al. Proteomics of human breast ductal carcinoma in situ.Cancer Res 2002;62:6740–6749. [PubMed] [Google Scholar]
- 4.Zhou G, Li H, DeCamp D, Chen S, et al. 2D differential in-gel electrophoresis for the identification of esophageal scans cell cancer-specific protein markers.Mol Cell Proteomics 2002;1:117–124. [DOI] [PubMed] [Google Scholar]
- 5.Sechi S, Chait BT. Modification of cysteine residues by alkylation. A tool in peptide mapping and protein identification.Anal Chem 1998;70:5150–5158. [DOI] [PubMed] [Google Scholar]
- 6.Yao X, Freas A, Ramirez J, Demirev PA, Fenselau C. Proteolytic 18O labeling for comparative proteomics: model studies with two serotypes of adenovirus.Anal Chem 2001;73:2836–2842. [DOI] [PubMed] [Google Scholar]
- 7.Goodlett DR, Keller A, Watts JD, et al. Differential stable isotope labeling of peptides for quantitation and de novo sequence derivation.Rapid Commun Mass Spectrom 2001;15:1214–1221. [DOI] [PubMed] [Google Scholar]
- 8.Gygi SP, Rist B, Gerber SA, Turecek F, Gelb MH, Aebersold R. Quantitative analysis of complex protein mixtures using isotope-coded affinity tags.Nat Biotechnol 1999;17:994–999. [DOI] [PubMed] [Google Scholar]
- 9.Huang L, Baldwin MA, Maltby DA, et al. The identification of protein-protein interactions of the nuclear pore complex of Saccharomyces cerevisiae using high throughput matrix-assisted laser desorption ionization time-of-flight tandem mass spectrometry.Mol Cell Proteomics 2002;1:434–450. [DOI] [PubMed] [Google Scholar]
- 10.Clauser KR, Baker P, Burlingame AL. Role of accurate mass measurement (+/- 10 ppm) in protein identification strategies employing MS or MS/MS and database searching.Anal Chem 1999;71:2871–2882. [DOI] [PubMed] [Google Scholar]
- 11.Eng J, McCormack AL, Yates JR, 3rd. An approach to correlate tandem mass spectral data of peptides with amino acid sequences in a protein database.J Am Mass Spectrom 1994;5:976–989. [DOI] [PubMed] [Google Scholar]
- 12.Link AJ, Eng J, Schieltz DM, et al. Direct analysis of protein complexes using mass spectrometry.Nat Biotechnol 1999;17:676–682. [DOI] [PubMed] [Google Scholar]
- 13.Washburn MP, Wolters D, Yates JR, 3rd. Large-scale analysis of the yeast proteome by multidimensional protein identification technology.Nat Biotechnol 2001;19:242–247. [DOI] [PubMed] [Google Scholar]
- 14.Griffin TJ, Gygi SP, Rist B, et al. Quantitative proteomic analysis using a MALDI quadrupole time-of-flight mass spectrometer.Anal Chem 2001;73:978–986. [DOI] [PubMed] [Google Scholar]
- 15.Zhou H, Ranish JA, Watts JD, Aebersold R. Quantitative proteome analysis by solid-phase isotope tagging and mass spectrometry.Nat Biotechnol 2002;20:512–515. [DOI] [PubMed] [Google Scholar]
- 16.Mann M, Wilm M. Error-tolerant identification of peptides in sequence databases by peptide sequence tags.Anal Chem 1994;66:4390–4399. [DOI] [PubMed] [Google Scholar]
- 17.Washburn MP, Ulaszek R, Deciu C, Schieltz DM, Yates JR, 3rd. Analysis of quantitative proteomic data generated via multidimensional protein identification technology.Anal Chem 2002;74:1650–1657. [DOI] [PubMed] [Google Scholar]
- 18.Dreger M. Proteome analysis at the level of subcellular structures.Eur J Biochem 2003;270:589–599. [DOI] [PubMed] [Google Scholar]