Abstract
A fundamental aspect of proteomics is the analysis of post-translational modifications, of which phosphorylation is an important class. Numerous nonradioactivity-based methods have been described for high-sensitivity phosphorylation site mapping. The ABRF Proteomics Research Group has conducted a study to help determine how many laboratories are equipped to take on such projects, which methods they choose to apply, and how successful the laboratories are in implementing particular methodologies. The ABRF-PRG03 sample was distributed as a tryptic digest of a mixture of two proteins with two synthetic phosphopeptides added. Each sample contained 5 pmol of unphosphorylated protein digest, 1 pmol of each phosphopeptide from the same protein, and 200 fmol of a minor protein component. Study participants were challenged to identify the two proteins and the two phosphorylated peptides, and determine the site of phosphorylation in each peptide. Almost all respondents successfully identified the major protein component, whereas only 10% identified the minor protein component. Phosphorylation site analysis proved surprisingly difficult, with only 3 of the 54 laboratories correctly determining both sites of phosphorylation. Various strategies and instruments were applied to this task with mixed success; chromatographic separation of the peptides was clearly helpful, whereas enrichment by metal affinity chromatography met with surprisingly little success. We conclude that locating sites of phosphorylation remains a significant challenge at this level of sample abundance.
Keywords: proteomics, phosphorylation, mass spectrometry, IMAC, post-translational modification
Reversible phosphorylation of proteins on serine, threonine, and tyrosine residues is among the most important of the post-translational modifications, playing a critical role in regulating numerous cellular processes. Determining sites of phosphorylation is a formidable analytical challenge, not least because of low stoichiometries of phosphorylation; i.e., phosphorylated amino acids are generally less abundant than the corresponding nonphosphorylated residues. The dynamic and often transient nature of phosphorylation in vivo and the potential loss of phosphorylation due to phosphatase activity further complicate the analysis. Finally, phosphorylation can change the physical or chemical properties of peptides in ways that make them less amenable to biochemical analysis.
Some of the oldest and most successful strategies for phosphorylation site determination employ 32P-enriched inorganic phosphate to label phosphoproteins,1 but radioisotopic labeling is not always practical or desirable. An array of alternative methods has therefore been developed to map phosphorylation sites. Most such approaches involve two stages of analysis: proteolytic peptides are surveyed to detect phosphorylated peptides, followed by sequencing of the phosphopeptides to determine the specific modified site(s). The latter step is generally performed by Edman degradation or tandem mass spectrometry (MS/MS), whereas a variety of techniques can be used in the initial phosphopeptide screening. These techniques include enrichment by metal affinity chromatography2–4; the observation of characteristic mass shifts5; selective chemical modification6,7; or selective detection using the MS/MS techniques of neutral loss,8 precursor ion scanning,9 or mass mapping,10 to name a few.
The investigator who undertakes a phosphorylation site mapping project must choose which of an assortment of experimental techniques to apply to this challenging task, usually constrained by a limited supply of sample. A study carried out in 1997 provided participating laboratories with 500 pmol each of two phosphopeptides in an equimolar mixture with a nonphosphorylated protein.11 The success rates for determining the sites of phosphorylation were 75% and 35% for the two phosphopeptides, respectively. The last 5 years have seen substantial improvements in mass spectrometric instrumentation and an increase in the number of phosphorylation sites reported in the literature. It is not known, however, what techniques are most commonly or most successfully applied to phosphorylation site mapping, or what sample quantities and stoichiometries of phosphorylation represent practical limits for success.
The Proteomics Research Group (PRG) of the Association for Biomolecular Resource Facilities (ABRF) has undertaken a study to help answer these questions. A test sample was prepared consisting of tryptic digests of two proteins at the 5-pmol and 200-fmol level, respectively. Two synthetic phosphopeptides corresponding to amino acid sequences found in the more abundant protein were added at the 1-pmol level. The sample was distributed to participating laboratories, which were asked to identify the constituent proteins, detect the phosphorylated peptides, assign the sites of phosphorylation, and return a survey describing the experimental approaches taken. Specific objectives of this study included providing a mechanism for participating laboratories to evaluate their capabilities, providing an introduction to phosphorylation site mapping for laboratories new to this type of analysis, comparing strategies for phosphopeptide detection, and helping to establish realistic expectations for phosphorylation site mapping projects.
MATERIALS AND METHODS
Sample Preparation
Phosphopeptides P1 (SVpSDYEGK, monoisotopic mass = 963.37 Da) and P2 (THILLFLPKpSVSDYEGK, monoisotopic mass = 2026.03 Da) were synthesized and quantified by amino acid analysis. Bovine protein disulfide isomerase (PDI) and bovine serum albumin (BSA) were obtained from Sigma-Aldrich (Milwaukee, WI). Nanomole amounts of PDI and BSA were quantified by amino acid analysis and resolved by preparative SDS-PAGE with Coomassie blue staining. Protein-containing bands were excised and reduced with tris-carboxyethyl phosphine (TCEP), alkylated with iodoacetamide, and digested in situ with trypsin (modified sequencing grade, Promega (Madison, WI) as described previously12. The digest mixtures were combined with the synthetic phosphopeptides and divided into aliquots containing 5 pmol of PDI, 1 pmol of each phosphopeptide, and 200 fmol of BSA. The aliquots were dried by vacuum centrifugation and shipped dry at ambient temperature to requesting laboratories.
Survey of Participants
Study participants were provided with a survey to report their results and experimental methods. Questions pertained to instruments used; the operator’s experience; and sample preparation methods including enrichment, separation, or clean-up. The survey was divided into sections detailing the methods and results for protein identification, phosphopeptide detection, and phosphorylation site determination. Participants were invited to distinguish between positive and tentative protein identifications. Supporting data were requested for the phosphorylation site determinations to discourage guessing, since only a few potential sites exist in each phosphopeptide. Results were collected by a third party and identified only by participant-chosen codes to preserve anonymity.
Characterization of the Test Sample
The mixture of PDI, BSA, and the two phosphopeptides was analyzed by matrix-assisted laser desorption/ionization time-of-flight mass spectrometry (MALDI-TOF-MS) (Figure 1A). The many prominent peaks correspond to PDI; BSA is represented by only low abundance ions. Of the phosphopeptides, the longer (P2) can be observed as a small, but well-resolved peak at m/z 2027. A peak with the correct m/z of 964 for phosphopeptide P1 is present, but poorly resolved from the isotopic clusters of PDI tryptic peptides at m/z 962 and 967.
FIGURE 1.
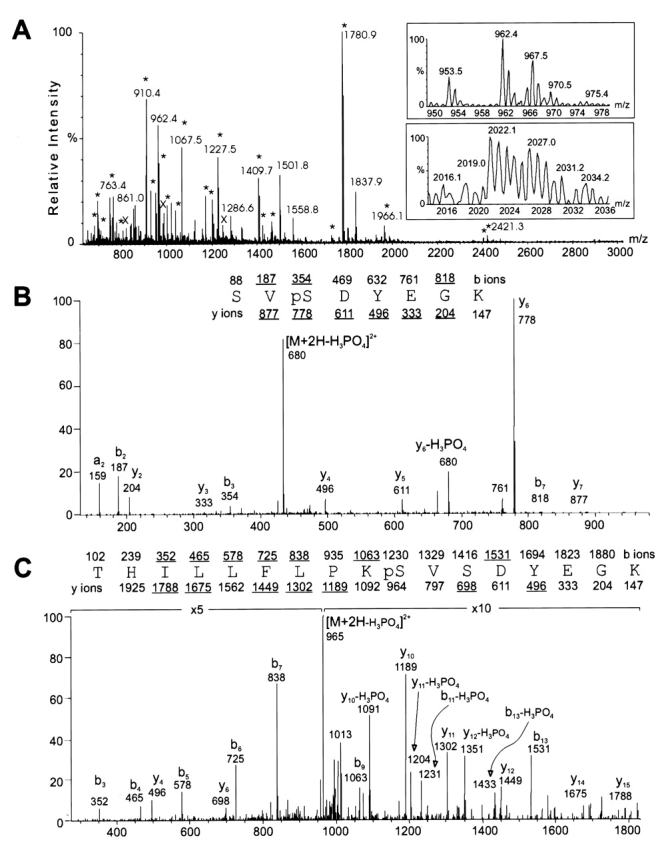
Mass spectrometric characterization of the test sample. A: MALDI-TOF analysis of 10% of the unfractionated mixture. Peaks corresponding to PDI (*) and BSA (x) are labeled. Regions containing the phosphopeptides are shown in the insets. B: Ion trap MS/MS of phosphopeptide P1, products of [M+2H]2+ = 482.7. The sequence and predicted b and y series fragments are listed; underlined masses were observed in the spectrum. C: MS/MS of phosphopeptide P2, [M+2H]2+ = 1013.9, labeled as in B.
Collision-induced dissociation of the two phosphopeptides was performed by liquid chromatography tandem mass spectrometry (LC-MS/MS) using an ion trap mass spectrometer; the resulting spectra are illustrated in Figure 1, panels B (P1) and C (P2). The sequence and phosphorylation site of P1 are readily assigned from the fragmentation pattern. The y ion series is complete, except for the y1 ion (the C-terminal lysine is indicated by the presence of b7). Three of the possible b series ions are also observed. Phosphorylation at the second serine is supported by the presence of the y6 and y7 ions, shifted higher by 80 Da from their predicted unphosphorylated masses. Likewise the b2 ion appears at m/z 187, rather than 267, which would be expected if the N-terminal serine were phosphorylated.
The CID spectrum of phosphopeptide P2 is more complex but also contains extended b and y ion series. There are four potential sites of phosphorylation in this peptide: the N-terminal threonine, two serines at residues 10 and 12, and a tyrosine at residue 14. The presence of b4 through b7 and y4 argues against phosphorylation of the threonine or tyrosine. Phosphorylation at the serine at residue 10 is supported by the observation of the unphosphorylated y6 ion and a peak at m/z 1231 corresponding to the neutral loss of phosphoric acid from the phosphorylated b11.
RESULTS
Study Overview
One hundred six laboratories requested a test sample for analysis. These included ABRF member laboratories as well as nonmembers, who were invited to participate so that a larger data set could be obtained. Fifty-four data sets (51%) were returned, which is a higher than average response compared with previous ABRF Research Group studies. Of these, 12 laboratories reported distinct results from more than one experimental approach, yielding a total of 67 analyses tabulated by the PRG.
Protein Identification
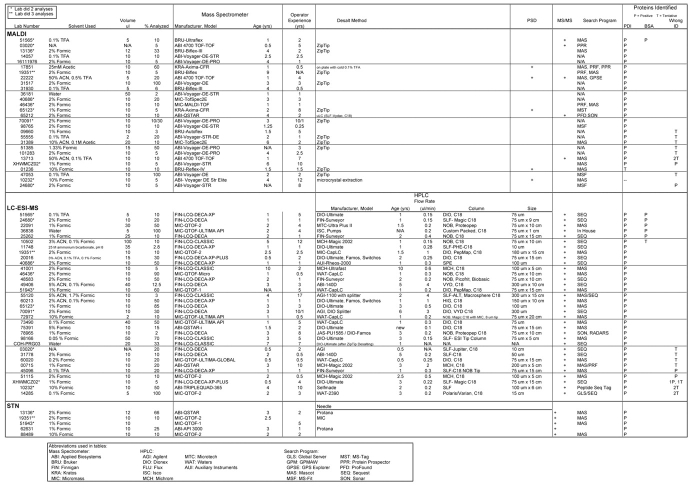
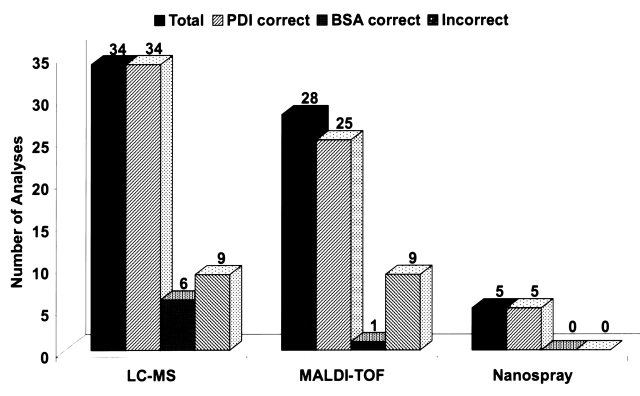
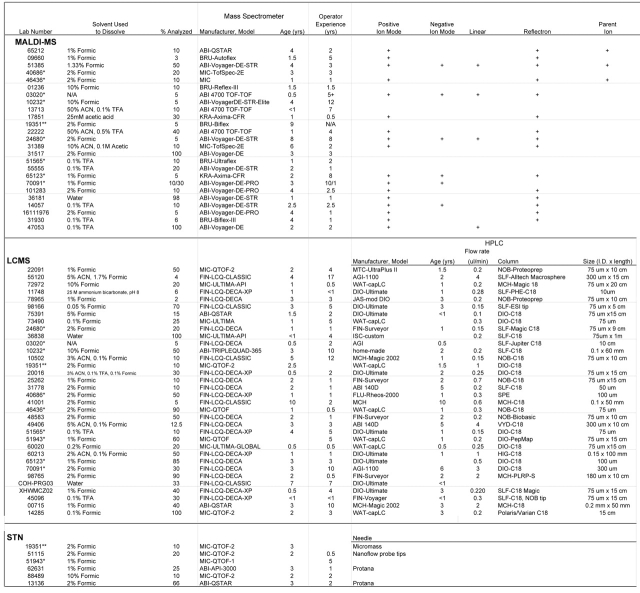
Ninety-six percent of the analyses identified PDI (Table 1 and Figure 2), which was the same percentage as last years’ study.12 However, only 10% identified BSA, whereas 49% participants identified it last year when it was present at the same amount but at a higher ratio relative to other proteins. There were also 5 positive wrong and 17 tentative wrong identifications returned for the minor component. While a variety of techniques were used to identify the PDI, 6 out of 7 of those who found the BSA used LC-MS.
TABLE 1.
Protein Identification
FIGURE 2.
Success rates for mass spectrometric approaches to protein identification. Five MALDI-TOF as well as all LC-MS and static nanospray analyses used MS/MS.
Phosphopeptide Identification
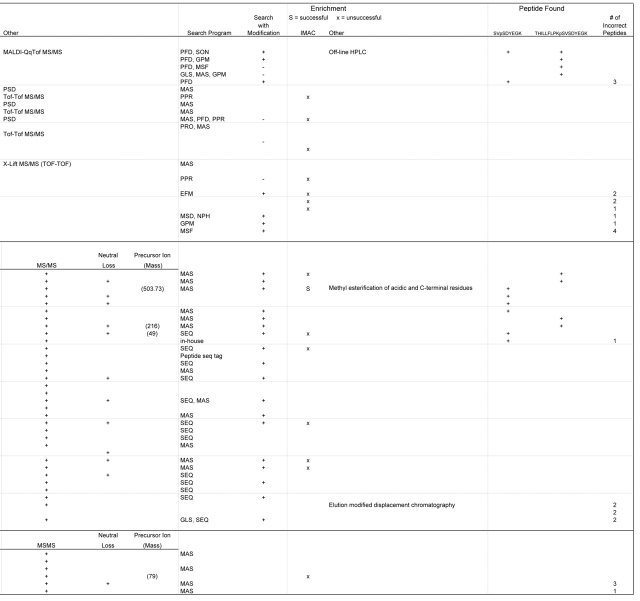
One laboratory identified the two intact phosphopeptides P1 and P2 correctly (Table 2) using MALDI-quadrupole (Qq)-TOF-MS after off-line fractionation of the mixture by high-performance liquid chromatography (HPLC). Four laboratories used MALDI-MS to identify only one of the phosphopeptides: three the long phosphopeptide (P2) and one the short phosphopeptide (P1). Two laboratories using LC-MS found two phosphopeptides, P1 and a truncated form of P2, both of which had the same sequence but differed in the site of phosphorylation (see below). Of the other laboratories using LC-MS, four found only the short phosphopeptide, and four found only the long phosphopeptide. None of the laboratories that used static nanospray was able to find either phosphopeptide. Thirteen analyses (20%) returned incorrect assignments of the phosphopeptides.
TABLE 2.
Phosphopeptide Identification
Phosphopeptide Enrichment
Of the types of enrichment used, immobilized metal affinity chromatography (IMAC) was the most common (Table 3). Of the 13 laboratories that used the IMAC enrichment method, only 1 succeeded in identifying any (one) phosphopeptide. This particular laboratory used methyl esterification of acidic and C-terminal residues followed by IMAC. The one laboratory that used off-line HPLC to fractionate the mixture was successful in identifying both phosphopeptides (see above). Another laboratory used elution modified displacement chromatography but was unsuccessful in phosphopeptide identification.
TABLE 3.
Phosphopeptide Enrichment
Phosphorylation Site Determination
A total of ten participating laboratories identified one or both phosphorylation sites (Table 4). One of these laboratories used MALDI-Qq-TOF-MS, while the others used LC-MS. Four labs identified only site S266 from the long phosphopeptide, THILLFLPKpSVSDYEGK, while three others identified only site S268 from the short phosphopeptide, SVpSDYEGK. Only one laboratory mapped both sites after identifying the two phosphopeptides as they were designed, while two others identified residue S268 of the short and residue S266 of a truncated version of the long phosphopeptide, pSVSDYEGK. Of the five remaining laboratories that identified one of the two phosphopeptides, four were unable to determine the site, and one laboratory did not attempt to do so.
TABLE 4.
Identification of Phosphorylation Sites
Sample Handling and Instrumentation
The solvents used to dissolve the sample and the percentage of sample used in the analyses varied (Tables 1 and 2). By far, the most common solvent used was formic acid (75% of all samples), ranging in concentration from 0.1 to 10% (v/v). In five samples, dilute formic acid was used in combination with either acetonitrile or other acids. One laboratory that found only the short peptide used water as the solvent, but site determination was not attempted (see Table 2). The percentage of sample used ranged from 2% to 100%, for those determining at least one peptide, and for those finding the actual site of phosphorylation, 2% to 70% of the sample was used.
Data on type of instrument, instrument age, and experience of the operators were also collected. There does not seem to be any clear-cut correlation of these parameters with the overall success of the analyses. The oldest instrument was 10 years old, but in the select list of those determining the phosphopeptide successfully, the oldest instrument was only 4 years old. The maximum experience of the operators overall, as well as in the group that met with success, was 17 years, but the majority had less than 5 years experience. It is probably more notable that the experience varied as did the instrument age and that no single instrument manufacturer was overly represented. Instead, the type of instrument most often used correlated with some type of LC-MS/MS. Of those participants successful in locating the actual site of phosphorylation, all but one used LC-MS/MS, and this lab performed off-line HPLC prior to MS/MS. This could be indicative simply of LC-MS/MS perhaps being more appropriate for this type of sample; instrument age and operator experience does not appear to add a great deal to the equation for success.
DISCUSSION
The protein identification aspect of this study extends the PRG 2002 study on the identification of proteins in mixtures, and the findings are generally consistent. Virtually all participating laboratories in both studies identified PDI at the 5-pmol level, whereas BSA at the 200-fmol level was more problematic. In fact, a higher percentage of participants in the ABRF-PRG02 study successfully identified BSA than in the current study. This apparent discrepancy could be explained by the emphasis on phosphorylation site analysis in ABRF-PRG03, but more likely by the greater difference in abundance between the most abundant proteins and BSA in the mixtures (5 pmol PDI and 200 fmol BSA this year, vs. 2 pmol other proteins and 200 fmol BSA previously). The number of wrong identifications of the minor protein component was significant. This may to some extent result from the instructions provided that indicated the presence of two proteins, resulting in a natural impulse to find two proteins, even in the absence of compelling data. All but one of the laboratories that did identify BSA employed LC-MS/MS, suggesting, not surprisingly, that the sensitivity and sequence-specificity possible with MS/MS is more suitable than MALDI-MS for identifying components of widely differing abundance in protein mixtures.
Phosphopeptide detection, which necessarily precedes phosphorylation site assignment, turned out to be the crux of the study. The test sample was intended to be challenging, reflecting “real world” features such as substoichiometric degrees of phosphorylation, incomplete proteolysis of a modified peptide, and the presence of a low-level contaminating protein. The low rate of success in identifying the two phosphopeptides was nevertheless surprising, particularly in light of the proliferation of phosphorylation site mapping articles in the scientific literature. Some of this difficulty could be due to the short phosphopeptide, SVpSDYEGK, being very close in mass to other unphosphorylated peptides in an unfractionated mixture. Indeed, the only analysis that identified this phosphopeptide by MALDI-TOF-MS of the unfractionated sample did so on the basis of the erroneous assignment of an observed mass to the doubly phosphorylated version of this peptide, which was not present in the sample (data not shown).
The longer phosphopeptide, THILLFLPKpSVSDYEGK, posed a different and unexpected problem. Peptide P2 was designed to represent a phosphopeptide resulting from incomplete cleavage at K265 and was based on the reasonable expectation that a phosphorylated residue adjacent to Lys would inhibit tryptic cleavage at that site. While analysis of the sample mixture distributed to one lab showed P2 intact (Figure 1C), the returned data showed that some cleavage did occur at that site during processing and/or participant handling in at least two of the samples, resulting in the truncated form, pSVSDYEGK. The samples were shipped dry at ambient temperature and should have been stable. However, depending on what solvent the participating laboratory used to reconstitute the samples and the conditions under which the sample was stored, it is possible that residual trypsin may have been reactivated sufficiently to cause the observed cleavage at K265. This would compromise the yield of the longer peptide and confuse the identification of the phosphorylated site in the smaller peptide. The labeled cleavage product would share the same mass and sequence but have a different phosphorylation site, S266 instead of S268. Regardless of how this may have occurred, it was still indicative of a “real world” sample, perhaps even more so than anticipated.
Another factor in finding the phosphopeptides was the use of enrichment techniques. The data returned was quite surprising in view of the many articles published on the various forms of this technique. For the IMAC enrichment, a variety of metal ions were used. Only one laboratory using this technique (lab #72972) had any success, and even here it was somewhat unclear with the data returned if it was the IMAC procedure that allowed the identification of the short peptide or the methyl ester derivatization, or a combination of both (see Table 3). Overall, enrichment did not seem to enhance the ability to find the phosphopeptides. In the 1997 phosphorylation site mapping study,11 enrichment was not a critical issue, as the phosphorylated peptides were present at the same levels as the nonphosphorylated peptides. This met with a much higher success rate, clearly emphasizing the increased difficulty experienced when phosphorylation is substoichiometric.
Although there are many literature examples of the application of IMAC to the isolation of phosphopeptides, it is widely accepted that this technique is not universally successful. It is possible that the two phosphopeptides in this study (for reasons not apparent) were unsuited for IMAC enrichment using manufacturers’ (or similar) protocols. Esterification of carboxyls seemed to aid enrichment in one case, but more analyses of this type would be needed to ascertain if this approach is the preferred method generally. Differences in expertise in phosphorylation site analysis might also account for some of the divergence in results. As previously discussed, it is difficult to assess the influence of expertise, but it is clear that many of the participants were experienced mass spectrometrists who nevertheless failed to pick out the phosphopeptides.
The results of this study clearly suggest that phosphorylation site identification remains a difficult undertaking. It must be remembered that the literature is largely composed of reports of successful experiments, while negative results tend to go unpublished. Furthermore, since the actual number of phosphorylation sites on any given protein is not generally known in advance, it is possible that many published studies overestimate their success. Phosphorylation events rarely are 100% complete at any one site. This makes it difficult to accurately quantify the number of labeled sites, and analysts are faced with not knowing how many sites they are expected to find. It is important that researchers appreciate this limitation. The use of radioactivity plays a vital role in addressing this problem, but that approach is not always feasible. Whatever the case, the physiological importance of protein phosphorylation guarantees that instrumentation and techniques for phosphorylation site mapping will continue to be areas of intense development, especially for nonradioactive samples.
CONCLUSIONS
The majority of participants (96%) in both ABRF-PRG02 and ABRF-PRG03 identified the major protein, PDI, with fewer identifying the minor protein, BSA, in this year’s study. However, a large number of participants in this study were unable to identify and characterize the phosphopeptides. Specific characteristics of the sample may have posed additional difficulties in this challenging study; for example, the occlusion of the shorter peptide by nonphosphorylated peptides in the mass spectra of the unfractionated mixture or the decomposition of the longer peptide during sample handling.
Perhaps the most compelling conclusion is that phosphorylation site mapping is still an extremely challenging task. In addition to bringing home the challenges of phosphopeptide detection, this study has raised several important issues. The relative lack of success using IMAC enrichment suggests that optimized and well-characterized procedures for this approach still are lacking or not sufficiently disseminated among the scientific community. False positive assignments of the component proteins and phosphopeptides suggest that explicit criteria for reliable identifications still are needed. A solution to the problem of dynamic range, that is, the analysis of minor components in mixtures, is needed as a matter of urgency as proteomics of blood plasma and other complex samples grows in importance. Such developments need to be instrument-independent to have the widest application. To this end, advances in the chemistry of selective enrichment on the femtomole scale is likely to be the most cost-effective way of achieving this goal.
Acknowledgments
The Proteomics Research Group would like to thank Nick Pileggi of Columbia University for synthesizing the phosphopeptides, Myron Crawford of Yale University for amino acid analysis, Lora Goodridge of Columbia University for administrative aspects of the survey, Nicole DiFlorio and Tom Beer of the Wistar Institute for preparation and characterization of the test sample, and Yun Lu of the NYU Protein Analysis Facility for MALDI-TOF analysis of the sample. The advice and guidance of ABRF executive board members William Lane and Laurey Steinke were valuable and much appreciated.
REFERENCES
- 1.Wetternhall RE, Aebersold RH, Hood LE. Solid-phase sequencing of 32P-labeled phosphopeptides at picomole and subpicomole levels. Methods Enzymol 1991; 201:186–199. [DOI] [PubMed] [Google Scholar]
- 2.Posewitz M, Tempst P. Immobilized gallium (II) affinity chromatography of phosphopeptides. Anal Chem 1999;71:2883–2892. [DOI] [PubMed] [Google Scholar]
- 3.Ficarro S, McCleland M, Stukenberg P, et al. Phosphoproteome analysis by mass spectrometry and its application to saccharomyces cerevisiae. Nature Biotechnol 2002;20:301–305. [DOI] [PubMed] [Google Scholar]
- 4.Köcher, T, Allmaier, G, Matthias Wilm, M. Nanoelectrospray-based detection and sequencing of substoichiometric amounts of phosphopeptides in complex mixtures. J Mass Spectrom 2003;38:131–137. [DOI] [PubMed] [Google Scholar]
- 5.Molloy MP, Andrews PC. Phosphopeptide derivatization signatures to identify serine and threonine phosphorylated peptides by mass spectrometry. Anal Chem 2001;73:5387–5394. [DOI] [PubMed] [Google Scholar]
- 6.Adamczyk M, Gebler JC, Wu J. Selective analysis of phosphopeptides within a protein mixture by chemical modification, reversible biotinylation and mass spectrometry. Rapid Commun in Mass Spectrom 2001;15:1481–1488. [DOI] [PubMed] [Google Scholar]
- 7.Goshe M, Conrads T, Panisko E, Angell N, Veenstra T, Smith R. Phosphoprotein isotope-coded affinity tag approach for isolating and quantitating phosphopeptides in proteome-wide analyses. Anal Chem 2001; 73:2578–2586. [DOI] [PubMed] [Google Scholar]
- 8.Annan R, Carr S. Phosphopeptide analysis by matrix-assisted laser desorption time-of-flight mass spectrometry. Anal Chem 1996;68:3413–3421. [DOI] [PubMed] [Google Scholar]
- 9.Steen H, Mann M. A new derivatization strategy for the analysis of phosphopeptides by precursor ion scanning in positive ion mode. J Am Soc Mass Spectrom 2002;13:996–1003. [DOI] [PubMed] [Google Scholar]
- 10.Liao P, Leykam J, Andrews P, Gage D, and Allison J. An approach to locate phosphorylation sites in a phosphoprotein: Mass mapping by combining specific enzymatic degradation with matrix-assisted laser desorption/ionization mass spectrometry. Anal Biochem 1994;219:9–20. [DOI] [PubMed] [Google Scholar]
- 11.Swiderek K, Gharahdaghi F, Ericsson L, et al. The 1997 ABRF Mass Spectrometry Committee Collaborative Study: Identification of Phosphopeptides in a Tryptic Digest of Apomyoglobin ABRF 1997, Baltimore, MD.
- 12.Arnott, DP, Gawinowicz, M, Grant, RA, et al. Proteomics in mixtures: study results of ABRF-PRG02. J Biomol Tech 2002;13:179–186. [PMC free article] [PubMed] [Google Scholar]


