Abstract
Protein and DNA microarrays have become a standard tool in proteomics/genomics research. In order to guarantee fast and reproducible hybridization results, the diffusion limit must be overcome. Surface acoustic wave (SAW) micro-agitation chips efficiently agitate the smallest sample volumes (down to 10 μL and below) without introducing any dead volume. The advantages are reduced reaction time, increased signal-to-noise ratio, improved homogeneity across the microarray, and better slide-to-slide reproducibility. The SAW micromixer chips are the heart of the Advalytix ArrayBooster, which is compatible with all microarrays based on the microscope slide format.
Keywords: biochip, microagitation, microarray, hybridization, ArrayBooster
For microarray production, large sets of genes are arrayed on small surface areas using high throughput robotic platforms. In most cases, the substrates for DNA microarrays are conventional microscope slides with dimensions of about 75 × 25 mm. Up to several thousand spots of oligonucleotides or cDNA1 probes with known identity cover the slide in a checkerboard pattern. In gene expression profiling assays, the ratio of binding of complementary nucleic acids from test and control samples is determined. This allows a parallel, semiquantitative analysis of transcription levels in a single experiment. In a standard microarray experiment the sample solution is sandwiched between the DNA microarray and a cover slip, forming a capillary gap of about 20–100 μm in thickness and several centimetres in width. Especially in case of low concentrated cDNA molecules representing the low expressed genes, the immediate vicinity of the corresponding probe spot will be quickly depleted. Without active agitation. diffusion is the only mechanism for the DNA strands to be transported to their complementary spots. However, on the scale of several centimeters, diffusion is a notoriously slow process for molecules that are the size of the DNA strands discussed here. It has been estimated that it would require weeks for the hybridization reaction to reach equilibrium.2,3 Here, we would like to report on a novel approach of agitation mechanism using a surface acoustic wave (SAW)-based technology to increase the results in standard microarray experiments.
MATERIALS AND METHODS
Design and Production of Micromixer Cards (AdvaCards)
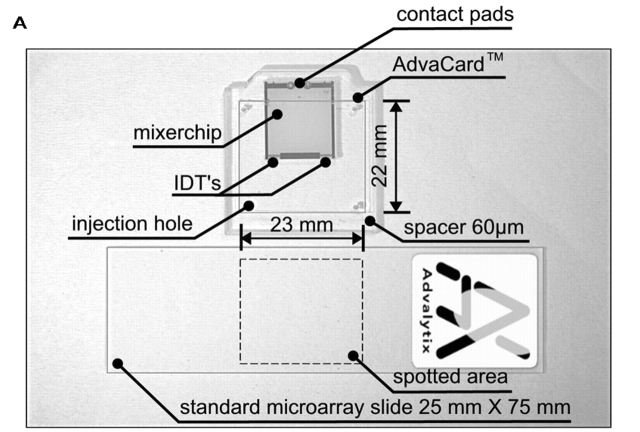
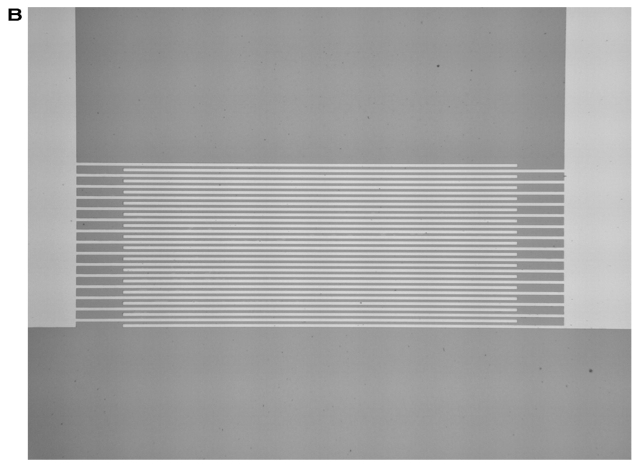
Figure 1A shows a 12 × 15.5-mm piezoelectric LiNbO3 agitation chip. This chip is glued into a glass carrier (AdvaCard). The reusable AdvaCards are offered in three formats with usable areas of 22 × 23 mm, 40 × 23 mm, and 70 × 23 mm, and are replacing cover slips in microarray hybridizations. To ensure optimal agitation, AdvaCards contain one, two or three chips. In the hybridization chamber, RF-power is applied to the chips by built-in gold spring-contact pins. The chip contains two interdigital transducers (IDTs) with 20 finger pairs each.4 Application of a high-frequency signal to such an IDT results in the generation of an intense, nearly monochromatic SAW. The SAW then propagates along the surface of the piezoelectric substrate. In fact, the IDTs used here operate bidirectionally, i.e., a SAW is launched in both directions perpendicular to the fingers. One of the IDTs has an aperture of 2 mm and is shown in Figure 1B. The electrode spacing is 12 μm, generating a SAW with a wavelength of 24 μm at a resonance frequency of 157 MHz. The other IDTs on the agitation chip have an aperture of 2 mm and operate at 146 MHz, resulting in a SAW of 25.6 μm wavelength. The SAW is efficiently absorbed by the fluid on top and induces an internal streaming to it. The user can define various agitation patterns by alternately adressing the IDTs with the two different resonance frequencies. Fabrication of the chips starts with the photolithographic definition of the electrode structures on 4-inch LiNbO3 wafers. Here, we used an image reversal photoresist which was directly exposed to a mask aligner. A 300-nm gold metallization, which was followed by a lift-off process, defined the electrodes. Titanium was used to optimize the adhesion of the gold to the chip’s surface. The metallized wafers were then coated with an 800-nm thick SiO2 layer to provide the chips with a biocompatible and chemically stable surface. A second photolithography step defined the contact pads, where the SiO2 layer was removed by chemical etching in hydrofluoric acid. The agitation chip was integrated into a glass card (AdvaCard) in order to agitate an area larger than the chip’s size. The settings in the ArrayBooster software were frequencies of 146 MHz and 157 MHz alternating every 10 sec with an on-time of 3 sec and an off-time of 7 sec, respectively. These settings ensure a continous agitation of the hybridization solution and enhance the probability for target molecules to bind to their specific probe during an idle period without disturbance by flow effects.
FIGURE 1.
A: LiNbO3 mixer chip with two IDT electrodes glued in AdvaCard. B: Enlargement of one IDT shown in A. The aperture is 2000 μm; the SAW propagation direction is perpendicular to the fingers.
RNA isolation
Total RNA was isolated from kidney and liver tissue of adult female Wistar-Han rats, provided by Charles River Laboratories (Sulzfeld, Germany) using the RNeasy Maxi Kit Protocol including the on-column DNase digestion (Qiagen, Hilden, Germany).
Reverse Transcription and cDNA Labeling
The Label Star Array Kit (Qiagen) was used according to the enclosed manual. During reverse transcription, the tissue-specific total RNA is converted into first-strand cDNA using oligo dT-primers. During this process, the cDNA is directly labeled with cyanine-3-dCTP (Perkin Elmer Life Sciences, Freiburg, Germany) for rat kidney and cyanine-5-dCTP for rat liver cDNA. For each reaction, 50 μg of total RNA were used. The resulting cDNA products are sufficient for two hybridization reactions.
Microarray Production
Fifty rat-specific oligonucleotides (Metabion GmbH, Martinsried, Germany) were designed according to NCBI GenBank sequences with ArrayDesigner 2 (Premierbiosoft, Palo Alto, CA) and spotted onto QMT Epoxy-coated glass slides (Quantifoil, Jena, Germany) with the Gene Machines OmniGrid contact printer using a single SMP3 split pin (Telechem, Sunnyvale, CA) to avoid a variation of spot quality and morphology because of different pins. The array consists of four identical subarrays with 100 spots each. Each gene on these subarrays is represented by a 50 mer oligonucleotide spotted as duplicate covering an overall area of 10 × 10 mm. Post-spotting slide-processing was performed according to the provided Quantifoil protocol. Slides were incubated for 30 min in a humidity chamber to immobilize the spotted oligonucleotides followed by subsequent washing steps at room temperature for 5 min in 0.1% TritonX-100 (Sigma, Taufkirchen, Germany), 2 × 2 min in 0.004% HCl, 10 min in 100 mM KCl solution, and a final washing step in ddH2O for 1 min. Slides can be stored up to 3 months at room temperature after immobilization. Prior to hybridization, the slides were blocked for 30 min in a solution of 4X SSC/0,1% (w/v) sodium dodecyl sulfate (SDS)/1% (w/v) bovine serum albumine (Sigma) at 42°C followed by five washing steps with ddH2O at room temperature. The slides were dried in a nitrogen stream and used immediately after blocking.
Hybridization and Washing
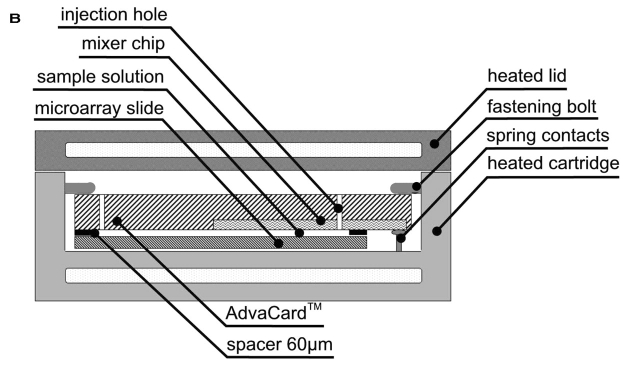
Hybridization was carried out in the commercially available Advalytix ArrayBooster, a hybridization station with integrated microagitation for the use with standard microarray slides. The sample solution is sandwiched between the spotted glass slide and the AdvaCard as shown in Figure 2. The AdvaCard contains a spacer of 60 μm in height. The hybridization solution is drawn in by capillary action. Vent holes prevent bubble formation while loading the hybridization solution with a standard pipette tip. Upon the start of the mixing program, an RF voltage is fed to the IDTs, resulting in a quasichaotic streaming in the solution. The instrument’s software allows the user to assign specific streaming patterns and temperatures to each experiment. Hybridization was performed under stringent conditions in a buffer containing 50% formamide, 6X SSC, 0.5% (w/v) SDS, and 5X Denhardt’s solution (Sigma) at 42°C for 16 h after a denaturation step for 3 min at 95°C. The liquid volume under a cover glass was approximately 20 μL, resulting in a calculative fluid layer thickness of about 25 μm. The liquid volumes in the ArrayBooster experiments using AdvaCards with an active area of 22 × 23 mm and 60-μm spacers were about 40 μL. The volume can be adjusted by choosing the appropriate AdvaCard and the individually preferred spacer thickness. Hybridization under cover glasses were performed in self-designed hybridization chambers using a 42°C water bath. To ensure similar geometries, we used 22 × 22-mm cover glasses (Sigma) and sealed them with Fixogum glue (Marabu, Tamm, Germany) to avoid evaporation of the solution. Subsequent washing steps were performed after overnight hybridization at 42°C using 2X SSC /0.1% Tween 20, 1X SSC and 0.2X SSC for 5 min. After washing, the slides were blown dry in a nitrogen stream and stored in a cool dark place until scanning.
FIGURE 2.
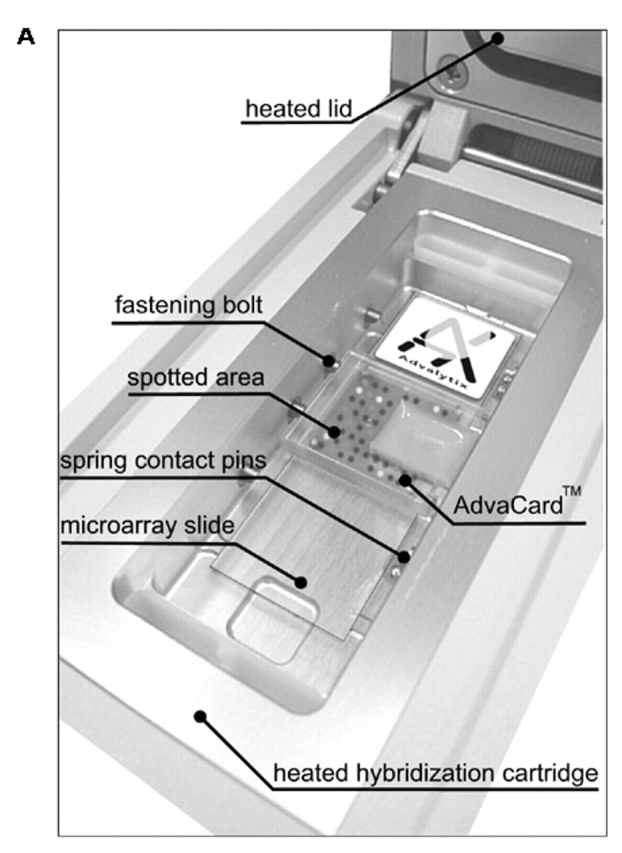
A: One of four ArrayBooster hybridization cartridges with a microarray slide covered by the AdvaCard with one agitation chip. B: Cross section of Figure 2A. The microarray slide is placed in the hybridization cartridge and is covered by the Advacard. The Advacard is fixed by built-in fastening bolts. RF voltage is applied to the IDTs by spring contact pins.
Image analysis
For microarray scanning and image analysis we used the GenePix4000B Scanner and the GenePix Pro 4.0 Software (Axon Instruments, Union City, CA). Settings: Laser Power 100%, PMT Gain 600.
RESULTS
We chose rat-specific microarrays representing the main model system for drug discovery and toxicology in humans5. Fifty-mer rat liver- and kidney-specific oligonucleotides ensure high specificity and a low rate of cross reactions.6 Similar systems are widely used in research facilities and are available commercially as catalog arrays. Standard microarray experiments are performed using cover slips or similar geometries without the possibility of agitating the sample solution. To overcome the diffusion limits of the DNA-molecules in the solution it is necessary to use active agitation. Otherwise, the majority of target molecules will not reach and interact with their spotted probe in a finite time scale, which will directly affect the signal intensities on a microarray. All experiments were carried out using the same amount of target molecules. This leads to different concentrations of target molecules in the hybridization solution depending on the required volume. The concentration of target molecules in the cover glass experiments was 2-fold higher than in the microagitated experiments.
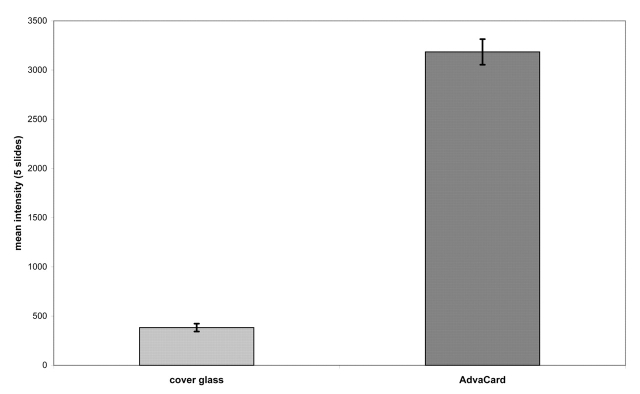
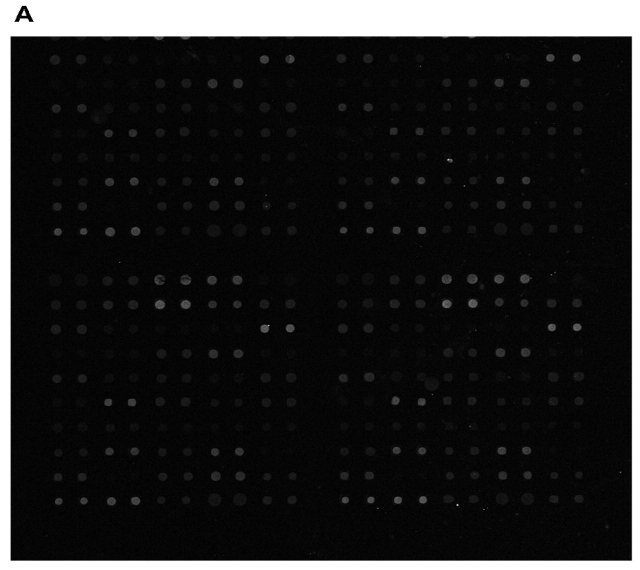
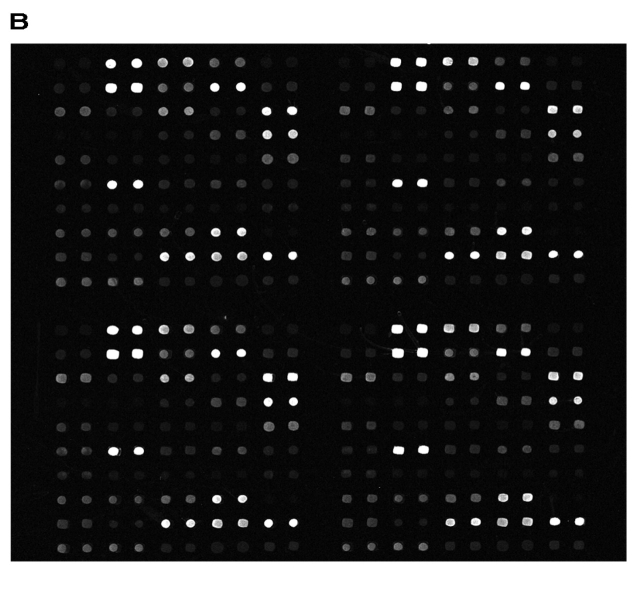
Hybridizations using cover glasses in conjunction with incubation in a water bath were defined as reference experiments. Agitation of the hybridization solution was carried out by using the above mentioned ArrayBooster protocol. Five cover-glass reference experiments and five experiments using micromixer cards in the ArrayBooster were performed for statistical reasons. When we compared the background-corrected signal intensities of the cover glass experiments with the ArrayBooster processed slides, we detected a nearly 6-fold increase by the latter (Figure 3).
FIGURE 3.
Mean signal intensities of five slides. The light gray bar shows experimental data of five cover glass experiments; the dark gray bar shows signal intensities of five ArrayBooster processed slides. Experimental time was 16 h.
Figure 3 shows two examples of hybridized slides. The background intensities do not differ between the two methods. In the case of the cover glass experiments, however, it was necessary to perform eight experiments because three slides showed an extreme gradient over the array resulting from different fluid layer thickness or evaporation effects.
Regarding the gradient problems, the variation coefficient of the two different methods was analyzed. Highly reproducible slides show an on-slide variance of about 10%.7 Figure 4 shows the variation coefficient of the cover glass experiments compared with the AdvaCard experiments in the ArrayBooster. In addition to higher signal intensities, the microagitation results in higher on-slide reproducibility (CV 8.5%). The variation coefficient for the cover glass experiments was determined after manually sorting out three slides exhibiting large gradients. The remaining five slides used for signal intensity analysis showed 16.5% CV. Taken together, the analysis of all eight cover glass experiments would result in a CV as high as about 45%.
FIGURE 4.
Comparison of cyanine-5 (rat kidney cDNA) signal intensities of cover glass (A) to ArrayBooster experiments (B) shows increase of mean signal intensity by a factor of 6. Background values are identical.
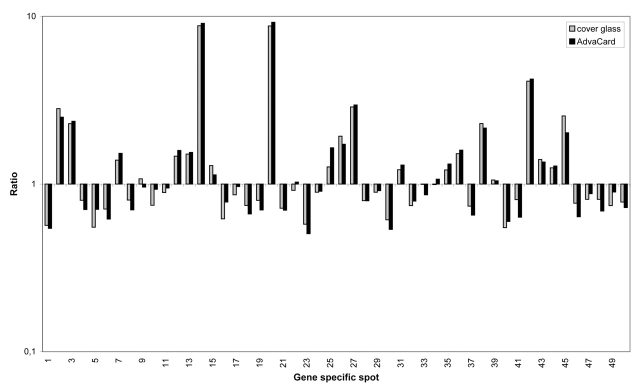
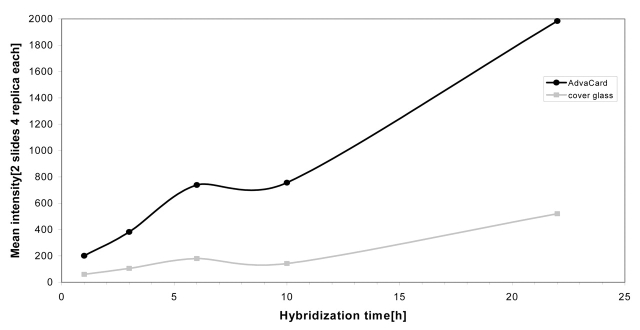
To ensure that signal amplification had no effect on gene expression patterns, we carried out two co-hybridization experiments under cover glasses and two experiments using AdvaCards in the ArrayBooster. Ratios for cyanine-5-labeled cDNA from rat kidney versus cyanine-3-labeled rat liver cDNA show no significant change between the two methods (Figure 5). In addition to signal enhancement, agitation allows shortening of incubation times by a factor of 4 in microarray experiments without loss of signal intensities. To prove this additional benefit, we carried out time series experiments from 1 to 22 h incubation time (Figure 6). The experimental conditions were similar to the ones above. However, we only used 10 μg of cyanine-5-labeled rat liver cDNA per slide. This resulted in lower overall signal intensities. Each time point experiment was done in duplicate, comparing results under 22 × 22-mm cover glasses (probe volume 40 μL) to hybridizations in the ArrayBooster with standard agitation protocol (probe volume 40 μL).
FIGURE 5.
Gene expression ratios of cyanine-5-labeled rat kidney cDNA vs. cyanine-3-labeled rat liver cDNA comparing cover glass to AdvaCard hybridization with agitation. There is no significant change in the gene expression pattern.
FIGURE 6.
Reaction kinetics comparing cover glass (light gray) to AdvaCard experiments with agitation (black). Mean signal intensities of two slides with four replica each are background corrected.
To ensure comparability between the 20 experiments, we prepared 10-μL aliquots of the pooled labeling reactions which were filled up to the required volume with formamide/SSC hybridization buffer. The microagitated slides show higher overall signal intensities as compared with the cover glass experiments because of overcoming the diffusion limits. Furthermore, the increase in signal intensity is faster than without agitation so that saturation of the spots will be reached earlier. For the ArrayBooster experiments, saturation was reached after 22 h. Based on diffusion kinetics, it is estimated that both lines will cross after about a week. The bump in the intensity after about 6 h incubation was also observed in further experiments using the same model system and standard oligo-to-oligo hybridizations. These results will be discussed in future publications.
SUMMARY
In this study standard cover glass hybridization protocols were compared with the new approach of agitating hybridization solution in microarray experiments. By inducing a quasichaotic streaming pattern in the fluid layer on a microarray, it is possible to reach a signal amplification by a factor of 6, reduce time by a factor of 4, and improve on-slide homogeneity.
REFERENCES
- 1.Hegde P, Qi R, Abernathy K, et al. A concise guide to cDNA microarray analysis. Biotechniques 2000;29(3): 548–550, 552–554, 556 [DOI] [PubMed] [Google Scholar]
- 2.Chan V, Graves DJ, Mc Kenzie SE. The biophysics of DNA hybridization with immobilized oligonucleotide probes. Biophys J 1995;69(6):2243–2255 [DOI] [PMC free article] [PubMed] [Google Scholar]
- 3.Allison SA, Northrup SH, McCammon JA. Simulation of biomolecular diffusion and complex formation. Biophys J 1986;49(1):167–175 [DOI] [PMC free article] [PubMed] [Google Scholar]
- 4.Wixforth A, Gauer C, Scriba J, Wassermeier M, Kirchner R. Flat fluidics: A new route toward programmable biochips. In SPIE Proceedings: Microelectronics, Optoelectronics, & Micromachining 2003:in press.
- 5.Bulera SJ, Eddy SM, Ferguson E, et al. RNA expression in the early characterization of hepatotoxicants in Wistar rats by high-density DNA microarrays. Hepatology 2001; 33(5):1239–1258. [DOI] [PubMed] [Google Scholar]
- 6.Kane MD, Jatkoe TA, Stumpf CR, Lu J, Thomas JD, Madore SJ. Assessment of the sensitivity and specificity of oligonucleotide (50mer) microarrays. Nucleic Acids Res 2000;28(22):4552–4557 [DOI] [PMC free article] [PubMed] [Google Scholar]
- 7.Diehl F, Grahlmann S, Beier M, Hoheisel JD. Manufacturing DNA microarrays of high spot homogeneity and reduced background signal. Nucleic Acids Res. 2001; 29(7):e38. [DOI] [PMC free article] [PubMed] [Google Scholar]


