

Abstract
The type 1 HIV presents a conical capsid formed by ~1500 units of the capsid protein, CA. Homodimer-ization of CA via its C-terminal domain, CA-C, constitutes a key step in virion assembly. CA-C dimerization is largely mediated by reciprocal interactions between residues of its second α-helix. Here, we show that an N-terminal-acetylated and C-terminal–amidated peptide, CAC1, comprising the sequence of the CA-C dimerization helix plus three flanking residues at each side, is able to form a complex with the entire CA-C domain. Thermal denaturation measurements followed by circular dichroism (CD), NMR, and size-exclusion chromatography provided evidence of the interaction between CAC1 and CA-C. The apparent dissociation constant of the heterocomplex formed by CA-C and CAC1 was determined by several biophysical techniques, namely, fluorescence (using an anthraniloyl-labeled peptide), affinity chromatography, and isothermal titration calorimetry. The three techniques yielded similar values for the apparent dissociation constant, in the order of 50 μM. This apparent dissociation constant was only five times higher than was the dissociation constant of both CA-C and the intact capsid protein homodimers (10 μM).
Keywords: peptide recognition, binding, calorimetry, fluorescence
During the assembly stage of HIV, thousands of copies of the viral Gag protein associate at the cell membrane and bud to form the immature noninfectious virion. Gag is cleaved by the viral PR; this process liberates, among other proteins, the capsid protein, CA, which forms the internal protein shell of the mature virus. The mature conical capsid of the type 1 HIV (HIV-1) is composed, among other proteins, by ~1500 copies of CA. This electron-dense cone-shaped structure encapsidates the viral RNA, the nucleocapsid proteins, and other key enzymes. In vitro, CA spontaneously assembles into helical tubes and cones resembling the viral capsids (Gross et al. 1997, 1998; Ganser et al. 1999; Li et al. 2000). Several studies have shown that proper capsid assembly is critical for viral infectivity (von Schwedler et al. 1998; Tang et al. 2001; Forshey et al. 2002). Inhibition of CA assembly by mutations has a lethal effect (Gross et al. 1997; von Schwedler et al. 1998; Tang et al. 2001), and the alteration of capsid stability reduces virus replication (Forshey et al. 2002). These results support a potential antiviral strategy for HIV-1, based on the use of compounds able to interfere with the CA–CA recognition and then capsid assembly. Those inhibitors could be either small organic compounds or large “interfacial” inhibitors that mimic most of the interacting interface (Babé et al. 1991; Zhang et al. 1991; Garg et al. 1999). The design of either type of inhibitor requires not only a detailed structural knowledge of CA but also a thermodynamic characterization of the interactions involved in the CA–CA interfaces. The designs of inhibitors based on the oligomerization properties of several HIV proteins have been attempted in the case of integrase (IN) by using peptides (Maroun et al. 2001), and with the synthesis of small organic molecules in the case of the N-terminal domain of CA (Tang et al. 2003). In addition to the benefits provided by the design of new drugs against human immunodeficiency virus, these new molecules might shed light into the field of molecular recognition. From a theoretical and also an experimental point of view, understanding how molecular recognition occurs presents a formidable and interesting challenge (Muller-Dethlefts and Hozba 2000). The complexity of interactions between proteins and flexible target molecules is determined, in most of the cases, by the flexibility at the binding sites and the structural rearrangements occurring upon binding in both molecules (Davis and Teague 1999; Verkhiver et al. 2002), but it is not known yet to which extent in each of the molecules involved.
The CA protein of HIV-1 is formed by two independent domains separated by a flexible linker. CA is capable of different modes of association (Rosé et al. 1992; Dorfman et al. 1994; Misselwitz et al. 1995), and in fact, there is a wide body of evidence that dimerization through the C-terminal domain, CA-C, is an important driving force in virus assembly (Wang and Barklis 1993; Borsetti et al. 1998). High-resolution structures of both CA domains have been obtained (Gamble et al. 1996, 1997; Gitti et al. 1996). CA-C is a dimer, both in solution and in the crystal form (Gamble et al. 1997); furthermore, the dimerization constant of CA-C is nearly the same (10 ± 3 μM) of that of the intact CA protein (18 ± 1 μM; Gamble et al. 1997). Each monomer (residues 147–231 of the intact CA protein) is composed of a 310 helix followed by an extended strand and four α-helices connected by short loops (Gamble et al. 1997). The dimerization interface is largely formed by the mutual docking of α-helix 2 from each monomer (residues Ser178–Val191; Fig. 1 ▶). The folding and association pathway of CA-C involves the presence of a monomeric intermediate that rearranges and dimerizes to yield the native dimer (Mateu 2002). The energetic role of each side chain at the dimerization interface has also been determined: the side chain of Trp184 (Gamble et al. 1997; del Álamo et al. 2003) and those of Ile150, Leu151, Arg154, Leu172, Glu175, Val181, Met185, and Leu189 are key for CA-C dimerization (del Álamo et al. 2003). The CA-C also has a region of 20 amino acids called the MHR, which is highly conserved among retroviruses. This region is hydrogen-bonded to the α-helix 2 (Gamble et al. 1997), and the MHR residues are involved in the association process, affecting the stability of the CA-C monomer (del Álamo et al. 2003).
Figure 1.

Structure of CA-C dimer. X-ray structure of CA-C, showing the dimeric structure of the domain. The monomers are depicted in the same color, and α-helix 2 plus the flanking residues used in the design of CAC1 in each monomer are highlighted in yellow. The side chain of Trp184 is indicated. The figure was produced with PyMOL (DeLano 2002) and from the Protein Data Bank file for CA-C (code accession number 1A43).
The structural and energetic knowledge acquired on the CA-C dimerization interface can be used in the rational design of an interfacial inhibitor of CA-C dimerization, based on peptides. The successful design of such inhibitor could provide hints into the molecular basis governing CA-C–CA-C interactions, and further, it could be used as a lead compound for the development of new antiviral agents against HIV. Here, we report that a 20-mer synthetic peptide derived from the CA-C sequence recognizes CA-C, and it is able to inhibit the homodimerization of CA-C. This peptide, CAC1 (residues 175–194 of CA), comprises the amino acid sequence of the α-helix 2 in CA-C. CAC1 is mainly disordered in solution, self-associates, and interacts specifically with CA-C with an affinity only five times lower than the complete domain.
Results
Spectroscopic characterization of the CAC1 peptide and its variant, CAC1Aib
As a first step to study the binding properties between CA-C and CAC1, several biophysical techniques were used to address the conformational propensities of CAC1, a 20-mer peptide comprising the α-helix 2 of the CA-C domain of HIV-1 plus three flanking residues at each site. The sequence of CAC1 is Ac-E175QASQEVKNWMTETLLV QNA194-NH2.
Circular dichroism measurements
The CD spectrum of CAC1 at 10 μM showed two intense minima at 220 and 195 nm, and a maximum at 205 nm (Fig. 2A ▶). This spectrum is not characteristic either of a disordered structure or of an α-helix (Kelly and Price 2000). The intense minima and/or the maximum could be due to the presence of the sole tryptophan, as it has been shown in other proteins (Freskgård et al. 1994). The intensity of the three bands, and the shape of the CD spectrum changed as the concentration of peptide increased (Fig. 2A ▶). All the spectra showed an isodichroic point at 210 nm (Fig. 2A ▶), suggesting the presence of a two-state process, which can be described by a single equilibrium constant (Woody 1995; Kelly and Price 2000). Fitting of the change in mean ellipticity at 222 nm to equation 2‴ yielded a value for the self-dissociation constant of CAC1 of 17 ± 10 μM (Fig. 2B ▶).
Figure 2.
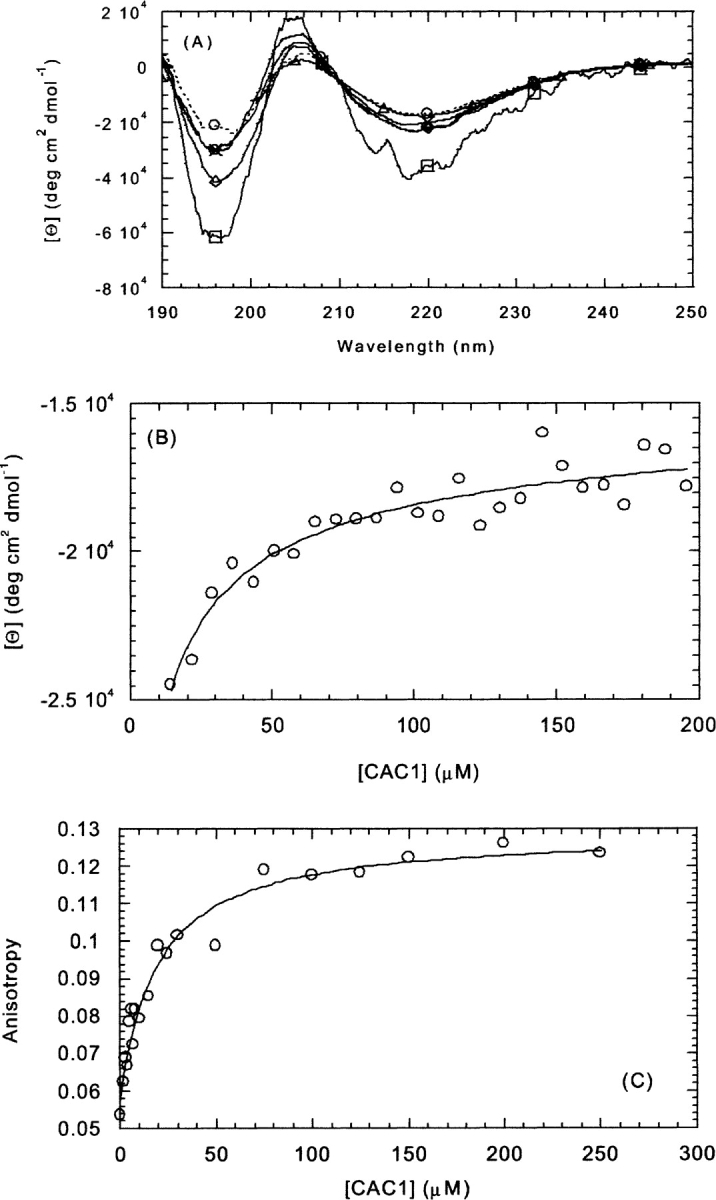
Determination of the self-association properties of CAC1 by circular dichroism and fluorescence anisotropy. (A) Representative spectra of CAC1 at different peptide concentrations: squares (5 μM), circles (20 μM), diamonds (30 μM), crosses (50 μM), and triangles (130 μM), all with continuous lines; and circles and dashed lines (100 μM). (B) Determination of the self-association constant by following the change in molar ellipticity at 222 nm. (C) Using the steady-state anisotropy of Trp184. The conditions were phosphate buffer (pH 7.3), 25 mM, at 298 K. The lines represent the fitting to equation 2 or the other similar equations (see text for details).
Fluorescence measurements
The fluorescence spectrum of CAC1 has a maximum at around 350 nm, corresponding to a tryptophan residue that is solvent-exposed (Pace and Scholtz 1997). It was observed that as the concentration of peptide increased, the maximum was blue-shifted, from 352 nm (at 2.3 μM) to 349 nm (at 120 μM; data not shown). This suggests that even at high peptide concentrations the tryptophan in CAC1 is not buried.
The local and global (segmental) mobility of the only indole moiety in CAC1 can be mapped by measurements of its fluorescence anisotropy (Lakowicz 1999). The anisotropy increased, as it did the ellipticity, in a hyperbolic manner from a value of 0.05 at 2 μM up to a value of 0.12 at 250 μM of CAC1 (Fig. 2C ▶). This anisotropy shift could reflect either a change of the volume of the molecular species (global movement), or a change in the mobility of the nearby environment (local movement). The self-dissociation constant obtained from the anisotropy displacement was 16 ± 5 μM. This value was the same, within the error, than that determined by CD, in which the overall formation of secondary structure was being measured. This suggests that the anisotropy measurements were probably indicating a change in the global behaviour of the peptide.
NMR studies
The spectrum of CAC1 at 10 μM in 2H2O (Fig. 3A ▶) showed up-field signals clustered in those regions expected for random-coil models (Wüthrich 1986). The low-field region in 2H2O only showed the protons of the aromatic ring of the tryptophan, which had chemical shifts close to those observed in random-coil tryptophans (data not shown). Thus, none of the amide protons remained after 5 min in 2H2O (data not shown). All these findings further support the fact that the tryptophan was solvent-exposed, as suggested by the change in maxima wavelength of the fluorescence spectra of CAC1 (see before). Attempts to determine the structure of CAC1 by NMR failed because at the high concentrations needed to acquire two-dimensional NMR spectra, the sample precipitated (data not shown).
Figure 3.

NMR spectra of CAC1 and CA-C. (A) Up-field region of the spectrum of CAC1 at 10 μM. (B) Up-field region of the spectrum obtained by addition of the spectra of CAC1 and CA-C. (C) Up-field region of the spectrum of the heterocomplex formed between CA-C and CAC1 at the same concentrations (10 μM of each macromolecule). (D) Up-field region of CA-C at 10 μM. The conditions were phosphate buffer (pH 7.3), 25 mM, at 298 K in 2H2O (no corrections were done for isotope effects). The sharp signal at the right side observed in all spectra, except in that of CAC1, is the NMR internal reference (TSP). The intensity of the signals for each NMR spectrum is arbitrary.
Design of an anthraniloyl-labeled CAC1 peptide and studies of its self-associating properties
To study the binding to CA-C by using fluorescence, a selective fluorescence probe must be used, which does not interfere with other intrinsic fluorescence probes in the peptide (such as tryptophan). We decided to label CAC1 with an anthraniloyl moiety (Stennicke et al. 1997), the maxima fluorescence emission wavelengths of which did not overlap with that of the tryptophan. The attachment of the anthraniloyl probe to the sole lysine of CAC1 during peptide synthesis yielded peptide CAC1Aib.
To check whether the introduction of the anthraniloyl moiety changed the intrinsic conformational tendencies of CAC1, we measured the self-associating properties of CAC1Aib by using two different approaches. First, we followed the change in the fluorescence of the anthraniloyl moiety upon binding to CAC1. The binding properties of CAC1Aib for CAC1 were determined by titrating a fixed amount of CAC1Aib (1.6 μM) with increasing concentrations of CAC1. Upon binding, the fluorescence intensity of the anthraniloyl moiety at 420 nm did increase (data not shown). The self-dissociation constant determined by using equation 2′ was similar, within the error, to that determined for the unlabeled peptide by CD and anisotropy measurements of the indole ring, with a value of 8 ± 3 μM. And, second, we used the change in the anisotropy of the anthraniloyl moiety as the concentration of unlabeled peptide was increased. The self-dissociation constant determined by using equation 2″ was similar to those previously shown, with a value of 9 ± 3 μM. These findings suggest that CAC1Aib and CAC1 self-associate in a similar way, and thus, both peptides are equivalent for studies of binding to CA-C.
Binding of the peptide CAC1 to the CA-C domain
We have used several biophysical techniques: first, to address whether CA-C and CAC1 interact; and, second, to quantitatively measure the value of such interaction.
CAC1–CA-C interaction
Thermal denaturation experiments.
The dependence of CA-C thermal unfolding upon variation of the CAC1 concentration was firstly studied. The rationale is that, if CAC1 binds to CA-C, the observed thermal stability of the latter could be altered (Pantoliano et al. 2001). Binding of CAC1 to the native state of CA-C, in the absence of binding to the denatured state, will necessarily lead to an increase in the melting temperature; conversely, binding to the unfolded state of CA-C, in the absence of binding to the native state, will decrease the melting temperature relative to the protein in the absence of ligand (Waldron and Murphy 2003).
CA-C showed a unique thermal transition as followed by far-UV CD with a thermal midpoint at 336.1 K (Mateu 2002). CAC1, conversely, did not show any thermal transition at any concentration explored from 40 μM to 192 μM (data not shown). When thermal denaturation experiments were carried out at a CA-C concentration of 20 μM, and the CAC1 concentration was changed from 20 μM up to 60 μM, the thermal midpoint was invariably reduced (Fig. 4A ▶). However, thermal denaturation led to precipitation of the sample. We do not know whether this precipitation was the result of the interaction of CAC1 when CA-C was partially unfolded (i.e., only partially folded CA-C species would be competent for binding), or on the other hand, CAC1 and CA-C interact and the complex showed irreversible aggregation upon heat-induced denaturation (i.e., binding would occur before the heterocomplex unfolds). In both scenarios, however, the decrease in the thermal midpoint must be due to the interaction.
Figure 4.

CA-C and CAC1 interactions followed by far-UV thermal denaturation, and gel filtration. (A) Changes in ellipticity followed at 222 nm (far-UV CD) upon thermal denaturation of CA-C isolated at 20 μM (continuous line and squares) and that of the complex (dotted line and squares) in a 20 μM/20 μM rate of protein to peptide, and (dashed lines and diamonds) 20 μM/40 μM rate of protein to peptide. The conditions were phosphate buffer (pH 7.3), 25 mM. Spectra were acquired in 0.1-cm-pathlength cells. (B) Squares and continuous lines indicate the chromatogram at 20 μM of CA-C; the squares and the dotted lines, at 20 μM of CA-C and 128 μM of CAC1. The small shoulders at the right side of the peak corresponded probably to unbound CAC1. The conditions were phosphate buffer (pH 7.3), 25 mM, and 150 mM NaCl at 298 K.
SEC experiments.
SEC of CA-C yielded a single peak at any protein concentration (Mateu 2002). This indicates that the equilibrium between the CA-C monomer and CA-C dimer is fast compared with the elution time (Corbett and Roche 1984). The elution volume of CA-C alone at 20 μM was 13.16 mL (Fig. 4B ▶). As the concentration of CAC1 increased, the elution volume of the heterocomplex increased: 13.22 mL (at 60 μM of CAC1) and 13.52 mL (at 128 μM of CAC1). Because the inherent precision in the size of the determination of globular proteins by gel partitioning methods has been shown to be ±0.1 mL in elution volumes (Ackers 1967), the differences found in the elution volumes in these experiments are significant. These results suggest that CAC1 interacts with CA-C and, it provides evidence that this interaction could involve the dissociation of the CA-C dimer, because the larger elution volume indicates a reduction in the size of the macromolecule.
NMR experiments.
The one-dimensional NMR spectrum in 2H2O of CA-C was characterized by the presence of methyl groups up-field shifted at 0.2 and 0.5 ppm (Fig. 3D ▶). In the amide region, a large dispersion of the amide protons between 8 and 9 ppm was observed, and the spectrum showed also a complete absence of protons between 5 and 6 ppm (data not shown). Furthermore, when dissolved in 2H2O, several amide protons remained after 8 h. All these features are expected for a folded α-helical protein, as shown by its X-ray structure (Gamble et al. 1997).
If CAC1 heterodimerizes with CA-C and this leads to dissociation of the CA-C homodimer (as suggested by the SEC experiments), the NMR signals should be expected to change (in chemical shift, line broadening, and/or intensity). Different experiments were carried out at 10 μM concentration of CAC1, 10 μM of CA-C, and 20 μM of the complex formed between CAC1 (at 10 μM) and CA-C (at 10 μM; Fig. 3 ▶). The spectrum of the complex between CAC1 and CA-C obtained by mixing 10 μM of CAC1 and 10 μM of CA-C (Fig. 3C ▶) was different to the sum spectrum (Fig. 3B ▶) obtained by adding the spectra of CAC1 (Fig. 3A ▶) and CA-C (Fig. 3D ▶). The main differences were observed in the region between 1.5 and 2.0 ppm, where the methylene protons corresponding to the side chains of amino acids with a long alkyl chain (such as Lys or Arg) appear (Wüthrich 1986). Minor changes were also observed in the methyl region between 0.8 and 1.0 ppm (Fig. 3B,C ▶). In the region of the Hα protons, where usually changes in secondary structure are easily detected, no changes occurring upon binding were observed, probably due to the fact that CA-C is an all α-helical protein, and there is a large number of overlapping resonances (CA-C is 86 residues long) in the region between 3.60 and 4.40 ppm. The fact that there were differences between the experimental spectrum of the CAC1–CA-C heterocomplex and the spectrum obtained by adding the spectra of the individual species (CA-C and CAC1) unambiguously indicates that there was binding between CAC1 and CA-C. Because the experiments were carried out in 2H2O (see Materials and Methods), no reliable information could be obtained from the amide region, because all the amide protons of CAC1 disappeared in the dead-time of the experiment.
We also tried to follow the changes in chemical shifts at 100 μM of CA-C concentration (data not shown), with increasing concentrations of CAC1 (ranging from 100 μM to 200 μM). However, in this range no changes in chemical shifts, signal intensity, or line broadening were observed. Thus, at these high NMR concentrations, no evidence of complex formation was observed. Similar behavior has been observed in other proteins with binding that is followed by NMR at high concentrations (Arac et al. 2003), for which such results have been interpreted as a limit for the apparent affinity constant of the corresponding complexes. This would indicate that the dissociation constant for the CAC1–CA-C heterocomplex is <100 μM.
Measurement of the apparent affinity constant of the CAC1–CA-C heterocomplex
Thermal denaturation, one-dimensional NMR, and SEC analysis provided unambiguous evidence of an interaction between CAC1 and CA-C, but none of these techniques could be used to obtain the affinity constant. To that end, we used three additional experimental approaches.
First, the changes in the fluorescence emission intensity of the anthraniloyl moiety of CAC1Aib at 420 nm, upon CA-C binding, were analyzed (see Materials and Methods). No precipitation was observed in the explored protein concentration range (Fig. A). The value obtained for the apparent dissociation constant, according to equation 1, was 30 ± 10 μM.
As a second method to determine the dissociation constant of the CAC1–CA-C heterocomplex, we used analytical affinity chromatography, on a column containing covalently coupled CA-C. No precipitation was observed, and data could be well fit to equation 5 (Fig. 5B ▶). The value obtained for the apparent dissociation constant of the heterocomplex was 43 ± 2 μM. The good fitting obtained with our measurements, and previous studies with analytical affinity chromatography in other proteins (Dunn and Chaiken 1974) and CA-C (Rosé et al. 1992) indicate that the CA-C protein attached to the column remains monomeric, and the heterocomplex is formed by only one molecule of CA-C
Figure 5.
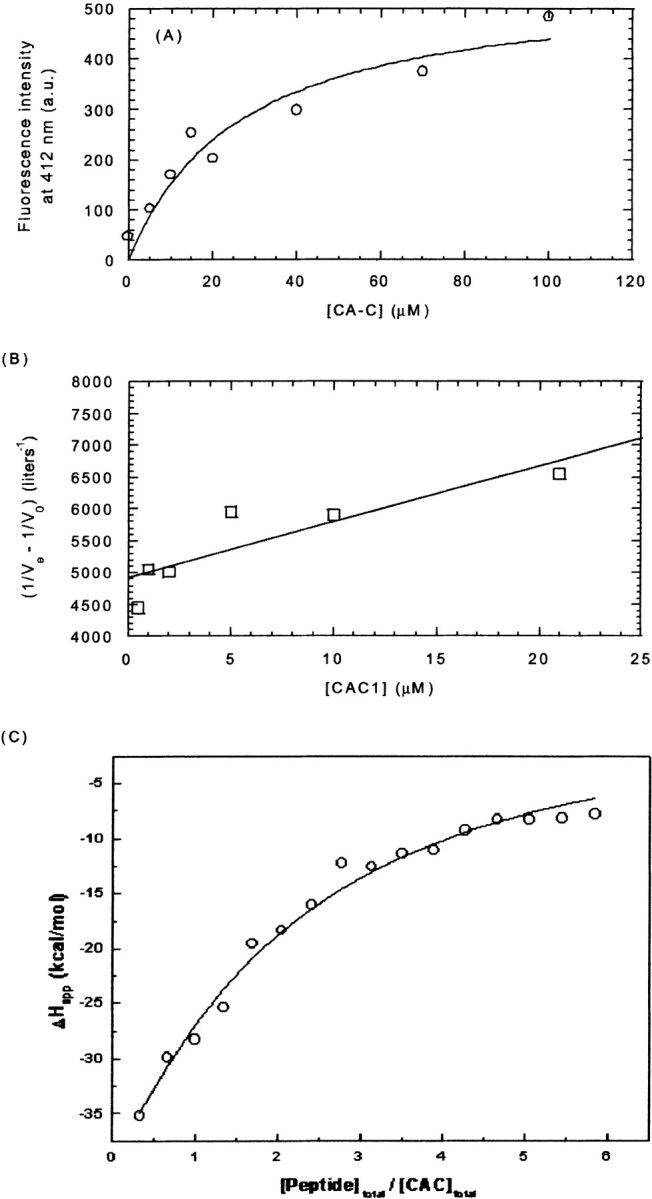
Binding of CAC1 to CA-C. (A) Steady-state fluorescence of the anthraniloyl-labeled CAC1 upon addition of increasing amounts of CA-C, by excitation at 320 and observation at 420 nm (a similar curve was observed by excitation at 246 nm). The value obtained for the dissociation constant was 30 ± 10 μM. (B) Affinity chromatography. The value obtained for the dissociation constant was 43 ± 2 μM. (C) ITC isotherm. The value obtained for the dissociation constant was 79 ± 7 μM. The conditions in all cases were phosphate buffer (pH 7.3), 25 mM, at 298 K. The lines represent the fitting to equation 1 for the fluorescence data (a similar curve was obtained by using equation 2), to equation 5 for the affinity chromatography results, and to the equation included with the Microcal software for a single-site model with a complex 1:1 stoichiometry (ITC data).
Finally, we measured the heat evolved upon CAC1–CA-C interaction by ITC (Fig. 5C ▶). Precipitation was only observed at high CAC1 concentrations, but the apparent dissociation constant could be determined. The estimated value was 79 ± 7 μM. This value was somewhat higher than those obtained by the other techniques, but it could be due to the precipitation observed in the ITC experiments at the highest peptide concentrations. Precipitation would be hampered in the affinity experiments because of binding to the solid phase and, in the fluorescence experiments, because of the low concentrations of CA-C and CAC1Aib used. In any case, the three independent analyses yielded reasonably similar values (averaging 50 ± 25 μM) for the apparent dissociation constant of the CAC1–CA-C heterocomplex.
Discussion
A protein yet to be exploited as a potential target for HIV drugs is the capsid protein of HIV, an attractive candidate because of its essential role in virion morphogenesis (von Schwedler et al. 1998; Tang et al. 2001; Forshey et al. 2002). Agents that affect capsid assembly or its stability can be potential strong inhibitors of viral replication, as it has shown in other viruses, such as in the hepatitis B virus (Deres et al. 2003) and rhinoviruses (Smith et al. 1986). For HIV, we have undertaken the design of an inhibitor of the CA-C dimerization able to mimic, both structurally (Gamble et al. 1997) and energetically (del Álamo et al. 2003), the CA-C dimerization interface. The results described here indicate that a short peptide, CAC1, which encompasses mainly the sequence corresponding to the α-helix 2 of the CA-C domain of HIV, shows an affinity for this domain that is only about five times lower than that of the intact protein, and then, it is able to mimic most of the dimerization interface of CA-C domain.
Structure of the CAC1 peptide
CAC1 is mainly disordered in solution as shown by NMR, fluorescence, and CD. However, the CD spectra showed intense bands, which are not characteristic of fully disordered structures, but they are probably due to the sole tryptophan (Freksgård et al. 1994; Woody 1995; Kelly and Price 2000). As the concentration of peptide was increased, the ellipticity at 222 nm was reduced (Fig. 2A,B ▶), suggesting that either some preferred helical population was reduced or the environment around the tryptophan (the sole aromatic residue) changed (Freksgård et al. 1994; Woody 1995; Kelly and Price 2000). In fact, upon increasing concentration, the indole moiety also shows a small bluelight-shifted fluorescence spectra and its anisotropy increased (Fig. 2C ▶). The isolated peptide has a very low tendency to form helical structure, as shown by the CD spectra and the theoretical predictions obtained by using the program AGADIR (Muñoz and Serrano 1994), which yielded 2.2% of helical structure. All these data suggest that probably the environment around tryptophan changes upon self-association, although we cannot rule out that these changes are concomitantly inducing native-like helical structure. Native-like structure has been shown to be induced around bulky side chains of aromatic residues in some model peptides and proteins during their folding (Simmerling and Elber 1995; Kemmink and Creighton 1996). However, it is unclear whether the structure of CAC1 upon binding to CA-C is native-like. As it has been shown, peptides can interact with proteins in a wide variety of ways (Stanfield and Wilson 1995); in CAC1, it could be that the environment around tryptophan (and then native-like structure around it) could be kept upon CA-C binding.
The self-dissociation constant of the peptide has a mean value (averaging over all the biophysical measurements) of 12 ± 5 μM. This value is very close to that obtained for the homodimerization of the intact CA-C domain (10 μM; Gamble et al. 1997), suggesting that homodimerization of CA-C is mainly governed by α-helix-2–α-helix-2 interactions (see below). The oligomerization state of CAC1 could not be ascertained. However, the gel filtration studies of isolated CAC1 suggest that at moderately high concentrations, the peptide is a dimer. Attempts to determine the CAC1 molecular weight from the observed elution volume yielded a value of 4800 ± 500 D, which is close to the expected dimer molecular weight for a monomer of 2318.56 D (data not shown).
Molecular recognition of CA-C by peptide CAC1
The CA-C domain and the CAC1 peptide interact, as it has been shown here by different biophysical techniques. However, it could be thought that the intrinsic tendency of CAC1 to self-associate is responsible for binding to CA-C through unspecific association. Negative control experiments carried out with enzyme I, a dimer protein involved in phosphorylation systems in bacteria, suggest that the interaction between CA-C and CAC1 corresponding to its α-helix 2 is specific. These control experiments involved the determination of the Stern-Volmer quenching constant of the an-thraniloyl moiety of CAC1Aib under three different solution conditions: (1) in the presence of enzyme I (EI); (2) in the presence of CA-C; and, (3) the isolated CAC1Aib peptide. Either in the presence of EI or in the absence of CA-C, the Stern-Volmer constant of the anthraniloyl moiety was lower (1.0 ± 0.1 M−1) than in the presence of the CA-C domain (1.7 ± 0.1 M−1). We do not know the reasons why the quenching constant of the anthraniloyl is increased upon binding, but they could be due to the fact that upon binding the peptide acquires a native-like conformation, because in the X-ray structure of CA-C (Gamble et al. 1997), the backbone of Lys182 is completely buried but its side chain is partially exposed. This suggests that binding between both macromolecules involves the side chains.
The NMR experiments also show that the most important regions involved in binding are the side chains of the amino acids of both species, as judged by the changes in the upfield region of the spectra (Fig. 3 ▶). This is further supported by the changes occurring upon binding to CA-C in the fluorescence spectra of the anthraniloyl moiety, which is attached to the side chain of Lys182. It has been shown that peptide binding may involve regular secondary structure of the binding protein (such as it happens in the MHC II class peptides), but also, as it happens in the MHC class I molecules, the side chains of the macromolecules may be the most affected regions upon peptide binding (Stanfield and Wilson 1995; Davis and Teague 1999). In CAC1 and CA-C, binding would involve the side chains of the CA-C, although changes in either peptide or protein backbones at this stage cannot be ruled out. NMR analyses of 15N-labeled CA-C and its complex with CAC1 are being carried out in our laboratories to provide further insights on this subject.
The similarity between the self-association constant of CAC1 and that of CA-C and, most importantly, the relatively small difference between the dissociation constant of the CAC1–CA-C heterocomplex and that of the CA-C ho-modimer indicate that many important interactions for CA-C recognition are contained within α-helix 2, in agreement with previous structural (Gamble et al. 1997) and thermodynamic studies (del Álamo et al. 2003) with the CA-C homodimer. The peptide mimics most of the interactions that form the dimerization interface of CA-C. The difference between the affinity values obtained for the peptide–protein heterodimer and the protein homodimer might be due to entropic considerations. In fact, there is a large conformational entropy penalty paid upon binding of CAC1 to CA-C, mainly because of the larger flexibility of CAC1 alone compared with the CA-C monomer. Also, the difference must rely on the contribution of other critical residues for dimerization present in the intact domain, including Ile150, Leu151, Arg154, and Leu171 (del Álamo et al. 2003). The structural differences between the peptide and the intact domain may be also in part responsible for the difference between both constants. In particular, it should be taken into account that mutation of Gln192 at the CA-C interface to Ala led to a 20-fold increase in the homodimerization affinity (del Álamo et al. 2003). This residue is included in the CAC1 sequence, but its structural environment at the C-terminal end of the peptide is probably different from that in dimeric CA-C, and its negative effect on the affinity might not be fulfilled as part of the peptide. Whatever the exact reasons, it is remarkable that, despite lacking some critical residues for homodimerization and not being folded in solution, the isolated α-helix 2 from CA-C is able to specifically bind the domain with such high affinity.
However, it is not known yet whether the heterocomplex is formed by only one single species of each macromolecule (i.e., one molecule of CAC1 and another one of CA-C). Several lines of evidence suggest that the heterocomplex is formed by only a single molecule of each species: (1) the elution volume in the gel filtration experiments of the heterocomplex (Fig. 4B ▶); and (2) the fact that, within the experimental error of our measurements, when the binding is followed by the fluorescence of the anthraniloyl moiety (Fig. 5A ▶) there is no lag phase at low peptide concentrations before the sigmoidal curve. This lag phase would indicate the formation of dimer CAC1 species, which would be the sole species capable of binding to CA-C. And, finally, the good fitting to equation 5 and previous results with analytical affinity chromatography and CA-C (Rosé et al 1992) indicate that the CA-C attached to the column is monomeric.
To conclude, we have shown that a 20-mer peptide containing the major dimerization helix of the C-terminal domain of CA from HIV-1 is able to specifically interact with and dissociate the CA-C dimer. The association constant of such peptide is modest, but it is only five times lower than the homodimerization constant of both CA-C and intact CA. Thus, CAC1 might be a model for conceiving peptidomimetics that show the same binding properties to CA-C.
Materials and methods
Materials
Imidazole, Trizma base, and NaCl were from Sigma. Standard suppliers were used for all the other chemicals. Dialysis tubing was from Spectrapore with a molecular mass of 3500 D. Water was deionized and purified by using a Millipore system.
Protein expression and purification
The wild-type CA-C protein was expressed in Escherichia coli BL21(DE3) and purified as described (Mateu 2002; del Álamo et al. 2003). Protein was stored and analyzed in 25 mM sodium phosphate buffer (pH 7.3). Protein stocks were run in SDS-PAGE gels and found to be >97% pure. Purity was also confirmed by MALDI mass spectrometry analysis (data not shown). Protein concentration was calculated from the absorbance of stock solution measured at 280 nm, using the extinction coefficients of model compounds (Pace and Scholtz 1997).
Wild-type dimeric EI protein from Streptomyces coelicolor, used as a control dimeric protein in binding experiments (see below), was expressed in E. coli BL21(DE3) strain and purified by using Ni2+-NTA chromatography (Invitrogen). To eliminate any protein or DNA bound to the resin coeluting with the protein, an additional gel filtration chromatography step was carried out by using a Superdex 200 16/60 gel filtration column (Amersham Biosciences) running on an AKTA-FPLC machine.
Peptide design, synthesis, and purification
Peptide CAC1 (Ac-EQASQEVKNWMTETLLVQNA-CONH2) was derived from the CA-C sequence, and comprised residues 175–194 of the wild-type CA protein. Those amino acids form α-helix 2 of CA-C (residues Ser178–Val191, i.e., most of the structural and energetic CA-C dimerization interface) plus three flanking residues on each side to avoid fraying effects at the ends of the peptide. The N and C termini were, respectively, acetylated or amidated to avoid charge effects. An anthraniloyl-fluorescent version of CAC1, CAC1Aib, was obtained by direct incorporation, during automatic synthesis, of an anthraniloyl moiety into the ɛ-amino group of the sole Lys of the peptide (Lys182). The CAC1Aib peptide showed absorption maxima at 246 and 320 nm (data not shown), as it should be expected from the anthraniloyl moiety (Stennicke et al. 1997). Purity of both peptides was assessed by mass spectrometry and HPLC chromatography and found to be >95%. Both peptides were purchased from Dr. Graham Bloomberg (University of Bristol, UK). Peptide concentrations were determined by the weight of the corresponding amount of dried peptide.
Fluorescence measurements
Fluorescence spectra were collected either on a SLM 8000 spectrofluorometer (Spectronics Instruments) interfaced with a Haake water bath, or in a Cary Eclipse spectrofluorometer (Varian) interfaced with a Peltier cell. Sample concentration was varied in the range 0.5–250 μM for CAC1 and 0.5–200 μM for intact CA-C. A 0.5-cm-pathlength quartz cell (Hellma) was used for measurements in the SLM spectrofluorometer, and a 1-cm-pathlength quartz cell (Hellma) was used in the Varian spectrofluorometer.
Determination of the apparent dissociation constant of the complex between CAC1 and CA-C
Increasing amounts of CA-C, in the range 0.5–120 μM, were added to a solution of a fixed concentration of CAC1Aib (1.6 μM) in 25 mM sodium phosphate buffer (pH 7.3), and the fluorescence was measured after 2-h incubation at 298 K. Experiments were carried out in the Varian Cary Eclipse spectrofluorometer with excitation at 246 nm (or 320 nm), and emission fluorescence was collected between 400 and 500 nm. The excitation and emission slit widths were both 5 nm, and the data pitch interval was 1 nm. Lower concentrations of the CAC1Aib (0.9 μM) could not be monitored due to a poor signal-to-noise ratio (data not shown).
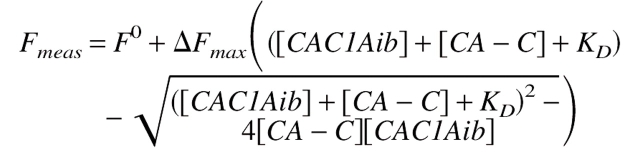
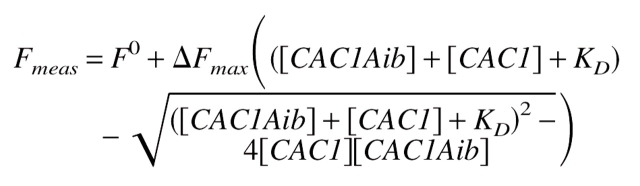
The fluorescence intensity of CAC1Aib at 420 nm changed upon binding to CA-C. The apparent dissociation constant was calculated by fitting that fluorescence change versus the concentration of added CA-C to:
 |
(1) |
or its simplified form:
 |
(2) |
where [CAC1Aib] is the concentration of the anthraniloyl-labeled peptide, [CA − C] is the concentration of the CA-C domain, Fmeas is the measured fluorescence at each concentration of the CA-C domain, ΔFmax is the change in the fluorescence measured when all CA-C is forming the heterocomplex, F0 is the fluorescence of the labeled peptide, and KD is the apparent dissociation constant of the heterocomplex. Both equations yielded the same set of parameters (data not shown).
The anthraniloyl-labeled peptide stock solution was prepared by dissolving the corresponding amount in methanol (because of its low solubility in water) to yield a final stock solution with a concentration of 410 μM. Aliquots were added to the titrating solutions (either the CA-C domain or the unlabeled peptide, see below) in such small volumes that the residual final methanol concentration in the sample was <0.4%. These small concentrations of organic solvent did not change the structure or self-association properties of either the CA-C domain or the unlabeled peptide, as suggested by the CD and fluorescence spectra of both molecules (data not shown). At these small concentrations, CAC1Aib was soluble. Absorbance of the CACAib (and CAC1) samples (ranging from 2 μM to 120 μM concentrations) at wavelengths >460 nm suggested the absence of high molecular weight aggregates (data not shown).
Determination of the self-dissociation constant of CAC1 and CAC1Aib by steady-sate fluorescence
Increasing amounts of CAC1, in the range 0.5–190 μM, were added to a solution containing CAC1Aib (1.6 μM) in 25 mM sodium phosphate buffer (pH 7.3), and the steady-state fluorescence of the mixture was measured after 2-h incubation at 298 K. The other experimental conditions were the same as those described above for determination of the apparent dissociation constant of the heterocomplex. Smaller concentrations of the labeled peptide (0.9 μM) could not be reliably monitored because of a poor signal-to-noise ratio (data not shown).
The fluorescence intensity of CAC1Aib at 420 nm changed upon binding to CAC1. The apparent self-dissociation constant was calculated by fitting that fluorescence change versus the concentration of added CAC1 to:
 |
(1′) |
(1′), which is analogous to equation 1, but here KD is the self-dissociation constant of CAC1. Alternatively, its simplified form was used:
 |
(2′) |
which is analogous to equation 2.
Determination of the self-dissociation constants of CAC1 and CAC1Aib by steady-state anisotropy
The steady-state anisotropy, 〈r〉, is defined by (Lakowicz 1999):
 |
(3) |
where IV and IH are, respectively, the parallel and perpendicular components of the polarized fluorescence light, and G is a correction factor for the different fluorescence response to the two polarized components. The G factor was determined for each point, and it was typically 0.84 for the indole moiety. Fluorescence anisotropy was recorded in the T arrangement (simultaneous recording of the parallel and perpendicular emitted light) in the SLM 8000 spectrofluorometer. Each reported anisotropy value is the average of five independent measurements. Determination of the anisotropy of the indole moiety was followed by excitation at 280 nm and emission at 350 nm.
Determination of the anisotropy of the anthraniloyl moiety was followed by excitation at 320 nm and emission at 420 nm. The G factor was determined for each point, and it was typically 0.58 for the anthraniloyl moiety. Each reported anisotropy value is the average of five independent measurements. Increasing amounts of CAC1, in the range 0.5–190 μM, were added to a solution containing CAC1Aib (1.6 μM) in 25 mM sodium phosphate buffer (pH 7.3), and the steady-state anisotropy of the mixture was measured after 2-h incubation at 298 K.
Anisotropies at any particular peptide concentration were fitted for both fluorescence moieties to:
 |
(2″) |
which is analogous to equation 2′.
Quenching measurements
Quenching experiments by following the fluorescence of the anthraniloyl moiety were carried by excitation at 320 nm and collecting spectra between 390 and 450 nm at 298 K. Excitation and emission slit widths were both 5 nm. Data interval was 1 nm. Ionic strength was kept constant by addition of KCl. Also, Na2S2O3 was added to a final concentration of 0.1 M to avoid formation of I3−. Data were fitted to the linear Stern-Volmer equation (Lakowicz 1999). Each reported value of the Stern-Volmer constant (see Discussion) is the averaged result of four complete independent measurements. CAC1Aib concentration was 2 μM in all experiments, and CA-C and EI concentrations were 4 μM.
Circular dichroism measurements
CD spectra were collected on a Jasco J810 spectropolarimeter fitted with a thermostated cell holder and interfaced with a Neslab RTE-111 water bath. Isothermal wavelength spectra were acquired at a scan speed of 50 nm/min with a response time of 2 sec and averaged over four scans at 298 K. Typically, CAC1 concentrations were 10 to 300 μM in a 0.1-cm-pathlength cell. Smaller peptide concentrations yielded a poor signal-to-noise ratio (data not shown). All spectra were corrected by subtracting the proper baseline.
The mean residue ellipticity, [Θ], was calculated according to:
 |
(4) |
where Θ is the measured ellipticity, l is the pathlength cell, c is the protein concentration, and N is the number of amino acids.
Temperature measurements
Thermal-denaturation experiments in the far-UV were performed at constant heating rate of 60 °C/h and a response time of 8 sec. Thermal scans were collected at 222 nm from 298 K to 363 K in 0.1-cm-pathlength cells with a total CA-C concentration of 20 μM, and by adding increasing amounts of CAC1 (from 20 μM to 60 μM). The possibility of drifting of the CD spectropolarimeter was tested by running two samples containing buffer, before and after the thermal experiments. No difference was observed between the scans. Every thermal denaturation experiment was repeated at least twice with fresh new samples.
Thermal denaturation experiments were also carried out with peptide CAC1. The parameter set and the CAC1 concentrations used were the same than those described above.
Determination of the self-dissociation constant of CAC1
The change in ellipticity at 222 nm was followed as the CAC1 concentration increased. It was fitted to:
 |
(2‴) |
which is analogous to equation 2 (see above).
Fitting to all binding equations was carried out by a least-squares analysis using the program Kaleidagraph (Abelbeck software) on a personal computer. In all equations, the derived fitting constants, KD, and the corresponding spectroscopic parameters are highly dependent on the values of the initial guesses used in the fitting program; then, an analysis of the χ2 parameter was carried out to select the proper values of those parameters. In all cases, the reported apparent dissociation constants are the average of three independent measurements.
Size-exclusion chromatography
Analytical size-exclusion chromatography (SEC) experiments were carried out by using an analytical gel filtration Superdex 75 HR 16/60 column (Amersham Biosciences) running on an AKTA-FPLC system at 298 K. Flow rates of 1 mL/min were used, and aliquots of 100 μL were loaded into the column after equilibration. The column was equilibrated with four column volumes of elution buffer (25 mM sodium phosphate at pH 7.3, containing 150 mM NaCl to avoid nonspecific interactions with the column). The column was calibrated by using the gel filtration low-molecular-weight calibration kit (Amersham Biosciences). The standards used and their corresponding Stokes radii were as follows: ribonuclease A (16.4 Å), chymotrypsinogen (20.9 Å), ovoalbumin (30.5 Å), and bovine serum albumin (35.5 Å; Hinkle et al. 1999). Protein and peptide elution volumes were monitored by following absorbance at 280 nm. The CA-C concentration was in all cases was 20 μM, and increasing amounts of CAC1 were added. The mixture formed by the protein and the peptide was incubated during 2 h at 298 K. The reported elution volume is the result of four independent measurements with fresh new samples.
Nuclear magnetic resonance spectroscopy
One-dimensional 1H NMR experiments were carried out in a Bruker DRX-500 spectrometer at 298 K with 32,000 data points and using the WATERGATE sequence (Piotto et al. 1992) to eliminate the water signal. Typically, 25,000 scans were acquired, during 15 h, and the spectral width was 6000 Hz in all cases. CA-C concentration was 10 μM (pH 7.3) in 25 mM phosphate buffer at 298 K in 2H2O. No corrections were done for isotope effects. NMR experiments were carried out in 2H2O, although most of the amide signals disappeared, to increase the signal-to-noise ratio at the lower concentrations used. Increasing amounts of CAC1 were added, ranging from 10 μM to 20 μM. The spectra were processed by using the BRUKER-XWINNMR software working on a personal computer workstation. An exponential window function and polynomial base line corrections were applied. The final one-dimensional 1H NMR data contained 64,000 data points. 1H chemical shifts were quoted relative to internal TSP. Also, experiments were also carried out with 100 μM of peptide, protein, or the mixture (100 μM of peptide and 100 μM of protein) in 2H2O at 298 K. In these experiments, 2048 scans were acquired.
Isothermal titration calorimetry studies
Isothermal titration calorimetry (ITC) experiments were carried out using an Omega instrument (MicroCal Inc.) coupled to an external nanovoltmeter, which was used to improve the signal to noise ratio (Cooper and Johnson 1994). All measurements were performed at 298 K in 25 mM sodium phosphate buffer (pH 7.3). Prior to the experiment, CA-C was exhaustively dialyzed at 277 K against the reaction buffer. The calorimetric cell was loaded with CA-C at a concentration of 21.5 μM, and CAC1 was loaded in the syringe at a total peptide concentration of 483 μM. Microliter amounts of the ligand solution (CAC1) were added sequentially to the calorimetric cell (1.37 mL), which contained the protein solution (CA-C). The amount of power required to maintain the reaction cell at constant temperature after each injection was monitored as a function of time. In an independent experiment, the individual heats of dilution for the CAC1 peptide (mainly due to dissociation of the peptide dimer upon dilution) were determined under the same experimental conditions by making identical injections of the CAC1 solution into the titration cell, containing only buffer. The heat due to the binding reaction between CAC1 peptide and CA-C protein was obtained as the difference between the heat of reaction (CAC1/CA-C) and the corresponding heat of dilution (CAC1/ buffer). The resulting isotherm (individual apparent enthalpy changes upon binding versus molar ratio, [CAC1]/[CA-C]) was fitted to a single-site model assuming that the complex CA-C-CAC1 had a 1:1 stoichiometry. The thermodynamical parameters of binding were obtained by analyzing the data with the software provided by MicroCal.
Determination of the apparent binding constant by analytical affinity chromatography
The dissociation constants of the heterocomplexes formed with CA-C and CAC1 were also determined by affinity chromatography (Dunn and Chaiken 1974). The CA-C protein was covalently bound to an Affi-Prep10 (BioRad) gel matrix according to the manufacturer’s instructions. Five milliliters of gel with coupled CA-C were packed in a FPLC column (Amersham Biosciences) and equilibrated with elution buffer (25 mM sodium phosphate at pH 7.3 and 150 mM NaCl) at 298 K. Protein or peptide samples were applied in small zones (500 μL), eluted at 1 mL/min and continuously monitored with an on-line UV detector set at 280 nm. The column was calibrated by using free CA-C applied at a total protein (monomer) concentrations, Ct, ranging from 0.5 μM to 20 μM. The elution volume, Ve, for each concentration was determined as that corresponding to the maximum in the chromatogram. The self-dissociation constant (homodimerization) of CA-C, KD, and the amount of CA-C covalently bound to the matrix, Mt, were determined as described (Rosé et al. 1992) by linear fitting of the experimental data to:
 |
(5) |
where V0 is the elution volume for a noninteracting protein (such as carbonic anhydrase). The KD thus obtained for CA-C was 9.8 ± 0.4 μM, which was very similar to that obtained using equilibrium sedimentation (Gamble et al. 1997), and Mt was 9.0 ± 0.2 nmole. The use of this method or a different approach based on frontal elution to calibrate affinity CAC-AffiPrep10 columns (data not shown) yielded similar Mt values. To determine the dissociation constant of the complex between CA-C and CAC1, 500 μL aliquots of CAC1 at Ct ranging from 0.5 μM to 20 μM were 1 applied to the above described column. The  ) values obtained at different concentrations were linearly fitted, and the apparent binding constant was directly obtained by multiplying the value of the y-axis intercept (i.e., for Ct = 0) by the Mt value previously determined, as described (Rosé et al. 1992).
Acknowledgments
We thank Dr. F. Titgemeyer for the generous gift of the recombinant plasmid encoding the enzyme I. This work was supported by grants from the Spanish Ministerio de Sanidad y Consumo (MSC; FIS 01/0004-02), Generalitat Valenciana (CTDIB2002-6) to J.L.N., by a grant from the Spanish Ministerio de Ciencia y Tecnología (MCyT; BIO2000-1081) to J.G., by grants from the MSC (FIS 01/0004-01) and MCyT (BIO2000-0408) to M.G.M., and by an institutional grant from Fundación Ramón Areces to the Centro de Biología Molecular “Severo Ochoa.” M.C.L.-M. was recipient of a predoctoral fellowship from the Spanish MSC. F.N.B. was recipient of a predoctoral fellowship from the Spanish Ministerio de Educación, Cultura y Deporte. We deeply thank May García, María del Carmen Fuster, and Javier Casanova for excellent technical assistance. We are also very grateful for the detailed suggestions provided by the referees.
The publication costs of this article were defrayed in part by payment of page charges. This article must therefore be hereby marked “advertisement” in accordance with 18 USC section 1734 solely to indicate this fact.
Abbreviations
CA, capsid protein of HIV (p24)
CA-C, C-terminal domain of CA
CAC1, peptide comprising the second helix of CA-C
CAC1Aib, the CAC1 peptide with the anthraniloyl moiety attached to the ɛ-group of Lys182
CD, circular dichroism
IN, integrase
ITC, isothermal titration calorimetry
RT, reverse transcriptase
PR, protease
SEC, size-exclusion chromatography
TSP, 3-(trimethylsilyl) propionic acid-2,2,3,3-2H4-sodium salt
UV, ultraviolet
Article and publication are at http://www.proteinscience.org/cgi/doi/10.1110/ps.03555304.
References
- Ackers, G.K. 1967. Molecular sieve studies of interacting protein systems, I: Equations for transport of associating systems. J. Biol. Chem. 242 3026–3034. [PubMed] [Google Scholar]
- Arac, D., Murphy, T., and Rizo, J. 2003. Facile detection of protein–protein interactions by one-dimensional NMR spectroscopy. Biochemistry 42 2774–2780. [DOI] [PubMed] [Google Scholar]
- Babé, L.M., Pichuantes, S., and Craik, C.S. 1991. Inhibition of HIV protease activity by heterodimer formation. Biochemistry 30 106–111. [DOI] [PubMed] [Google Scholar]
- Borsetti, A., Öhagen, Å., and Göttlinger, H.G. 1998. The C-terminal half of the human immunodeficiency virus type 1 Gag precursor is sufficient for efficient particle assembly. J. Virol. 72 9313–9317. [DOI] [PMC free article] [PubMed] [Google Scholar]
- Cooper, A. and Johnson, C.M. 1994. Isothermal titration calorimetry. Methods Mol. Biol. 22 137–150. [DOI] [PubMed] [Google Scholar]
- Corbett, R.J.T. and Roche, R.S. 1984. Use of high speed size-exclusion chromatography for the study of protein folding and stability. Biochemistry 23 1888–1894. [DOI] [PubMed] [Google Scholar]
- Davis, A.M. and Teague, S.J. 1999. Hydrogen bonding, hydrophobic interactions, and failure of the rigid receptor hypothesis. Agnew Chem. Int. Ed. 38 736–749. [DOI] [PubMed] [Google Scholar]
- del Álamo, M., Neira, J.L., and Mateu, M.G. 2003. Thermodynamic dissection of a low-affinity protein–protein interface involved in human immunodeficiency virus. J. Biol. Chem. 278 27923–27929. [DOI] [PubMed] [Google Scholar]
- DeLano, W.L. 2002. The PyMOL Molecular Graphics System. DeLano Scientific, San Carlos, CA (http://www.pymol.org).
- Deres, K., Schroeder, C.H., Paessesn, A., Goldmann, S., Hacker, H.J., Weber, O., Kramer, T., Niewohner, U., Pleiss, U., Stoltefuss, J., et al. 2003. Inhibition of hepatitis B virus replication by drug-induced depletion of nucleocapsids. Science 299 893–896. [DOI] [PubMed] [Google Scholar]
- Dorfman, T., Bukovsky, A., Öhagen, Å., Hoglund, S., and Göttlinger, H.G. 1994. Functional domains of the capsid protein of human immunodeficiency virus. J. Virol. 68 8180–8187. [DOI] [PMC free article] [PubMed] [Google Scholar]
- Dunn, B.M. and Chaiken, I.M. 1974. Quantitative affinity chromatography: Determination of binding constants by elution with competitive inhibitors. Proc. Natl. Acad. Sci. 71 2382–2385. [DOI] [PMC free article] [PubMed] [Google Scholar]
- Forshey, B.M., von Schwedler, U.K., Sundquist, W.I., and Aiken, C. 2002. Formation of a human immunodeficiency virus type 1 core of optimal stability is crucial for viral replication. J. Virol. 70 8645–8652. [DOI] [PMC free article] [PubMed] [Google Scholar]
- Freskgård, P.-O., Mårtesson, L.-G., Jonasson, P., Jonsson, B.-H., and Carlsson, U. 1994. Assignment of the contribution of the tryptophan residues to the circular dichroism spectrum of human carbonic anhydrase II. Biochemistry 33 14281–14288. [DOI] [PubMed] [Google Scholar]
- Gamble, T.R., Vajdos, F.F., Yoo, S., Worthylake, D.K., Houseweart, M., Sundquist, W.I., and Hill, C.P. 1996. Crystal structure of human cyclophylin A bound to the amino terminal domain of HIV-1 capsid. Cell 87 1285–1294. [DOI] [PubMed] [Google Scholar]
- Gamble, T.R., Yoo, S., Vajdos, F.F., von Schwedler, U.K., Worthylake, D.K., Wang, H., McCutcheon, J.P., Sundquist, W.I., and Hill, C.P. 1997. Structure of the carboxyl-terminal dimerization domain of the HIV-1 capsid protein. Science 278 849–853. [DOI] [PubMed] [Google Scholar]
- Ganser, B.K., Li, S., Kliskho, V.Y., Finch, J.T., and Sundquist, W.I. 1999. Assembly and analysis of conical models for the HIV-1 core. Science 283 80–83. [DOI] [PubMed] [Google Scholar]
- Garg, R., Gupta, S.P., Gao, H., Babu, M.S., Debnath, A.K., and Hansch, C. 1999. Comparative quantitative structure–activity relationship studies on anti-HIV drugs. Chem. Rev. 99 3525–3601. [DOI] [PubMed] [Google Scholar]
- Gitti, R.K., Lee, B.M., Walker, J., Summers, M.F., Yoo, S., and Sundquist, W.I. 1996. Structure of the amino-terminal core domain of the HIV-1 capsid protein. Science 273 231–235. [DOI] [PubMed] [Google Scholar]
- Gross, I., Hohenberg, H., and Kräulisch, H.G. 1997. In vitro assembly properties of purified bacterially expressed capsid proteins of human immunodeficien-cy virus. Eur J. Biochem. 249 592–600. [DOI] [PubMed] [Google Scholar]
- Gross, I., Hohenberg, H., Huckangel, C., and Kräulisch, H.G. 1998. N-terminal extension of human immunodeficiency virus capsid protein converts the in vitro assembly phenotype from tubular to spherical particles. J. Virol. 72 4798–4810. [DOI] [PMC free article] [PubMed] [Google Scholar]
- Hinkle, A., Goranson, A., Butters, C.A., and Tobacman, L.S. 1999. Roles for the troponin tail domain in thin filament assembly and regulation: A deletional study of cardiac troponin T. J. Biol. Chem. 274 7157–7164. [DOI] [PubMed] [Google Scholar]
- Kelly, S.M. and Price, N.C. 2000. The use of circular dichroism in the investigation of protein structure and function. Curr. Protein Peptide Sci. 1 349–384. [DOI] [PubMed] [Google Scholar]
- Kemmink, J. and Creighton, T.E. 1996. The physical properties of local interactions of tyrosine residues in peptides and unfolded proteins. J. Mol. Biol. 245 251–260. [DOI] [PubMed] [Google Scholar]
- Lakowicz, J.R. 1999. Principles of fluorescence spectroscopy, 2nd ed. Plenum Press, New York.
- Li, S., Hill, C.P., Sundquist, W.I., and Finch, J.T. 2000. Image reconstructions of helical assemblies of the HIV-1 CA protein. Nature 407 409–413. [DOI] [PubMed] [Google Scholar]
- Maroun, R.G., Gayet, S., Benleulmi, M.S., Porumb, H., Zaragarian, L., Merad, H., Leh, H., Mouscadet, J.F., Troalen, F., and Fermadjina, S. 2001. Peptide inhibitors of HIV-1 integrase dissociate the enzyme oligomers. Biochemistry 40 13840–13848. [DOI] [PubMed] [Google Scholar]
- Mateu, M.G. 2002. Conformational stability of dimeric and monomeric forms of the C-terminal domain of human immunodeficiency virus. J. Mol. Biol. 318 519–531. [DOI] [PubMed] [Google Scholar]
- Misselwitz, R., Hausdorf, G., Welfe, K., Höhne, W.E., and Welfe, H. 1995. Conformation and stability of recombinant HIV-1 capsid protein p24 (rp24). Biochem. Biophys. Acta 1250 9–18. [DOI] [PubMed] [Google Scholar]
- Muller-Dethlefs, K. and Hozba, P. 2000. Non-covalent interactions: A challenge for experiment and theory. Chem. Rev. 100 143–167. [DOI] [PubMed] [Google Scholar]
- Muñoz, V. and Serrano, L. 1994. Elucidating the folding problem of helical peptides using empirical parameters. Nat. Struct. Biol. 1 399–409. [DOI] [PubMed] [Google Scholar]
- Pace, C.N. and Scholtz, J.M. 1997. Measuring the conformational stability of a protein. In Protein structure, 2nd ed. (ed. T.E. Creighton), pp. 253–259, Oxford University Press, Oxford, UK.
- Pantoliano, M.W., Petrella, E.C., Kwanoski, J.D., Lobanov, V.S., Myslik, J., Graf, E., Carver, T., Asel, E., Springer, A.R., Lane, P., et al. 2001. High-density miniaturized thermal shift assays as a general strategy for drug discovery. J. Biomol. Screening 6 429–440. [DOI] [PubMed] [Google Scholar]
- Piotto, M., Saudek, V., and Sklenar, V. 1992. Gradient-tailored excitation for single-quantum NMR spectroscopy of aqueous solutions. J. Biomol. NMR 2 661–665. [DOI] [PubMed] [Google Scholar]
- Rosé, S., Hensley, P., O’Shanessy, D.J., Culp, J., Debouck, C., and Chaiken, I. 1992. Characterization of HIV-1 p24 self-association using analytical chromatography. Proteins 13 112–119. [DOI] [PubMed] [Google Scholar]
- Simmerling, C.L. and Elber, R. 1995. Computer determination of peptide conformations in water: Different roads to structure. Proc. Natl. Acad. Sci. 92 3190–3193. [DOI] [PMC free article] [PubMed] [Google Scholar]
- Smith, T.J., Krmer, M.J., Luo, M., Vriend, G., Arnold, E., Kamer, G., Rossmann, M.G., McKinlay, M.A., Dian, G.D., and Otto, M.J. 1986. The site of attachment in human rhinovirus 14 for antiviral agents that inhibit uncoating. Science 233 1286–1293. [DOI] [PubMed] [Google Scholar]
- Stanfield, R.L. and Wilson, I.A. 1995. Protein-peptide interactions. Curr. Opin. Struct. Biol. 5 103–113. [DOI] [PubMed] [Google Scholar]
- Stennicke, H.R., Olesen, K., Sørensen, S.B., and Breddam, K. 1997. C-terminal incorporation of fluorogenic and affinity labels using wild-type and mutagenized carboxypeptidase. Anal. Biochem. 248 141–148. [DOI] [PubMed] [Google Scholar]
- Tang, S., Murakami, T., Agresta, B.E., Campbell, S., Freed, E.O., and Levin, J.G. 2001. Human immunodeficiency virus type 1 N-terminal capsid mutants that exhibit aberrant core morphology are blocked in initiation of reverse transcription in infected cells. J. Virol. 75 9357–9366. [DOI] [PMC free article] [PubMed] [Google Scholar]
- Tang, C., Loeliger, E., Kinde, I., Kyere, S., Mayo, K., Barklis, E., Sun, Y., Hunag, M., and Summers, M.F. 2003. Antiviral inhibition of the HIV-1 capsid protein. J. Mol. Biol. 237 1013–1020. [DOI] [PubMed] [Google Scholar]
- Verkhiver, G.M., Bouzida, D., Gehlhaar, D.K., Rejto, P.A., Freer, S.T., and Rose, P.W. 2002. Complexity and simplicity of ligandmacromolecule interactions: The energy-landscape perspective. Curr. Opin. Struct. Biol. 12 197–203. [DOI] [PubMed] [Google Scholar]
- von Schwedler, U.K., Stemmler, T.L., Kliskho, V.Y., Li, S., Albertine, K.H., Davis, D.R., and Sundquist, W.I. 1998. Proteolytic refolding of the HIV-1 capsid protein amino-terminus facilitates viral core assembly. EMBO J. 17 1555–1568. [DOI] [PMC free article] [PubMed] [Google Scholar]
- Waldron, T.T. and Murphy, K.P. 2003. Stabilization of proteins by ligand binding: Application to drug screening and determination of unfolding energetics. Biochemistry 42 5058–5064. [DOI] [PubMed] [Google Scholar]
- Wang, C.T. and Barklis, E. 1993. Assembly, processing and infectivity of human immunodeficiency virus type 1 Gag mutants. J. Virol. 67 4264–4273. [DOI] [PMC free article] [PubMed] [Google Scholar]
- Woody, R.W. 1995. Circular dichroism. Methods Enzymol. 246 34–71. [DOI] [PubMed] [Google Scholar]
- Wüthrich, K. 1986. NMR of proteins and nucleic acids. John Wiley & Sons, New York.
- Zhang, Z.-Y., Poorman R.A., Maggiora, L.L., Heinrikson, R.L., and Kézdy, F.J. 1991. Dissociative inhibition of dimeric enzymes. J. Biol. Chem. 266 15591–15594. [PubMed] [Google Scholar]