

Abstract
Nonspecific lipid transfer proteins (nsLTPs) facilitate the transfer of phospholipids, glycolipids, fatty acids and steroids between membranes, with wide-ranging binding affinities. Three crystal structures of rice nsLTP1 from Oryza sativa, complexed with myristic (MYR), palmitic (PAL) or stearic acid (STE) were determined. The overall structures of the rice nsLTP1 complexes belong to the four-helix bundle folding with a long C-terminal loop. The nsLTP1–MYR and the nsLTP1–STE complexes bind a single fatty acid while the nsLTP1–PAL complex binds two molecules of fatty acids. The C-terminal loop region is elastic in order to accommodate a diverse range of lipid molecules. The lipid molecules interact with the nsLTP1-binding cavity mainly with hydrophobic interactions. Significant conformational changes were observed in the binding cavity and the C-terminal loop of the rice nsLTP1 upon lipid binding.
Keywords: rice nonspecific lipid transfer protein, fatty acid binding, antifungal activity, hydrophobic cavity
Lipid transfer proteins (LTPs) transport lipid molecules across membranes in vitro; however, their in vivo biological role is not clear (Rueckert and Schmidt 1990; Kader 1996). The binding of lipids to LTPs can be both specific and nonspecific. The nonspecific lipid transfer proteins (nsLTPs; Rueckert and Schmidt 1990) have an affinity for a variety of hydrophobic molecules, such as monoacylated and diacylated lipid molecules including fatty acids (Han et al. 2001), fatty acyl CoA (Lerche et al. 1997), lysophos-phatidylcholine (Charvolin et al. 1999), and phosphatidyl-glycerol (Sodano et al. 1997). NsLTPs are ubiquitous proteins that have been found in bacteria, yeast, plants, and animals (Rueckert and Schmidt 1990). They are the major lipid-binding proteins in plants and have been isolated from rice, wheat, barley, maize, peaches, and apricots (Poznanski et al. 1999). NsLTPs involve in the formation of a protective hydrophobic cutin and suberin layers over plant surfaces. These layers prevent water diffusion into the grain and fungal attacks (Kolattukudy 1981; Trevino and O’Connell 1998). Some nsLTPs exhibit antimicrobial activity (Douliez et al. 2000a), such as that reported for the antifungal activity of a rice lipid transfer protein (Ge et al. 2003). NsLTPs are basic proteins (pI 8–10), disulfide-rich and can be divided into two subfamilies, nsLTP1 (molecular weight ~9 kDa) and nsLTP2 (molecular weight ~7 kDa; Kader 1996). It has been proposed that nsLTP1s transport cutin monomers while nsLTP2s are involved in the conveyance of the more rigid suberin monomers (Douliez et al. 2000a).
Additional biological functions have been suggested for nsLTPs. They might participate in the transport of phospholipids from liposomes or microsomes to mitochondria (Breu et al. 1989) and regulate the beta-oxidation of fatty acids in glyoxysomes (Tsuboi et al. 1992). NsLTPs share the same biological receptor with elicitins that bind sterol molecules and are known elicitors of plant defense (Blein et al. 2002). A putative lipid transfer protein from Arabidopsis has been implicated in the signaling pathway of a plant defense system that resists avirulent and virulent pathogens (Maldonado et al. 2002). Moreover, nsLTP1s can be upsed as carriers and transporters in drug delivery applications (De Wolf and Brett 2000; Pato et al. 2001).
Plant nsLTP1s have high sequence identity (Fig. 1 ▶). There are two highly conserved regions (40T/S-X-X-D-R/K44 and 78P-Y-X-I-S82 of rice nsLTP1; Douliez et al. 2000a) that contribute significantly to lipid binding. The binding property of wheat nsLTP1 for various lipid molecules has been investigated with fluorescence spectroscopy (Douliez et al. 2000b). Several crystal and solution structures of unliganded and liganded nsLTP1s have also been elucidated (Shin et al. 1995; Lee et al. 1998; Lerche and Poulsen 1998; Charvolin et al. 1999; Han et al. 2001). They all share a common protein fold with a four-helix bundle structure. The crystal structure of unliganded rice nsLTP1 has the same overall structure as that of other nsLTP1s but a relatively smaller hydrophobic cavity (Lee et al. 1998). However, no liganded rice nsLTP structure has ever been reported. In order to understand the lipid-binding properties of rice nsLTP1, we determined the rice nsLTP1 crystal structures in complex with myristic, palmitic, or stearic acid.
Figure 1.

Amino acid sequence alignment of five plant nsLTP1s. Residues boxed in red are the conserved residues in all five proteins. Two consensus regions, T/S-X-X-D-R/K and P-Y-X-I-S, are underlined. Green cylinders indicate four α-helices. The hydrogen bonds (black) and van der Waals forces (white) are labeled as following: ♦/⋄: residues interact with MYR; ▴/▵: residues interact with PAL1; ▪/□: residues interact with PAL2; •/○: residues interact with STE.
Results and Discussion
Overall structures of the rice nsLTP1 complexes
The rice nsLTP1 complexes share the structure of a four-helix bundle (H1 through H4) with a long C-terminal segment (residue numbers 72–91; Fig. 2A–C ▶). They fold into a compact domain of approximate 34 Å × 25 Å × 22 Å with four disulfide bonds. Noticeably, these structures have a large internal hydrophobic cavity where the lipids bind. One lipid molecule was found in the nsLTP1–MYR and the nsLTP1–STE complexes, while two lipid molecules (PAL1 and PAL2) were identified in the nsLTP1–PAL complex (Fig. 2A–C ▶). There is one molecule per asymmetric unit for the nsLTP1–MYR and nsLTP1–PAL complexes while two molecules (nsLTP1–STE A and nsLTP1–STE B) per asymmetric unit were found for the nsLTP1–STE complex. The well-defined electron density map of myristic, palmitic, and stearic acids from the rice nsLTP1 complexes are shown in Figure 2 ▶, D–F.
Figure 2.

The overall structures of the rice nsLTP1 complexes: (A) nsLTP1–MYR, (B) nsLTP1–PAL, and (C) nsLTP1–STE. The 2|Fo| − |Fc|| omit electron density maps of the rice nsLTP1 complexes: (D) myristic acid of the nsLTP1–MYR complex, (E) two palmitic acids (PAL1 & PAL2) of the nsLTP1–PAL complex, and (F) two stearic acids (STE A & STE B) of the nsLTP1–STE complex. The lipid coordinates were omitted in the phase calculation. The omit maps were contoured at the 1.0 σ level.
Lipid binding of the rice nsLTP1 complexes
The superimposed images of unliganded and liganded nsLTP1s are presented in Figure 3A ▶. The rice nsLTP1 complexes bind lipid molecules with a tunnel-like hydrophobic pocket surrounded by the C-terminal loop and the four α-helices. The hydrocarbon tails of the lipids are inserted into the hydrophobic cavity of nsLTP1 while the head groups of the lipids protrude out of the binding pocket and point towards the solvent. The central regions (about ten aliphatic carbons) of MYR, PAL1, and STE (except PAL2) are superimposed well in Figure 3B ▶. However, their head groups have different orientations. The head groups of MYR and PAL1 are more exposed to the solvent than that of STE by 4.6–5.9 Å STE is also farther inside of the binding pocket (~6.6Å), since it has a longer fatty acyl chain.
Figure 3.
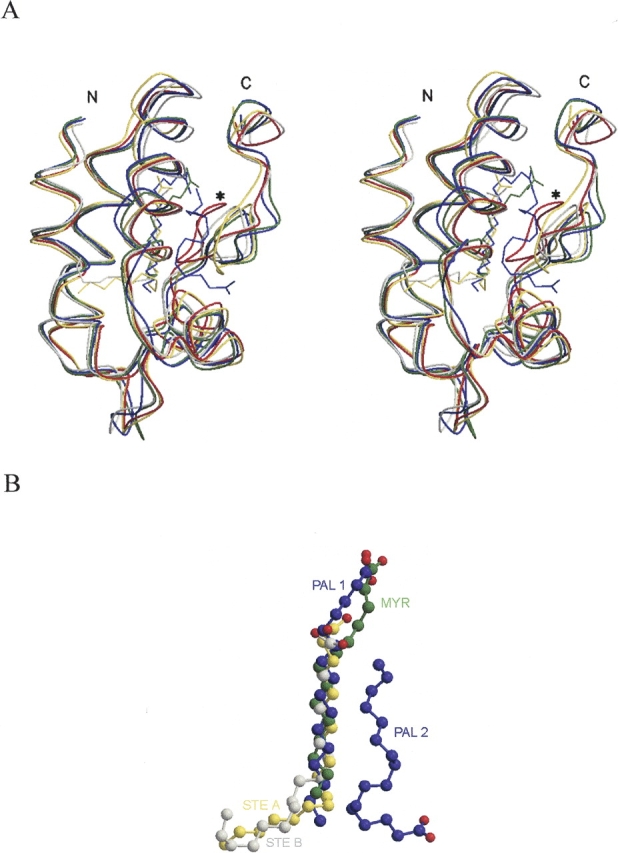
(A) Stereo drawing of the superimposition of the unliganded rice nsLTP1 (PDB:1rzl) and the four liganded rice nsLTP1 complex structures (nsLTP1–MYR, nsLTP1–PAL, and nsLTP1–STE A, and nsLTP1–STE B). Unliganded rice nsLTP1 is colored in red and liganded nsLTP1 complexes are colored in green (the nsLTP1–MYR complex), blue (the nsLTP1–PAL complex), yellow (the nsLTP1–STE complex-A molecule), and light gray (the nsLTP1–STE complex-B molecule). The most diverse C-terminal loop of unliganded rice nsLTP1 is labeled in start. (B) The superimposition of four fatty acid ligands (myristic, palmitic, and stearic acids) from the liganded rice nsLTP1 complexes.
Bulk hydrophobic interactions are required for lipid binding in the rice nsLTP1 complexes. Most hydrophobic interactions are attributed to two regions of the rice nsLTP1: One locates in helices H2 and H3 while the other situates at the end of helix H4 and the C-terminal loop. Detail lipid–protein hydrophobic interactions are summarized in Table 1. Leu51 and Ile81 contribute the most to these hydrophobic interactions. Notably, Ile81 interacts with the most aliphatic carbons of PAL2. Residues Val10, Leu34, Lys35, Ala38, Arg44, Ala66, Ile69, Val77, Pro78, and Tyr79 also form van der Waals interactions with lipid molecules (except PAL2, which orients in an opposite direction). The hydrophobic contacts of the rice nsLTP1 complexes are illustrated by LIGPLOT (Wallace et al. 1995) in Figure 4 ▶. These residues are distributed evenly through out the protein molecule and are not necessarily conserved among plant nsLTP1s (Fig. 1 ▶).
Table 1.
Hydrophobic interactions (≤4.5Å) of three rice nsLTP1-lipid complexes
| Fatty acid | NsLPT1-MYR | NsLTP1-PAL1 | NsLTP1-PAL2 | NsLTP1-STE A | NsLTP1-STE B |
| C1 | K35, P78 | K35, P78 | A63, A66, I81, S82, A83 | K35, A38, R44 | K35, A38, Y79 |
| C2 | K35, P78 | K35, A38, R44, P78 | A63, A66, I81, A83 | L34, K35 | V77,Y79 |
| C3 | R44, P78 | K35, A38, R44, P78 | A66, I81, A83 | V77, Y79 | L34, L51, V77, Y79 |
| C4 | K35, A38, R44, V77, P78 | K35, A38, R44 | A66 | V31, L34, L51 | V31, L51, V77, Y79, I81 |
| C5 | V77, Y79 | L34, K35, A38, R44 | I81 | L51, V77, Y79 | V31, L34, L51, I81 |
| C6 | V77 | L34, K35 | L51, I81 | V31, L51 | V31, L51, P70, I81 |
| C7 | L34 | L34, K35 | L51, I81 | L51, I81 | L51, I81 |
| C8 | V31, L34, I81 | L34, V77, I81 | I81, S82, A83 | V10, L51, I69, I81 | A66, I69, I81 |
| C9 | V31, L34 | L34 | T80, I81, S82, A83, I85 | I69, I81 | A66, I69, I81 |
| C10 | L51, I81 | I81 | S82, I85 | C13, I69, I81 | V10, C13, I69 |
| C11 | V10, V31, L51, I81 | V10, L51, I81 | C48, L51, I85 | A17, A66, I69, I81 | V10, C13, I69 |
| C12 | V10, I69, V31 | V10, L51, I81 | L51, T80, I81 | A55, I81 | V10, A54, I58 |
| C13 | V10, I69, I81 | V10, L51, I69 | L51, I81 | A55, I58 | V10, A54, A55, I58 |
| C14 | V10, I69 | I69, I81 | V77, Y79, I81 | A17, I58 | V10, A54, I58 |
| C15 | C13, I69 | V77, I81 | V10, A54, I58 | L14, I58 | |
| C16 | A17, A66, I69 | R44 | V10, L14, I58 | V10, G11, L14 | |
| C17 | V10, G11, L14 | A7, G11 | |||
| C18 | G11, L14 | A7, V10, G11 |
Figure 4.
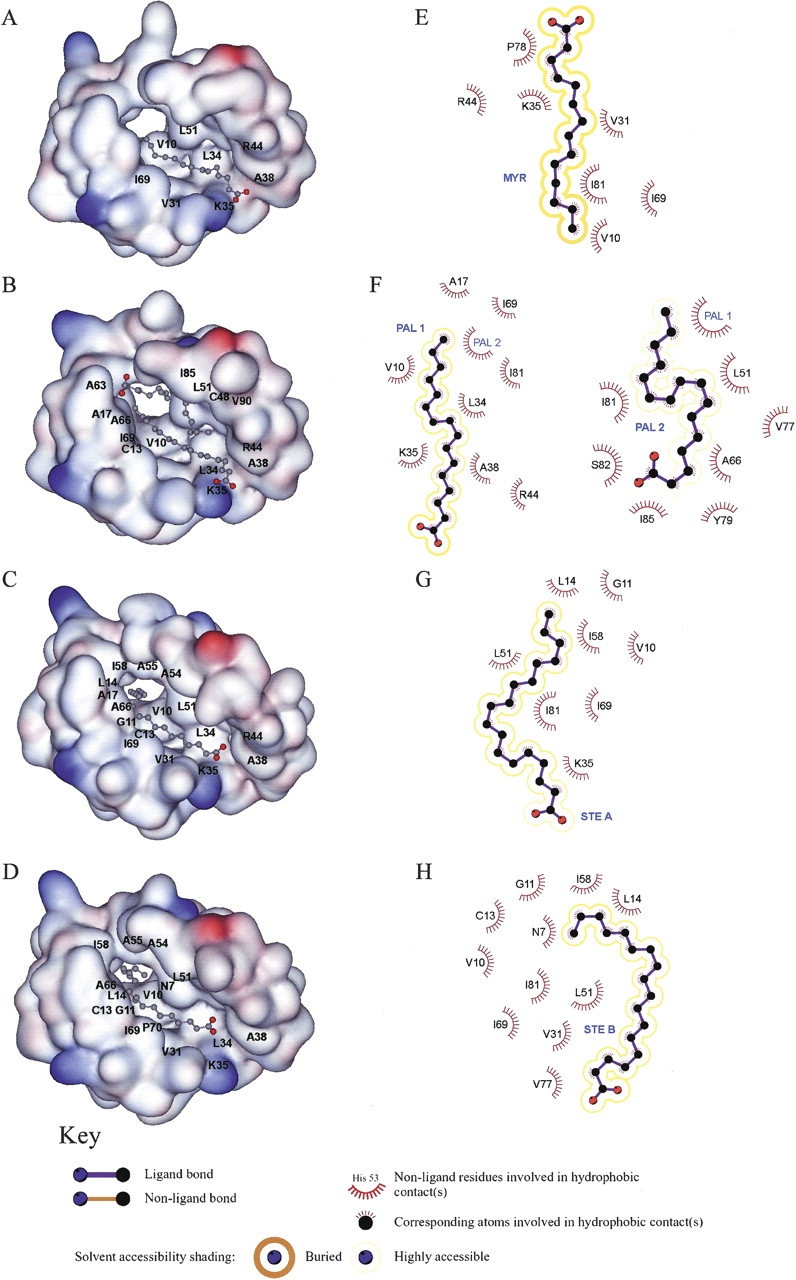
(A–D) The molecular surface of the rice nsTLP1 complexes (nsLTP1–MYR, nsLTP1–PAL1 & 2, and nsLTP1–STE A & B) drawn by DS ViewerPro, colored according to the electrostatic potential, ranging from blue to red (−10.0 to +10.0). Residues 77–82 were removed to show the hydrophobic cavity. Labeled residues are those of rice nsLTP1 participating in hydrophobic interactions between protein and fatty acids as shown in Table 1. (E–H) A representation of the hydrophobic interactions between rice nsLTP1 and fatty acids (MYR, PAL, STE A, and STE B) by LIGPLOT (Wallace et al. 1995).
For some plant nsLTP1 complexes, the highly conserved Arg44 and Tyr79 (number according to the rice sequence) form hydrogen bonds with the carboxylate groups of fatty acids (Charvolin et al. 1999; Douliez et al. 2000a; Han et al. 2001). Surprisingly, Arg44 is not essential while Tyr79 interacts with some of the lipid head groups in our rice nsLTP1 complexes (Fig. 5 ▶). In the nsLTP1–MYR complex, instead of protein residues, two water molecules interact with the carboxylate group of MYR (Fig. 5A ▶). For the nsLTP1–PAL complex, Lys35 forms hydrogen bonds with the carboxylate group of PAL1 (Fig. 5B ▶) and this residue is not conserved among plant nsLPT1s (Fig. 1 ▶). Both Ala83 and Ile81 form hydrogen bonds with the head group of PAL2 (Fig. 5C ▶). In the nsLTP1–STE B complex, residues Tyr79 and Lys35 interact with the head group of STE B (Fig. 5D ▶). Perceptibly, STE A does not have any hydrogen-bond interaction in the nsLTP1–STE A complex. Hence, the hydrophilic interactions between the lipid molecules and protein are diverse in these rice nsLTP1 complexes. Tyr79, as found in other plant nsLTP1 complexes, participates only in the binding of STE B in the nsLTP1–STE B complex. We suggest that hydrophilic interactions are crucial to some but not all of the lipid bindings in the rice nsLTP1 complexes.
Figure 5.

Hydrogen bond interactions between the head group of fatty acid and the rice nsLTP1: (A) the myristic acid (MYR) in the nsLTP1–MYR complex, (B) the first palmitic acid (PAL1) in the nsLTP1–PAL complex, (C) the second palmitic acid (PAL2) in the nsLTP1–PAL complex, and (D) the stearic acid (STE B) in the nsLTP1–STE complex.
Two lipid-binding sites of the rice nsLTP1–PAL complex
Dual lipid-binding sites (PAL1 and PAL2) are observed in the rice nsLTP1–PAL complex (Fig. 2B ▶). A similar lipid-binding mode has been found in the wheat nsLTP1–LMPC (lyso-myristoyl-phosphatidylcholine) complex (Charvolin et al. 1999). PAL1 is located in a position similar to those of other nsLTP1 complexes in single lipid-binding mode (Shin et al. 1995; Lee et al. 1998; Lerche and Poulsen 1998; Charvolin et al. 1999; Han et al. 2001). PAL2 is bound adjacent to PAL1 in an opposite orientation. The well-defined electron densities of PAL1 and PAL2 show the two-alkyl chains of the palmitic acids (Fig. 2E ▶). They buried inside the hydrophobic binding cavity in a stable conformation with averaged B-factor of 22.8 Å2 and 33.6 Å2 for PAL1 and PAL2, respectively. PAL1 and PAL2 are oriented approximately anti-parallel and lined up head to tail inside the binding pocket of nsLTP1. They form significant hydrophobic interactions with nsLTP1 and have similar numbers of van der Waals interactions (Fig. 4B, F ▶; Table 1).
Unliganded and liganded rice nsLTP1s
The hydrophobic cavity of unliganded rice nsLTP1 is occupied by two water molecules and considerably smaller than that of other nsLTP1s (Lee et al. 1998). In our study, the binding pockets of the liganded rice nsLTP1 complexes are fully occupied by lipid molecules with no observable solvent molecule.
Structural superimposition among unliganded and liganded rice nsLTP1s (Fig. 3A ▶) gives a Cα r.m.s. deviation of 1.59, 1.65, 1.19, and 1.22 Åfor the nsLTP1–MYR, the nsLTP1–PAL, the A and B molecules of the nsLTP1–STE complexes, respectively. The nsLTP1–PAL complex binds two lipid molecules and has the biggest structural deviation from the unliganded nsLTP1. The nsLTP1–STE complexes have the smallest Cα r.m.s. deviation among the three rice nsLTP1 complexes. This might be due to the fact that the STE ligands are completely buried inside the protein-binding pocket and have the most van der Waals interactions (Table 1). The major structural difference between liganded and unliganded rice nsLTP1s is localized in the C-terminal loop region (residue numbers 77–82; Fig. 3A ▶). The C-terminal loop points toward the hydrophobic cavity and blocks the lipid-binding pocket in the unliganded rice nsLTP1.
Based on the unliganded rice nsLTP1 structural model, Arg44, Tyr79, and Ile81 have been inferred to be directly involved in lipid binding (Lee et al. 1998). Indeed, these residues exhibit significant structural deviations between the liganded and the unliganded rice nsLTP1s (Fig. 6 ▶). These conformational changes are necessary because they create more space to accommodate the lipid molecules. Arg44 is within the conserved motif (40T/S-X-X-D-R/K44) of helix H3 and located close to the head group of the lipid. Tyr79 and Ile81 are in the other conserved region (78P-Y-X-I-S82) of the C-terminal loop.
Figure 6.
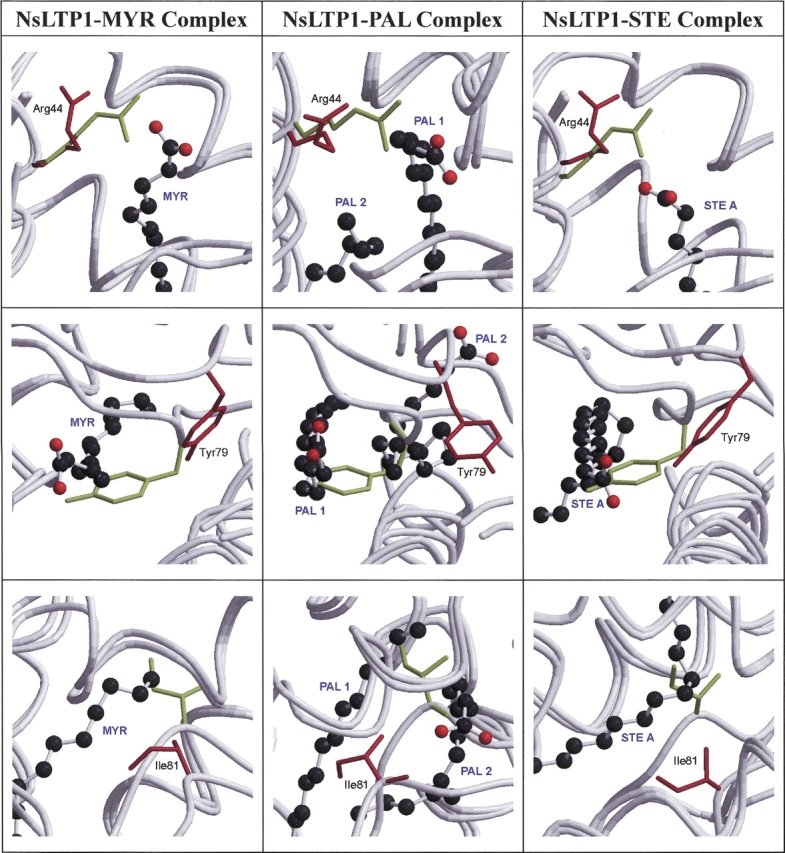
The superimpositions between the unliganded (green) and liganded (red) rice nsLTP1s of the three key residues (Arg44, Tyr79, and Ile81), which are involved in the lipid binding. The lipid molecules are represented as ball-and-stick models.
In the unliganded rice nsLTP1, Arg44 partly blocks the entrance of the lipid molecule. However, Arg44 moves away from the binding pocket in the liganded rice nsLTP1s (Fig. 6 ▶). The distances between Arg44 and the fatty acids increase from the unliganded to liganded states: 1.51 to 3.88 Å (Arg44 NH1–MYR O1), 2.33 to 4.34 Å (Arg44 NH1–PAL1 O1), and 4.25 to 6.16 Å (Arg44 NH1–STE A O1; Fig. 6 ▶). Arg44 acts as a switch at the entrance to let the lipid molecules to access the binding pocket. Since the STE molecule of the nsLTP1–STE complex is bound more inside the binding pocket, it has a longer distance between Arg44 NH1–STE A O1. Arg44 forms hydrogen bonds with the head group of lipid molecules in plant nsLPT1 complexes. However, similar hydrogen bonding is missing from the rice nsLPT1 complexes.
Residue Tyr79 has been found to be the key residue in the lipid binding of plant nsLTP1s (Lee et al. 1998; Charvolin et al. 1999; Han et al. 2001). In the unliganded rice nsLTP1, Tyr79 locates around the middle of the binding pocket. It segments the binding pocket into two and totally breaks down the lipid-binding environment (Fig. 6 ▶). In the liganded rice nsLTP1s, Tyr79 orientates away from the binding pocket in order to create a binding site. The distances between Tyr79 and the fatty acids change from the unliganded to liganded states: 0.68 to 6.42 Å (Tyr79 CE1–MYR C7), 0.89 to 10.30 Å (Tyr79 OH–PAL1 C5), and 0.92 to 4.90 Å (Tyr79 OH–STE A C2; Fig. 6 ▶). This conformational change creates a binding pocket for the occupation of the lipid molecule. In the nsLTP1–PAL complex, Tyr79 has to shift much further in order to accommodate the second lipid molecule (PAL2).
In the unliganded rice nsLTP1, Ile81 is situated near the bottom of the lipid-binding pocket and interferes with lipid binding. In the liganded rice nsLTP1, Ile81 has to readjust so as not to block the lipid binding (Fig. 6 ▶). The distances between Ile81 and fatty acids differ from the unliganded to liganded states: 0.84 to 6.56 Å (Ile81 CD1– MYR C14), 0.48 to 7.59 Å (Ile81 CD1–PAL1 C15), and 1.01 to 4.83 Å (Ile81 CB–STE A C12; Fig. 6 ▶). Upon binding, Ile81 is involved in significant van der Waals interactions with lipid molecules in these three rice nsLTP1 complexes (Table 1).
The structural differences between the single (the nsLTP1–MYR and nsLTP1–STE complexes) and dual (the nsLTP1–PAL complex) binding modes of the rice nsLTP1 complexes appear to be minor (Fig. 3 ▶). Even though the rice nsLTP1 is in a single binding mode in the nsLTP1–MYR and nsLTP1–STE complexes, the space corresponding to the second PAL2 binding site in the nsLTP1–PAL complex is not blocked. Therefore, the second lipid-binding site (such as PAL2) of the rice nsLTP1 complex is probably available even in the single lipid-binding mode. The filling of the second lipid-binding site possibly depends on the availability and concentration of the lipids.
The hydrophobic cavity of rice nsLTP1
The van der Waals volumes of the hydrophobic cavities of the rice nsLTP1 complexes were measured by CASTp (Liang et al. 1998) and the numbers obtained are: 1082 Å3 for the nsLTP1–MYR complex, 1345 Å3 for the nsLTP1–PAL complex, and 783 Å3 and 515 Å3 for the nsLTP1–STE complex A and B molecules. In these calculations, the fatty acid has been removed from the binding cavity. The hydrophobic cavity of unliganded rice nsLTP1 is only 249 Å3, small and discontinuous (Lee et al. 1998). The difference in the van der Waals volume of the hydrophobic cavity between unliganded and liganded rice nsLTP1 is noteworthy in that it displays an elasticity of the rice nsLTP1 for forming complexes. The nsLTP1–PAL dual lipid-bound complex has the biggest hydrophobic cavity among the three rice nsLTP1 complexes. However, it is only slightly bigger than that of the nsLTP1–MYR complex, a single lipid-bound complex. The conformational change between the unliganded and liganded rice nsLTP1s is more significant than that between the single and dual lipid-binding modes of rice nsLTP1 complexes.
Among these three complexes in this study, the nsLTP1-STE complex has the smallest hydrophobic cavity and the strongest interaction between the ligand and the protein. Probably STE has the longest aliphatic chain among the three fatty acid molecules. There are two molecules per asymmetric unit in the nsLTP1–STE complex and each molecule binds one fatty acid. STE A and STE B are the two fatty acids observed in the asymmetric unit for two nsLTP1 molecules. The tails of STE A and STE B (C17–C18) are in different orientations (Figs. 2F ▶, 3B ▶). STE A stretches out of the binding pocket and has fewer ligand–protein interactions than those detected for STE B (Table 1). In contrast, the tail of STE B folds back and form several extra interactions with the rice nsLTP1 (Table 1). It implies that the STE B molecule in the nsLTP1–STE complex has the most favorable lipid-binding conformation among the rice nsLTP1 complexes.
Comparisons with other plant nsLTP1s
Several plant nsLTP1 complexes, such as the barley and maize nsLTP1 complexes, have been reported in the single lipid-binding mode (Lerche and Poulsen 1998; Han et al. 2001). These structures are similar to the rice nsLTP1s in this study and can be superimposed (Fig. 7A, B ▶). The four α-helices (H1–H4) of nsLTP1s are almost aligned. The major conformational disparities occur in loop 1 (between helix H1–H2), loop 3 (between helix H3–H4), and the C-terminal loop of the proteins. The Cα r.m.s. displacement between the rice nsLTP1–MYR and the barley–PAL complex (solution structure) is 2.12 Åand that for the rice nsLTP1–MYR and the maize–PAL complex (crystal structure) is 1.24Å. All lipids bind in a similar position of the nsLTP1-binding pocket. The central hydrophobic parts (about seven aliphatic carbons) of the lipids are overlapped well, however the head groups display various orientations. These structural variations do not affect lipid binding, since hydrophobic interactions within the pocket contribute the main adhesion force.
Figure 7.
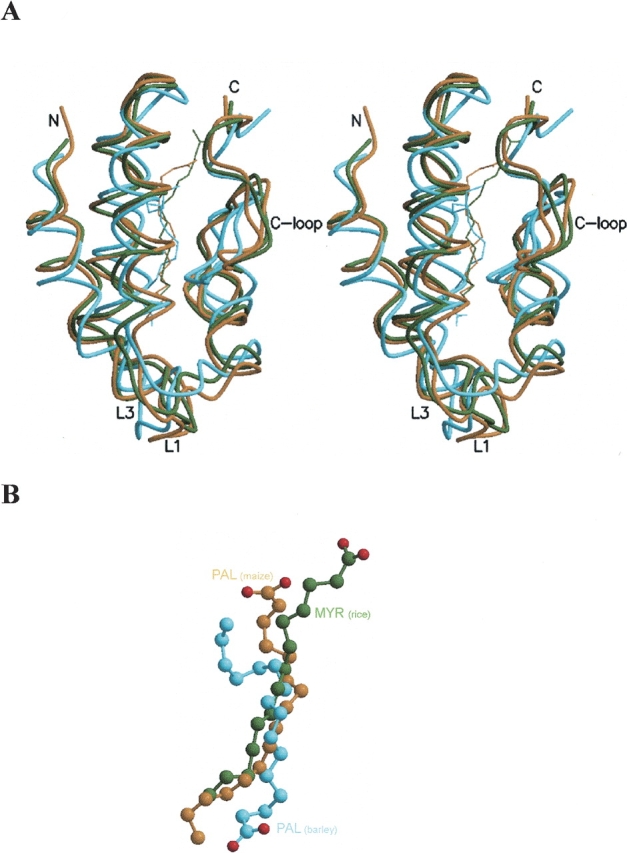
(A) Stereo drawing shows the superimposition of three plant nsLTP1 complexes of the single lipid-binding mode: rice nsLTP1–MYR (this study, green), barley nsLTP1–PAL (PDB: 1be2, cyan), and maize nsLTP1–PAL (PDB: 1mzm, gold) complexes. (B) The superimposition of the ligands (myristic and palmitic acids) of these plant nsLTP1 complexes.
Previous studies have suggested that plant nsLTP1s have a small hydrophobic cavity in the unliganded state and enlarged conformationally during complex formation (Lee et al. 1998). Indeed, both rice (249 Å3) and barley nsLTP1s (73 Å3) have a small hydrophobic cavity in the unliganded state. The barley nsLTP1–PCoA complex (1jtb.pdb; Lerche et al. 1997) has a binding pocket of 884 Å3. In this study, the cavity of the rice nsLTP1 has increased to 1354 Å3 upon PAL binding. It is even larger than that of the wheat nsLTP1–LMPC (1150 Å3) which is also a dual lipid-binding complex (1bwo.pdb; Charvolin et al. 1999). Interestingly, the rice nsLTP1–STE complex has a hydrophobic cavity of 515 Å3. It is even smaller than that of the unliganded maize nsLTP1 (526 Å3; Han et al. 2001), in spite of the fact that its ligand (STE, C18) has the longest aliphatic chain. We speculate that the volume of the binding cavity of the rice nsLTP1 complex depends on the lipid-binding situation. A lipid with a longer aliphatic chain binds more tightly with the protein and has a smaller binding cavity volume.
Dual lipid biding in rice and wheat nsLTP1 complexes
In forming the rice nsLTP1–PAL complex, a higher molar ratio of protein to lipid (1:4) was used and a dual lipid-binding mode was observed. Similarly, using a molar ratio of 1:4 (protein:lipid) led to the best crystal formation of a wheat nsLTP1–LMPC complex (Charvolin et al. 1999), and the dual lipid-binding mode was detected. However, maize nsLTP1 was complexed with various lipid molecules at molar ratios 1:1–1.5 and the dual lipid-binding mode was not observed (Han et al. 2001).
The rice nsLTP1–PAL (this study) and the wheat nsLTP1–LMPC complexes (Charvolin et al. 1999) are superimposed and presented in Figure 8A ▶. The ligands, PALs and LMPCs, are located in similar positions but orientated in opposite directions (Fig. 8B ▶). Even though LMPC is much longer than PAL, their corresponding aliphatic chains are in the same location and both proteins use similar hydrophobic residues in lipid binding. Several lipid–lipid interactions have been found in both complexes. Fifteen van der Waals interactions (≤4.5Å) can be detected in the rice nsTLP1–PAL complex. However, only three interactions were found in the wheat nsLTP1–LMPC complex (Fig. 8C ▶). These interactions might be important for the dual lipid-binding mode in nsLTP1s, since two lipid molecules have to share one binding pocket. The closest distance between the two lipid molecules is 3.2 Åand 4.0 Åin the rice nsTLP1–PAL and the wheat nsTLP1–LMPC complexes, respectively.
Figure 8.

(A) Stereo drawing shows the superimposition of two nsLTP1 complexes of the dual lipid-binding mode: rice nsLTP1–PAL (this study, blue) and wheat nsLTP1–LMPC (PDB: 1bwo, green). (B) The superimposition of LMPC and PAL molecules of two nsLTP1 complexes. (C) Lipid–lipid hydrophobic interactions of LMPCs (left) and PALs (right). Van der Waals interactions (3.0–4.5Å) are depicted by dotted lines.
The PAL1 binding site is common to the single lipid-binding nsLTP1 complexes and has a lower temperature factor than PAL2 (22.8 Å2 and 33.6 Å2 for PAL1 and PAL2). These results imply that PAL1 has a higher affinity for the protein than PAL2. Obviously, PAL1 is the primary binding site for the dual lipid-binding mode of the rice nsLTP1.
Conclusion
Three rice nsLTP1 crystals in complex with myristic, palmitic or stearic acids were obtained. The proteins fold into four α-helices and a long C-terminal loop region. They share a common structural fold with other plant nsLTP1s. The structural flexibility of the C-terminal loop facilities the binding of various lipid molecules to the rice nsLTP1. The protein has a tunnel-like hydrophobic cavity with space sufficient for the binding of one or two lipid molecules. A single and a dual lipid-binding mode are identified for the nsLTP1–PAL complexes. Binding of the second lipid molecule possibly depends on the availability of the lipids during complex formation. Hydrophobic interactions are the major forces in lipid binding, which is also stabilized by the hydrophilic interactions between the head group of the lipid molecule and the protein. These hydrophilic interactions are crucial to some but not all of the lipid bindings in the rice nsLTP1 complexes. Our results indicate that structural deviations between the single and dual lipid-binding modes of rice nsLTP1s are minor. However, the conformational changes between unliganded and liganded rice nsLTP1s are significant.
Materials and methods
Isolation and purification of rice nsLTP1
NsLTP1 protein was isolated and purified according to Liu et al. (Liu et al. 2002). Briefly, rice bran was extracted with sulfuric acid. The crude extracts were purified with a cation exchange column (Sephadex c-25) that was eluted with 1 M NaCl. NsLTP1s were then separated with a C18 reverse-phase semi-preparative column (Cosmosil) using acetonitrile containing 0.1% (v/v) trifluoroacetic acid as the mobile phase.
Crystallization of rice nsLTP1 complexes
The concentration of the rice nsLTP1 used in crystallization was 20 mg/mL. To prepare the nsLTP1–lipid complexes, fatty acids were dissolved in methanol, and then added to protein solutions at various molar ratios. Three fatty acids, myristic (C14:0), palmitic (C16:0), and stearic (C18:0) acids were used to form the nsLTP1 complexes. Palmitic and stearic acids belong to the cutin monomer C16 and C18 families, respectively. Complex crystals were grown by the hanging drop vapor diffusion method from 45~60% (v/v) polyethylene glycol 600 and 0.2 M ammonium dihydrogen phosphate in a buffer of 0.1 M sodium acetate and pH 5.6. The nsLTP1–MYR (C14) complex crystals were grown at a molar ratio of 1:2 (nsLTP1:myristate), the nsLTP1–PAL (C16) complex crystals were grown at a molar ratio of 1:4 (nsLTP1:palmitate), and the nsLTP1–STE (C18) complex crystals were grown at a molar ratio of 1:1.6 (nsLTP1:stearate).
Data collection for rice nsLTP1 complexes
X-ray diffraction data were collected on a Rigaku R-AXIS IV++ imaging plate system, using CuKα x-ray radiation generated from a Rigaku RU-H3R rotating anode operating at 50 kV and 100 mA. All data sets were indexed, integrated, and scaled by means of DENZO and SCALEPACK software packages (Otwinowski and Minor 1997). The nsLTP1–MYR (C14) complex crystals have the unit-cell parameters of a = 49.65Å, b = 74.49Å, and c = 49.73Å, with a space group C2221 (Table 2). These crystals diffracted to 2.5Å. The VM (Matthews 1968) was calculated to be 2.58 Å3Da−1 and the solvent content was estimated to be 52%, containing one molecule per asymmetric unit. The nsLTP1–PAL (C16) complex crystals have the unit-cell parameters of a =48.03Å, b =72.7Å, and c 349.75Å, with a space group C2221 and diffracted to 2.1 Å (Table 2). The VM (Matthews 1968) was calculated to be 2.41 Å3Da−1 and the solvent content was estimated to be 49%, with one molecule per asymmetric unit. The nsLTP1–STE (C18) complex crystals belong to the space group C2 with cell dimensions of a = 75.94Å, b = 53.8Å, c = 49.08Å, and β = 96.36° (Table 2). The VM (Matthews 1968) of the nsLTP1–STE complex crystal was calculated to be 2.8 Å3Da−1 with 56% solvent content and diffracted to 2.0Å. There are two molecules of the complex per asymmetric unit.
Table 2.
X-ray diffraction statistical data and structure refined data of three rice nsLTP1-lipid complexes
| NsLTP1-MYRc | NsLTP1-PAL | NsLTP1-STE | |
| Crystal system | Orthorhombic | Orthorhombic | Monoclinic |
| Space group | C2221 | C2221 | C2 |
| Unit cell parameters | |||
| a (Å) | 49.65 | 48.04 | 75.94 |
| b (Å) | 74.49 | 72.70 | 53.80 |
| c (Å) | 49.73 | 49.75 | 49.08 |
| α (°) | 90.0 | 90.0 | 90.0 |
| β (°) | 90.0 | 90.0 | 96.36 |
| γ (°) | 90.0 | 90.0 | 90.0 |
| Resolution (Å) | 2.5 | 2.1 | 2.0 |
| Number of reflections collected | 16801 | 26876 | 54089 |
| Number of unique reflections | 3424 | 5340 | 13135 |
| Redundancy of reflection | 4.9 | 5.0 | 4.1 |
| Completeness (%) overall (outmost shell) | 99.9 (100.0) | 99.8 (9.4) | 98 (97.5) |
| I/σ(I) overall (outmost shell)a | 7.0 (2.1) | 24.87 (3.3) | 18.3 (7.5) |
| Rmergeb (%) overall (outmost shell)a | 6.2 (28.3) | 7.2 (59.6) | 5.2 (18.0) |
| R/Rfree (%) | 21.6/28.8 | 22.4/26.5 | 21.7/25.6 |
| Number of used reflections (F > 2σF) | 3154 | 4888 | 12898 |
| Number of atoms (nonhydrogen) | 616 | 616 | 1232 |
| Number of water molecules | 92 | 89 | 189 |
| Number of lipid molecule | 1 | 2 | 2 |
| Averaged B-factor (Å2) | 24.7 | 15.8 | 13.7 |
| Lipid molecules’ B-factor (Å2) | 20.0 | 22.8/33.6 | 28.2/26.8 |
| R.m.s. deviation for bond length (Å) | 0.006 | 0.006 | 0.005 |
| R.m.s. deviation for bond angle (°) | 1.1 | 1.1 | 1.1 |
a Outmost shell for the nsLTP1-MYR complex is 2.50 ~ 2.40Å, for the nsLTP1-PAL complex is 2.18 ~ 2.10Å, and for the nsLTP1-STE complex is 2.07 ~ 2.00Å.
b Rmerge(I) = ∑hkl∑i|Ii − I|/∑hkl∑iI where I is the mean intensity of the ith observation of reflection hkl.
c Data processed by Crystal Clear (Rigaku Corp.).
Structural determination and refinement of rice nsLTP1 complexes
The conformational change between the unliganded and liganded rice nsLTP1 is significant. Therefore, the structure cannot be determined with the unliganded rice nsLTP1 (PDB:1rzl) as a search model by molecular replacement. However, the structural phases of the rice nsLTP1 complexes could be determined using the crystal structure of the maize nsLTP1–PAL complex (PDB:1mzm; Han et al. 2001) as the search model. The AMoRe program (Navaza 1994) was used for the molecular replacement phase determination. The search model was placed in a P1 cell with a = b = c = 90 Åand α = β γ = 90°. Data between 8.0 to 4.0 Åand a Patterson radius of 20 Å were used to calculate the rotation and translation functions. Significant rotation and translation solutions were obtained for the nsLTP1–MYR and nsLTP1–PAL complexes. After rigid body refinement, the correlation coefficients and R-factors were 64.9% and 34.9% for the nsLTP1–MYR complex and 30.7% and 49.1% for the nsLTP1–PAL complex. In the nsLTP1–STE complex, the same search model and similar procedure were applied for structure determination. Since there are two molecules per asymmetric unit in the nsLTP1–STE complex, two solutions were obtained with a correlation coefficient of 44.5% and an R-factor of 37.1%.
Structural model building and refinement were carried out using the XTALVIEW (McRee 1999) and CNS (Brunger 1998) programs. Simulated annealing omit maps were used to reduce the model bias and to determine the lipid positions of these three complex crystals. A bulk solvent mask was calculated to improve the reflection data. The refined structural model of the nsLTP1–MYR complex contains 616 non-hydrogen atoms, one myristic acid molecule and 92 water molecules, with an R-factor of 21.6% and an Rfree of 28.8% at 2.5 Å (Table 2). The refined structural model of the nsLTP1–PAL complex includes 616 nonhydrogen atoms, two palmitic acid molecules and 89 water molecules, with an R-factor of 22.4% and an Rfree of 26.5% at 2.1 Å (Table 2). The refined structural model of the nsLTP1–STE complex contained 1232 nonhydrogen atoms, two stearic acid molecules and 189 water molecules with an R-factor of 21.7% and an Rfree of 25.6% at 2.0 Å (Table 2). The final structure refinement statistics for three complex crystals are summarized in Table 2. The averaged B-factors were 20 Å2 for the MYR in the nsLTP1–MYR complex, 22.8 Å2 and 33.6 Å2 for the PAL1 and PAL2 in the nsLTP1–PAL complex, and 28.1 Å2 and 26.8 Å2 for the STE A and STE B in the nsLTP1–STE complex.
Protein Data Bank accession numbers
The coordinates of the rice nsLTP1 complexes have been deposited in the Protein Data Bank, accession numbers 1uva, 1uvb and 1uvc for the rice nsLTP1–MYR, nsLTP1–PAL and nsLTP1–STE complexes, respectively.
Acknowledgments
This work was supported by grant from National Science Council (NSC-92–3112-B-007–013 to Y.J.S.), Taiwan, Republic of China. We thank Dr. Ming F. Tam for critical reading of the manuscript.
The publication costs of this article were defrayed in part by payment of page charges. This article must therefore be hereby marked “advertisement” in accordance with 18 USC section 1734 solely to indicate this fact.
Abbreviations
DMPG, dimyristoyl-phosphatidylglycerol
LMPC, lysomyristoyl-phosphatidylcholine
LTP, lipid transfer protein
MYR, myristic acid
NMR, nuclear magnetic resonance
NsLTP, nonspecific lipid transfer protein
PAL, palmitic acid
PCoA, palmitoyl coenzyme A
r.m.s., root-mean-square
STE, stearic acid
Article published online ahead of print. Article and publication date are at http://www.proteinscience.org/cgi/doi/10.1110/ps.04799704.
References
- Blein, J.-P., Coutos-Thevenot, P., Marion, D., and Ponchet, M. 2002. From elicitins to lipid-transfer proteins: A new insight in cell signalling involved in plant defense mechanisms. TRENDS Plant Sci. 7 293–296. [DOI] [PubMed] [Google Scholar]
- Breu, V., Guerbette, F., Kader, J.C., Kannangara, C.G., Svensson, B., and Wettstein-Knowles, P. 1989. A 10 kDa barley basic protein transfers phosphatidylcholine from liposomes to mitochondria. Carlsberg Res. Commun. 54 81–84. [Google Scholar]
- Brunger, A.T. 1998. Crystallography & NMR system: A new software suite for macromolecular structure determination. Acta Crystallogr. D Biol Crystallogr. 54 905–921. [DOI] [PubMed] [Google Scholar]
- Charvolin, D., Douliez, J.-P., Marion, D., Cohen-Addad, C., and Pebay-Peyroula, E. 1999. The crystal structure of a wheat nonspecific lipid transfer protein (ns–LTP1) complexed with two molecules of phospholipid at 2.1 Åresolution. Eur. J. Biochem. 264 562–568. [DOI] [PubMed] [Google Scholar]
- De Wolf, F.A. and Brett, G.M. 2000. Ligand-binding proteins: Their potential for application in systems for controlled delivery and uptake of ligands. Pharmacol. Rev. 52 207–236. [PubMed] [Google Scholar]
- Douliez, J.-P., Michon, T., Elmorjani, K., and Marion, D. 2000a. Structure, biological and technological functions of lipid transfer proteins and indolines, the major lipid-binding proteins from cereal kernels. J. Cereal Sci. 32 1–20. [Google Scholar]
- Douliez, J.-P., Michon, T., and Marion, D. 2000b. Steady-state tyrosine fluorescence to study the lipid-binding properties of a wheat non-specific lipid-transfer protein (ns-LTP1). Biochim. Biophys. Acta 1467 65–72. [PubMed] [Google Scholar]
- Ge, X., Chen, J., Sun, C., and Cao, K. 2003. Preliminary study on the structural basis of the antifungal activity of a rice lipid transfer protein. Protein Eng. 16 387–390. [DOI] [PubMed] [Google Scholar]
- Han, G.W., Lee, J.Y., Song, H.K., Chang, C., Min, K., Moon, J., Shin, D.H., Kopka, M.L., Sawaya, M.R., Yuan, H.S., et al. 2001. Structure basis of non-specific lipid binding in maize lipid–transfer protein complexes revealed by high-resolution x-ray crystallography. J. Mol. Biol. 308 263–278. [DOI] [PubMed] [Google Scholar]
- Kader, J.-C. 1996. Lipid-transfer protein in plants. Annu. Rev. Plant Physiol. Plant Mol. Biol. 47 627–654. [DOI] [PubMed] [Google Scholar]
- Kolattukudy, P.E. 1981. Structure, biosynthesis and biodegradation of cutin and suberin. Annu. Rev. Plant Physiol. 32 539–568. [Google Scholar]
- Lee, J.Y., Min, K., Cha, H., Shin, D.H., Hwang, K.Y., and Suh, S.W. 1998. Rice non-specific lipid transfer protein: The 1.6 Åcrystal structure in the unliganded state reveals a small hydrophobic cavity. J. Mol. Biol. 276 437–448. [DOI] [PubMed] [Google Scholar]
- Lerche, M.H. and Poulsen, F.M. 1998. Solution structure of barley lipid transfer protein complexed with palmitate. Two different binding modes of palmitate in the homologous maize and barley nonspecific lipid transfer proteins. Protein Sci. 7 2490–2498. [DOI] [PMC free article] [PubMed] [Google Scholar]
- Lerche, M.H., Kragelund, B.B., Bech, L.M., and Poulsen, F.M. 1997. Barley lipid–transfer protein complexed with palmitoyl CoA: The structure reveals a hydrophobic binding site that can expand to fit both large and small lipid-like ligands. Structure 5 291–306. [DOI] [PubMed] [Google Scholar]
- Liang, J., Edelsbrunner, H., and Woodward, C. 1998. Anatomy of protein pockets and cavities: Measurement of binding site geometry and implications for ligand design. Protein Sci. 7 1884–1897. [DOI] [PMC free article] [PubMed] [Google Scholar]
- Liu, Y.-J., Samuel, D., Liu, C.-H., and Lyu, P.-C. 2002. Purification and characterization of a novel 7-kDa non-specific lipid transfer protein-2 from rice. Biochem. Biophys. Res. Commun. 294 535–540. [DOI] [PubMed] [Google Scholar]
- Maldonado, A.M., Dixon, P.A., Lamb, C.J., and Cameron, R.K. 2002. A putative lipid transfer protein involved in systemic resistance signalling in Arabidopsis. Nature 419 399–403. [DOI] [PubMed] [Google Scholar]
- Matthews, B.W. 1968. Solvent content of protein crystals. J. Mol. Biol. 33 491–497. [DOI] [PubMed] [Google Scholar]
- McRee, D.E. 1999. XtalView/Xfita versatile program for manipulating atomic coordinates and electron density. J. Struct. Biol. 125 156–165. [DOI] [PubMed] [Google Scholar]
- Otwinowski, Z. and Minor, W. 1997. Processing of x-ray diffraction data collected in oscillation mode. Meth. Enzymol. 276 307–326. [DOI] [PubMed] [Google Scholar]
- Pato, C., Borgne, M.L., Baut, G.L., Pape, P.L., Marion, D., and Douliez, J.-P. 2001. Potential application of plant lipid transfer proteins for drug delivery. Biochem. Pharmacol. 62 555–560. [DOI] [PubMed] [Google Scholar]
- Poznanski, J., Sodano, P., Suh, S.W., Lee, J.Y., Ptak, M., and Vovelle, F. 1999. Solution structure of a lipid transfer protein extracted from rice seeds comparison with homologous proteins. Eur. J. Biochem. 259 692–708. [DOI] [PubMed] [Google Scholar]
- Rueckert, D.G. and Schmidt, K. 1990. Lipid transfer proteins. Chem. Phys. Lipids 56 1–20. [DOI] [PubMed] [Google Scholar]
- Shin, D.H., Lee, J.Y., Hwang, K.Y., Kim, K.K., and Suh, S.W. 1995. High-resolution crystal structure of the non-specific lipid-transfer protein from maize seedlings. Structure 3 189–199. [DOI] [PubMed] [Google Scholar]
- Sodano, P., Caille, A., Sy, D., de Person, G., Marion, D., and Ptak, M. 1997. 1H NMR and fluorescence studies of the complexation of DMPG by wheat non-specific lipid transfer protein. Global fold of the complex. FEBS Lett. 416 130–134. [DOI] [PubMed] [Google Scholar]
- Trevino, M.B. and O’Connell, M.A. 1998. Three drought-responsive members of the nonspecific lipid-transfer protein gene family in Lycopersicon pennellii show different developmental patterns of expression. Plant Physiol. 116 1461–1468. [DOI] [PMC free article] [PubMed] [Google Scholar]
- Tsuboi, S., Osafune, T., Nishimura, M., and Yamada, M. 1992. Nonspecific lipid transfer protein in castor bean cotyledon cells: Subcellular localization and a possible role in lipid metabolism. J. Biochem. (Tokyo) 111 500–508. [DOI] [PubMed] [Google Scholar]
- Wallace, A.C., Laskowski, R.A., and Thornton, J.M. 1995. LIGPLOT: A program to generate schematic diagrams of protein–ligand interactions. Protein. Eng. 8 127–134. [DOI] [PubMed] [Google Scholar]