Abstract
An aromatic amino acid is present in the binding site of a number of sugar binding proteins. The interaction of the saccharide with the aromatic residue is determined by their relative position as well as orientation. The position-orientation of the saccharide relative to the aromatic residue was found to vary in different sugar-binding proteins. In the present study, interaction energies of the complexes of galactose (Gal) and of glucose (Glc) with aromatic residue analogs have been calculated by ab initio density functional (U-B3LYP/ 6-31G**) theory. The position-orientations of the saccharide with respect to the aromatic residue observed in various Gal-, Glc-, and mannose–protein complexes were chosen for the interaction energy calculations. The results of these calculations show that galactose can interact with the aromatic residue with similar interaction energies in a number of position-orientations. The interaction energy of Gal–aromatic residue analog complex in position-orientations observed for the bound saccharide in Glc/Man–protein complexes is comparable to the Glc–aromatic residue analog complex in the same position-orientation. In contrast, there is a large variation in interaction energies of complexes of Glc- and of Gal- with the aromatic residue analog in position-orientations observed in Gal–protein complexes. Furthermore, the conformation wherein the O6 atom is away from the aromatic residue is preferred for the exocyclic —CH2OH group in Gal–aromatic residue analog complexes. The implications of these results for saccharide binding in Gal-specific proteins and the possible role of the aromatic amino acid to ensure proper positioning and orientation of galactose in the binding site have been discussed.
Keywords: DFT calculations, GAMESS, U-B3LYP/6-31G**, protein-carbohydrate interactions, saccharide-aromatic residue interactions
The presence of an aromatic amino acid residue (Trp, Phe, or Tyr) near the nonpolar b face of galactose (Gal) is a common feature of Gal-specific proteins (Rini 1995; Drickamer 1997; Elgavish and Shaanan 1997; Sundari and Bala-subramanian 1997; Loris et al. 1998; Rao et al. 1998a; Quiocho and Vyas 1999). The saccharide–aromatic residue interactions are found in the binding sites of proteins with other saccharide specificity also. These interactions have been variously considered as CH/π (Nishio et al. 1995), van der Waals (Quiocho 1989; Toone 1994), or hydrophobic (Elgavish and Shaanan 1997; Sundari and Balasubramanian 1997) in nature. It has been suggested that the aromatic ring provides a geometrically complementary apolar surface for interactions with the saccharides and its π electron cloud interacts favorably with the aliphatic protons of the saccharide that carry a positive partial charge (Weis and Drickamer 1996).
A recent analysis of 18 Gal-specific proteins belonging to seven nonhomologous families showed that the presence of an aromatic residue is one of the two common features shared by these proteins (Sujatha and Balaji 2004). This analysis further revealed that the spatial position-orientation of galactose relative to the aromatic residue varies in these 18 proteins. This observation led to the proposal that the aromatic residue acts as a platform on which galactose has the freedom to move and optimize its interactions with the binding site residues. Based on this, it is inferred here that the interaction energy between the aromatic residue and galactose is comparable in these different spatial position-orientations. To test this inference, single-point energy calculations have been performed for aromatic residue analog–galactose complexes by ab initio density functional (U-B3LYP/6-31G**) treatment (Hohenberg and Kohn 1964) using the software GAMESS (Schmidt et al. 1993).
Visual inspection of the 3D structures of Gal– and Glucose (Glc)–protein complexes using RASMOL (Sayle 1994) or SwissPDBViewer (Guex and Peitsch 1997) shows that the mode of binding of galactose relative to the aromatic residue is different from that of glucose: the C3-H, C4-H, C5-H, and C6-H atoms of galactose interact with the aromatic residue; in the case of glucose, either the C5-H and C6-H atoms or the C1-H, C3-H, C5-H, and/or C4-OH atoms interact with the aromatic residue. The only difference between these two saccharides is in the configuration of the C4 atom: in the 4C1-(D) conformation, the hydroxyl group is equatorial in glucose but axial in galactose. To delineate the effect of changing the orientation of a single —OH group on the energetics of saccharide–aromatic residue interactions, single-point energy calculations were also performed for Glc–aromatic residue analog complexes for identical position-orientations. Calculations were also performed to determine the effect of the three staggered rotamers of the —CH2OH group of galactose on the interaction energy.
The following approach has been used to achieve these objectives.
An analysis of the binding sites of 18 Gal-specific proteins had showed that the galactose binding pocket and main chain atoms N, Cα, C, and O of the aromatic residue are always on opposite sides of the aromatic ring (Sujatha and Balaji 2004). Based on this observation, it was assumed that the main chain atoms N, Cα, C, and O of the aromatic residue make little or no contribution to the interaction energy. Hence, analogs that are identical to the aromatic residue but for the absence of the main-chain atoms N, Cα, C, and O were considered for interaction energy calculations. The analogs are p-hydroxytoluene (pOHTol; for Tyr), toluene (Tol; for Phe), and 3-methylindole (3MeIn; for Trp). The pyranose rings of both β-D-galactose and β-D-glucose (Glc) were considered to be in the preferred and most frequently observed 4C1 conformation.
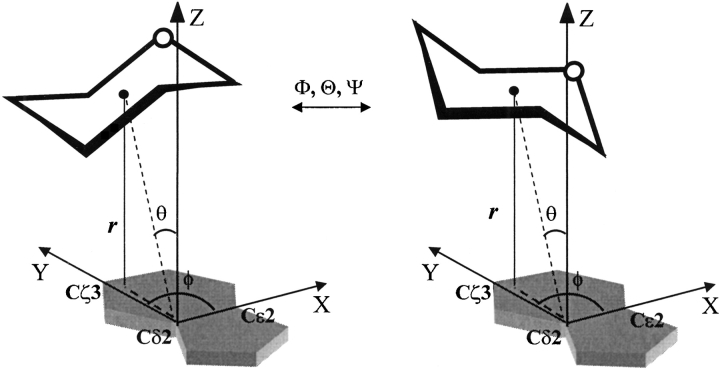
Both the position and the orientation of the saccharide relative to the aromatic residue are key determinants of the interaction energy. This is in contrast to, for example, the metal–aromatic residue interactions that are dependent only on their mutual relative position. The polar coordinates (r,θ,φ) specify the relative position; the center of the pyranose ring has been taken as the reference point for specifying the (r,θ,φ) values in a frame of reference defined within the aromatic residue analog (Table 1). The orientation of the saccharide relative to the aromatic analog has been specified by Euler’s rigid body rotation angles (Φ,Θ,Ψ; Fig. 1 ▶). The angles Φ and Ψ represent rotations around the Z-axis, whereas the angle Θ specifies rotation around the X-axis; the Φ, Θ and Ψ rotations are performed successively (Goldstein 1980).
Table 1.
Definitions of frames of reference for the saccharides and the aromatic analogs
| Aromatic residue/saccharide | Aromatic residue analog | Total no. of atoms | Atom at the origin | Atom along the X-axis | Atom in the XY-plane |
| Tryptophan | 3-Methylindole (3MeIn) | 19 | Cδ2 | Cɛ2 | Cζ2 |
| Phenylalanine | Toluene (Tol) | 15 | Cɛ1 | Cɛ2 | Cδ2 |
| Tyrosine | pHydroxytoluene (pOHTol) | 16 | Cɛ1 | Cɛ2 | Cδ2 |
| β-D-Galactose | — | 24 | C4 | C5 | O5 |
| β-D-Glucose | — | 24 | C4 | C5 | O5 |
Figure 1.
Schematic depicting two orientations of the saccharide relative to the aromatic residue. The saccharide can have an infinite number of orientations relative to the aromatic residue at a given position. These orientations are specified by the euler’s rigid body rotation angles (Φ,Θ, Ψ). Two such orientations are depicted here for illustration. The polar coordinates (r,θ,φ) specify the position of the centroid of the saccharide.
The position and orientation are independent variables: the centroid of the pyranose ring can be located at different positions in space relative to the aromatic residue (variable r,θ,φ) and at each of these positions, the saccharide can assume various different orientations (variable Φ,Θ, Ψ). Hence, only those position-orientations that have been observed in the crystal structures of Gal–, Glc–, and Man–protein complexes have been considered for interaction energy calculations.
A total of 51 position-orientations have thus been derived from protein–saccharide complexes (Table 2). Thirty-seven of the 51 position-orientations are from Gal–protein complexes, whereas the rest are from proteins that are crystallized with either glucose or mannose. Tryptophan occurs in 29 of the complexes, phenylalanine in 10 complexes, and tyrosine in the remaining complexes (Table 2). The interaction energy has been calculated for both Gal– and Glc–aromatic residue analog complexes in all the 51 position-orientations. Henceforth, the various position-orientations are referred to by the PDB ID of the corresponding saccharide–protein complexes for brevity; thus, 1A3K position-orientation refers to the position-orientation of the saccharide relative to the aromatic ring observed in human galectin 3 (PDB ID 1A3K).
Table 2.
Proteins used to derive the position-orientation of the bound sugar relative to the aromatic residue
| PDB ID | Name of the protein | Resolution (Å) |
| Aromatic residue in the binding site: Tryptophan | ||
| Galactose–protein complexes | ||
| Galectins | ||
| 1A3K | Human galectin-3 | 2.1 |
| 1C1L | Congerin I | 1.5 |
| 1GAN | Toad ovary galectin | 2.23 |
| 1SLB | S-lectin | 2.3 |
| 1SLT | S-lectin | 1.9 |
| 1HLC | S-lac lectin | 2.9 |
| 2GAL | Human galectin-7 | 2.0 |
| C-type lectins | ||
| 1AFA | Gal-specific mutant of mannose-binding protein A | 2.0 |
| 1TLG | Tunicate C-type lectin | 2.2 |
| Ricins | ||
| 2AAI | Ricin | 2.5 |
| 1OQL | Mistletoe lectin I | 3.0 |
| 1HWM | Ebulin | 2.8 |
| Legume lectins | ||
| 1HQL | Griffonia simplicifolia lectin-1 | 2.2 |
| 1LED | Lectin IV of Griffonia simplicifolia | 2.0 |
| Neuraminidases | ||
| 1EUU | Neuraminidase | 2.5 |
| Transport proteins | ||
| 1GCA | Periplasmic glucose/galactose receptor | 1.7 |
| 5ABP | L-Arabinose binding protein | 1.8 |
| Toxins | ||
| 1EEF | Heat-labile enterotoxin | 1.8 |
| 1DJR | Heat-labile enterotoxin | 1.3 |
| 1CT1 | Cholera toxin B-pentamer | 2.3 |
| 3CHB | Cholera toxin B-pentamer | 1.25 |
| 1G8Z | Cholera toxin B-pentamer | 2.0 |
| Glucose–protein complexes | ||
| Glycosidases | ||
| 2OVW | Endoglucanase I | 2.3 |
| 1CEL | β1→4 glucan cellobiohydrolase | 1.81 |
| 7CEL | β1→4 glucan cellobiohydrolase | 1.9 |
| 1BG9 | Barley α-amylase | 2.8 |
| 1E5J | Endoglucanase Cel5A | 1.85 |
| 1I8A | Xylanase | 1.9 |
| 1JS4 | Endo/exocellulase | 2.0 |
| Aromatic residue in the binding site: Tyrosine/Phenylalanine | ||
| Galactose–protein complexes | ||
| Enzyme | ||
| 1L7K | Galactose mutarotase | 1.95 |
| Legume lectins | ||
| 1AX1 | Erythrina corallodendron lectin | 1.95 |
| 1BZW | Peanut lectin | 2.7 |
| 2SBA | Soybean agglutinin | 2.6 |
| 1F9K | Winged bean acidic lectin | 3.0 |
| 1WBL | Winged bean lectin | 2.5 |
| 1LTE | Erythrina corallodendron lectin | 2.0 |
| 1G9F | Soybean agglutinin | 2.5 |
| 1CR7 | Peanut lectin | 2.6 |
| 1DZQ | Lectin UEA-II | 2.85 |
| 1QOT | Lectin UEA-II | 3.0 |
| Glycosidase | ||
| 1ISZ | Xylanase | 2.0 |
| Ricin | ||
| 1HWN | Ebulin | 2.8 |
| PDB ID | Name of the protein | Resolution (Å) |
| Other plant lectins | ||
| 1JAC | Jacalin | 2.43 |
| 1JOT | Lectin Mpa | 2.2 |
| Glucose/Mannose–protein complexes | ||
| Glycosidases | ||
| 1BYH | Hybrid β-D-glucan-4-glucanohydrolase | 2.8 |
| 1E55 | β-Glucosidase | 2.0 |
| 1ECE | Endocellulase | 2.4 |
| Legume lectins | ||
| 1LEM | Lentil lectin | 3.0 |
| 1LOA | Lathyrus ochrus lectin | 2.2 |
| 1QMO | FRIL lectin | 3.5 |
| 5CNA | Concanavalin A | 2.0 |
The names of all the proteins and the resolutions to which their 3D structures have been determined have been taken from the Protein Data Bank.
Results
Distribution of positions relative to the aromatic ring
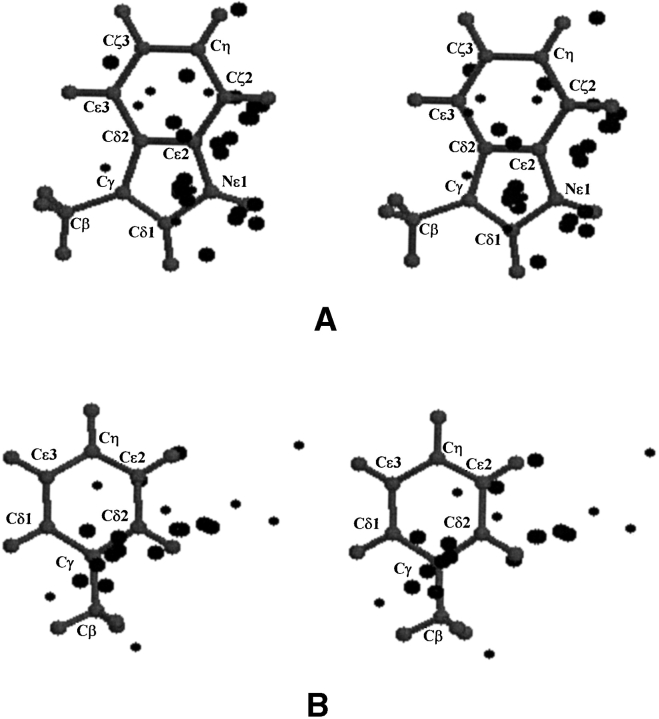
Overall, the different positions considered for interaction energy calculations are well scattered across the plane of the aromatic residue, although a slightly higher density is observed near the Trp:Cδ1 and Phe(Tyr):Cγ atoms (Fig. 2 ▶). The saccharide is present either above or below the plane of aromatic ring in all these position-orientations.
Figure 2.
Stereo diagrams showing the positions (represented as spheres) of the pyranose ring centroid relative to the aromatic residue in the 51 saccharide–protein complexes. Large spheres denote the positions observed in galactose–protein complexes, whereas small spheres denote those observed in glucose– or mannose–protein complexes. (A) The positions observed in proteins that have tryptophan in the binding site are shown with reference to 3-methylindole. (B) The positions observed in proteins that have a tyrosine or phenylalanine in the binding site are shown with reference to toluene.
Apolar hydrogen atoms mediate the interactions of saccharide with the aromatic residue
Visual inspection of the various saccharide–aromatic residue analog complexes shows that the apolar hydrogen atoms of the saccharide are in close proximity of the aromatic residue in both Gal– and Glc–aromatic residue analog complexes. The C3-H, C4-H, C5-H, and C6-H atoms interact with the aromatic residue in a large number of the position-orientations observed in Gal–protein complexes (Fig. 3A, B ▶); in contrast, the C5-H/C6-H atoms or the C1-H, C3-H, O4-H, and C5-H atoms interact in the position-orientations observed in Glc/Man–protein complexes (Fig. 3C ▶).
Figure 3.
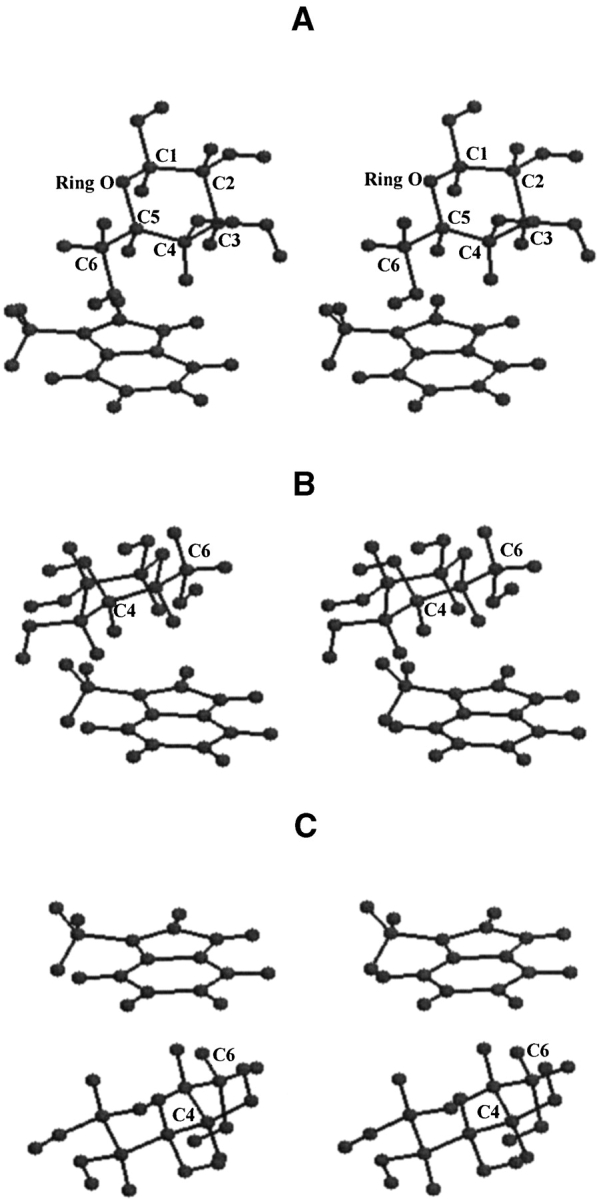
Stereo views of the galactose/3-methylindole complex in 1A3K (A) and 1AFA (B) position-orientations and of the glucose/3-methylindole complex in 7CEL (C) position-orientation. The C3-H, C4-H, C5-H, and C6-HS atoms of galactose interact with 3-methylindole in both the complexes. However, the C3-H and C5-H atoms are above the five-membered ring in the 1A3K position-orientation, whereas the same atoms are above the six-membered ring in the 1AFA position-orientation. In the 7CEL position-orientation, the C1-H, C3-H, O4-H, and C5-H atoms of glucose interact with the six-membered ring of 3-methylindole.
The hydrogen atoms of galactose interact with different regions of the aromatic residue analog in different complexes: in the 1A3K position-orientation, the C4-H and C6-H atoms of galactose are close to the six-membered ring of 3MeIn, whereas the C3-H and C5-H atoms are in proximity of five-membered ring (Fig. 3A ▶). The situation is reversed in the 1AFA position-orientation: the C4-H and C6-H atoms of galactose are close to the five-membered ring, whereas the C3-H and C5-H atoms are in the proximity of the six-membered ring (Fig. 3B ▶). These observations show that the hydrogen atoms of saccharide and the region of the aromatic ring participating in the interactions are different in different complexes.
The interaction energies of the Gal–aromatic residue analog complexes in different spatial position-orientations are comparable (~5 kcal/mole variation)
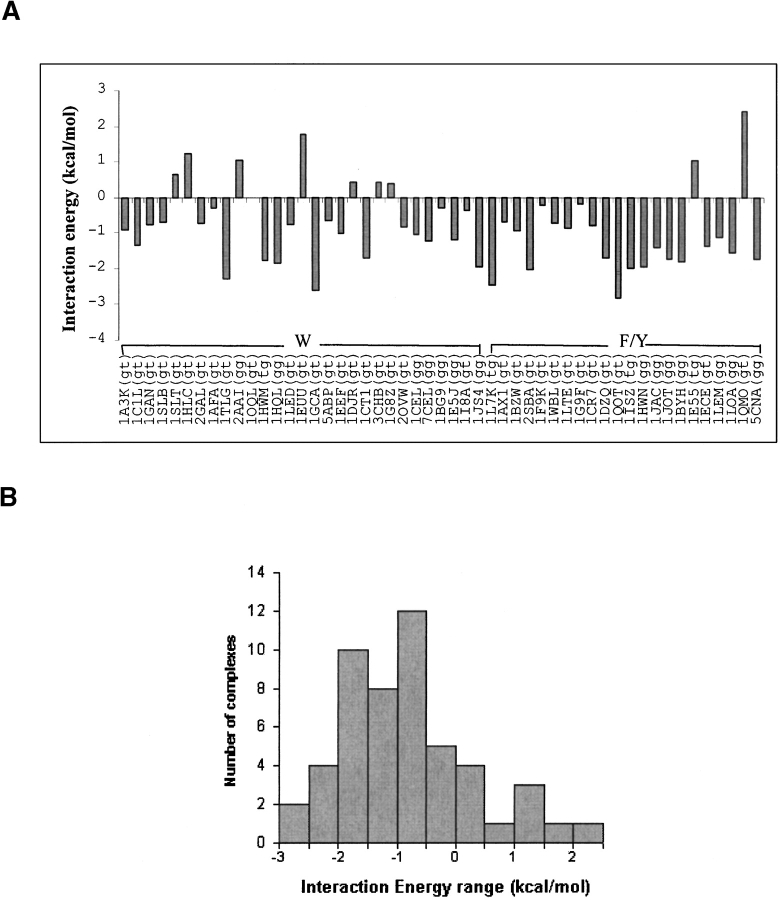
The interaction energy Eint of the Gal–aromatic residue analog complex is negative for most of the position-orientations (Fig. 4 ▶). The complex with 1QOT position-orientation has the lowest Eint (-2.8 kcal/mole), whereas the complex with the 1QMO position-orientation has the highest Eint (2.4 kcal/mole); the high interaction energy in this complex is due to the close proximity Gal:O6 atom to the aromatic ring. Thus, the range of variation of Eint for the 51 different complexes is less than 5.2 kcal/mole. This clearly demonstrates that a number of position-orientation combinations are available for galactose to interact with the aromatic residue analog with comparable Eint. The pyranose ring of galactose is essentially rigid: consequently, a change in the position of one atom leads to sequential changes in the position/orientation of the other atoms of galactose relative to the aromatic residue. Such coordinated changes account for the small differences observed in the interaction energies of various Gal–aromatic residue analog complexes.
Figure 4.
(A) Bar diagram showing the relative interaction energies of the galactose–aromatic residue analog complexes in position-orientations observed in the 51 saccharide–protein complexes (Table 3). The position-orientations are identified by the corresponding PDB Ids, and are shown along the X-axis; the rotamer of the —CH2OH group observed in the saccharide–protein complex is shown in parentheses after the PDB ID. The letters “W” and “F/Y” are single-letter amino acid symbols indicating the aromatic residue found in the binding site. (B) Bar diagram showing the number of galactose–aromatic residue analog complexes with different ranges of interaction energies.
Galactose interacts with the aromatic residue analog favorably in position-orientations observed in Glc/Man–protein complexes
Fourteen of the 51 position-orientations considered for interaction energy calculations are those observed for the saccharide in Glc/Man–protein complexes (Table 3); the interaction energies of the Gal–aromatic residue analog complexes in these position-orientations are similar to those with the position-orientations observed in Gal–protein complexes (Fig. 4A ▶). This clearly shows that the interactions of galactose with the aromatic residue analog in position-orientations observed for the saccharide in Glc/Man– and in Gal–protein complexes are comparable to each other. This is not surprising, because glucose interacts with the aromatic residue either through the C5-H and C6-H atoms or through the C1-H, C3-H, and C5-H atoms, and all these atoms are in the same orientation in galactose also.
Table 3.
Position and orientation of the bound sugar relative to the binding site aromatic residue in Gal-, Glc-, and Man—protein complexes
| Position of sugar with reference to the aromatic residueb | Orientation of sugar relative to the aromatic residuec | Interaction energy (kcal/mole)d | |||||||||
| PDB IDa | Aromatic residue | Bound sugar | —CH2OH group conformation | r | θ | φ | Φ | Θ | Ψ | Gal | Glc |
| Aromatic residue: Tryptophan | |||||||||||
| Gal–protein complexes | |||||||||||
| 1A3K | Trp181 | Gal | gt | 4.6 | 154 | −23 | 23 | 53 | 189 | −0.9 | 9.9 |
| 1C1L | Trp70 | Gal | gt | 4.6 | 152 | −29 | 28 | 47 | 190 | −1.4 | 6.2 |
| 1GAN | Trp69 | Gal | gt | 4.7 | 152 | −15 | 29 | 50 | 191 | −0.8 | 11.1 |
| 1SLB | Trp68 | Gal | gt | 5.5 | 152 | −5 | 27 | 68 | 204 | −0.7 | 4.7 |
| 1SLT | Trp68 | Gal | gt | 5.1 | 150 | −3 | 19 | 64 | 209 | 0.7 | 26.7 |
| 1HLC | Trp65 | Gal | gt | 4.9 | 143 | 5 | 37 | 48 | 199 | 1.2 | 22.4 |
| 2GAL | Trp69 | Gal | gt | 5.0 | 154 | 9 | 31 | 63 | 193 | −0.7 | 9.1 |
| 1AFA | Trp189 | Gal | gt | 4.5 | 160 | 125 | 175 | 60 | 208 | −0.3 | 22.7 |
| 1TLG | Trp100 | Gal | gt | 5.6 | 141 | 49 | 149 | 56 | 180 | −2.3 | 3.0 |
| 2AAI | Trp37 | Gal | gg | 5.3 | 38 | −17 | 61 | 113 | 12 | 1.1 | 64.6 |
| 1OQL | Trp38 | Gal | gt | 4.9 | 36 | −27 | 54 | 126 | 6 | 0.0 | 25.5 |
| 1HWM | Trp39 | Gal | tg | 4.6 | 20 | 36 | 76 | 121 | 17 | −1.8 | 19.7 |
| 1HQL | Trp132 | Gal | gg | 5.1 | 34 | −22 | 60 | 125 | 7 | −1.9 | 9.8 |
| 1LED | Trp133 | Gal | gt | 5.2 | 40 | −24 | 54 | 133 | 9 | −0.8 | 11.2 |
| 1EUU | Trp542 | Gal | gt | 6.1 | 18 | 54 | 133 | 79 | 339 | 1.8 | 1.4 |
| 1GCA | Trp183 | Gal | gt | 4.4 | 162 | 45 | 191 | 41 | 178 | −2.6 | −3.2 |
| 5ABP | Trp16 | Gal | gt | 5.2 | 34 | −49 | 355 | 111 | 354 | −0.7 | 13.0 |
| 1EEF | Trp88 | Gal | gt | 4.5 | 18 | −28 | 20 | 119 | 14 | −1.0 | 22.8 |
| 1DJR | Trp88 | Gal | gt | 4.3 | 18 | −22 | 20 | 123 | 9 | 0.4 | 27.1 |
| 1CT1 | Trp88 | Gal | gt | 4.6 | 20 | −31 | 11 | 121 | 10 | −1.7 | 15.1 |
| 3CHB | Trp88 | Gal | gt | 4.4 | 18 | −29 | 20 | 124 | 10 | 0.4 | 25.5 |
| 1G8Z | Trp88 | Gal | gt | 4.2 | 18 | −12 | 20 | 127 | 5 | 0.4 | 21.3 |
| Glc–protein complexes | |||||||||||
| 2OVW | Trp347 | Glc | gt | 4.1 | 20 | −23 | 19 | 147 | 324 | −0.8 | −1.8 |
| 1CEL | Trp376 | Glc | gg | 4.4 | 27 | 79 | 243 | 138 | 342 | −1.1 | −2.2 |
| 7CEL | Trp376 | Glc | gg | 4.2 | 22 | 88 | 225 | 137 | 333 | −1.3 | −2.8 |
| 1BG9 | Trp206 | Glc | gg | 4.2 | 22 | −21 | 353 | 132 | 319 | −0.3 | −0.9 |
| 1E5J | Trp39 | Glc | gg | 5.0 | 34 | 47 | 130 | 126 | 334 | −1.2 | −1.0 |
| 1I8A | Trp71 | Glc | gt | 4.4 | 157 | −125 | 355 | 37 | 166 | −0.4 | −2.1 |
| 1JS4 | Trp256 | Glc | gg | 4.3 | 24 | −52 | 16 | 142 | 318 | −2.0 | −1.6 |
| Aromatic residue: Tyrosine/Phenylalanine | |||||||||||
| Gal–protein complexes | |||||||||||
| 1L7K | Phe279 | Gal | tg | 4.9 | 148 | 31 | 216 | 42 | 171 | −2.5 | −0.2 |
| 1AX1 | Phe131 | Gal | gt | 4.1 | 8 | −102 | 302 | 137 | 5 | −0.7 | 3.6 |
| 1BZW | Tyr125 | Gal | gt | 4.3 | 8 | −51 | 316 | 122 | 13 | −0.9 | 21.0 |
| 2SBA | Phe128 | Gal | gt | 4.3 | 16 | −101 | 295 | 137 | 6 | −2.1 | 0.4 |
| 1F9K | Phe127 | Gal | gt | 5.0 | 142 | −13 | 64 | 52 | 182 | −0.2 | 14.6 |
| 1WBL | Phe126 | Gal | gt | 5.1 | 141 | −15 | 53 | 39 | 192 | −0.7 | 4.3 |
| 1LTE | Phe131 | Gal | gt | 5.0 | 142 | −12 | 61 | 39 | 182 | −0.9 | 1.6 |
| 1G9F | Phe128 | Gal | gt | 4.8 | 148 | −12 | 54 | 38 | 197 | −0.2 | 2.3 |
| 1CR7 | Tyr125 | Gal | gt | 4.5 | 156 | −13 | 49 | 58 | 192 | −0.8 | 30.1 |
| 1DZQ | Tyr130 | Gal | gt | 5.1 | 153 | −10 | 49 | 70 | 195 | −1.7 | 24.3 |
| 1QOT | Tyr130 | Gal | gt | 4.8 | 161 | −22 | 52 | 69 | 196 | −2.8 | 23.4 |
| 1ISZ | Tyr340 | Gal | tg | 5.0 | 152 | −9 | 49 | 51 | 202 | −2.0 | 5.9 |
| 1HWN | Phe249 | Gal | gg | 5.4 | 137 | 20 | 169 | 20 | 118 | −2.0 | −2.8 |
| 1JAC | Tyr70 | Gal | gg | 4.2 | 5 | 63 | 6 | 126 | 10 | −1.4 | 4.2 |
| 1JOT | Tyr78 | Gal | gg | 4.3 | 12 | −13 | 5 | 125 | 358 | −1.8 | 3.6 |
| Glc−protein complexes | |||||||||||
| 1BYH | Tyr94 | Glc | gg | 4.6 | 30 | −9 | 43 | 163 | 334 | −1.8 | −2.4 |
| 1E55 | Tyr333 | Glc | tg | 4.1 | 143 | −98 | 215 | 31 | 221 | 1.0 | 0.5 |
| 1ECE | Tyr245 | Glc | gt | 4.8 | 154 | 56 | 109 | 44 | 140 | −1.4 | −1.6 |
| 1LEM | Phe123 | Glc | gg | 6.2 | 128 | −20 | 35 | 56 | 183 | −1.1 | 1.2 |
| 1LOA | Phe123 | Glc | gg | 6.0 | 138 | −10 | 49 | 64 | 169 | −1.6 | −0.7 |
| 1QMO | Tyr142 | Man | gt | 6.7 | 111 | −4 | 17 | 49 | 215 | 2.4 | 2.9 |
| 5CNA | Tyr12 | Man | gg | 5.4 | 19 | −160 | 314 | 109 | 355 | −1.8 | −0.9 |
a The PDB IDs are as given in the Protein Data Bank (Berman et al. 2000). The name of the protein and resolution are given in Table 2 for all the PDB IDs.
b The position of the bound sugar with reference to the binding site aromatic residue is specified in polar coordinates for the centroid of pyranose ring in a frame of reference defined within the aromatic residue (Table 1).
c The orientation of the bound sugar with reference to the binding site aromatic residue is specified in terms of the Euler’s rigid body rotation angles (Goldstein 1980). The frame of reference is defined within the aromatic residue and is the same as that used to specify the relative position (Table 1).
d The interaction energy is for the complex of the specified sugar with the aromatic residue analog.
Glucose–aromatic residue analog interaction is unfavorable in position-orientations observed in Gal–protein complexes
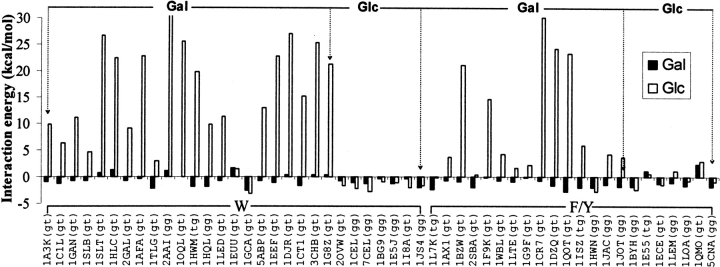
Interaction energies were calculated in all the 51 position-orientations for the Glc–aromatic residue analog complexes also. The rotamer chosen for the —CH2OH group is the same as that observed in the corresponding saccharide–protein complexes in each case. The interaction energies of the Gal– and Glc–aromatic residue analog complexes are comparable to each other in position-orientations observed in Glc–protein complexes (Fig. 5 ▶). This is in contrast to the interaction energies for the 37 position-orientations observed in Gal–protein complexes (Table 3): the interaction energy of the Glc–aromatic residue analog complex is considerably higher than the corresponding Gal–aromatic residue analog complex in a large number of position-orientations. The interaction energies for the Gal– and Glc–aromatic residue analog complexes are nearly the same in 1EUU and 1GCA position-orientations. 1GCA is a Glc/Gal transporter that binds to both glucose and galactose (Aqvist and Mowbray 1995). The saccharide interacts with the aromatic residue analog through the C5-H, C6-HR, and C6-HS atoms in 1EUU position-orientation. Because the C4-H atom is not interacting with the aromatic residue, there is no difference in the interaction energies of the Gal– and Glc–aromatic residue analog complexes in this position-orientation.
Figure 5.
Bar diagram showing the interaction energies of the glucose–aromatic residue analog complexes (open bars). The interaction energies of the galactose–aromatic residue analog complexes corresponding to the same position-orientation are shown alongside (filled bars; same data as that in Fig. 4A ▶) for comparison. The position-orientations as identified by the corresponding PDB IDs are shown along the X-axis; the rotamer of the —CH2OH group observed in the saccharide (glucose or galactose)–protein complex is shown in parentheses after the PDB ID. The bound saccharide (Gal or Glc) in the crystal structure is indicated above the bars; the aromatic residue in the binding site is indicated below the bars by the single-letter amino acid symbol.
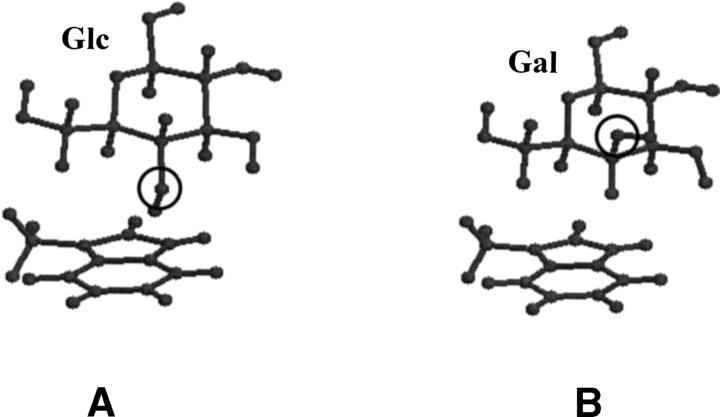
The higher interaction energy for the Glc–aromatic complex in position-orientations observed in Gal–protein complexes can be mainly attributed to the spatial disposition of the Glc:O4 atom relative to the aromatic ring. The position of the Gal:C4-H atom is occupied by an oxygen atom in glucose. This results in repulsion between the electronegative oxygen atom and the π cloud of the aromatic analogs (Fig. 6 ▶). The effect of O4 is very high (~16-fold difference) in the 2AAI position-orientation due to the close proximity of the O4 atom to the aromatic ring. This is in contrast to the 1JAC and 1G9F position-orientations wherein the O4 atom is away from the aromatic residue thereby causing much less repulsion (~four- and ~twofold difference, respectively).
Figure 6.
Ball-and-stick diagram showing the complex of glucose (A) and of galactose with 3-methylindole (B) in identical position-orientation. These two saccharides differ in the configuration at the C4 atom. The Gal:C4-H atom interacts favorably with the aromatic residue analog; this nonpolar hydrogen atom is replaced by the hydroxyl group (hydroxyl oxygen atoms at C4 are encircled) when Gal is substituted by Glc in an identical position-orientation resulting in repulsion.
The rotamer wherein the Gal:O6 atom is away from the aromatic ring is preferred for the exocyclic —CH2OH group
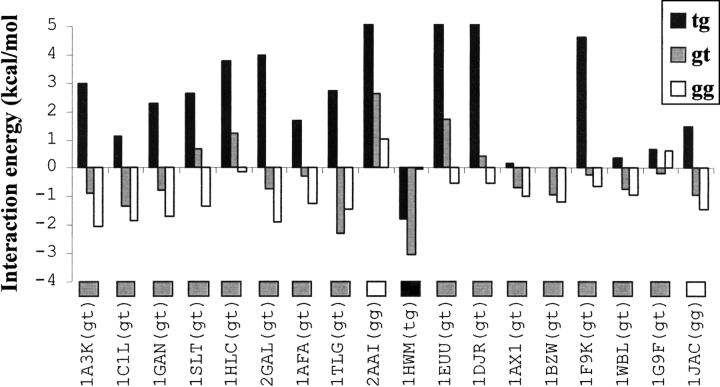
Interaction energy calculations were performed for the Gal–aromatic residue analog complexes by considering the exocyclic —CH2OH group in the gg, gt, and tg conformations in 18 position-orientations. The complex wherein the—CH2OH group is in the gg conformation has lower interaction energy than the corresponding complexes with gt and tg conformations in 14 of the 18 position-orientations (Fig. 7 ▶). The interaction energy is highest when the —CH2OH group is in the tg conformation in all the complexes except the complex with 1HWM position-orientation. The C3-H, C4-H, C5-H, and C6-HS atoms of galactose interact with the aromatic residue analog in most of the complexes. The O6 atom takes the position of C6-HS in the tg conformer, leading to unfavorable interactions. The —CH2OH group is away from the aromatic residue in the 1HWM complex; this accounts for the differences in the observed rotamer preferences.
Figure 7.
Bar diagram showing the interaction energies of the Gal–aromatic residue analog complexes for the three rotamers of the —CH2OH group in 18 position-orientations; these are identified by PDB IDs along with the —CH2OH rotamer observed in the corresponding Gal–protein complexes. The SCF for the complex with 1BZW position-orientation and with the —CH2OH group in the tg conformation did not converge, and hence, the corresponding interaction energy is not shown in the diagram. The striped, filled, and open boxes represent the interaction energies for the complexes with the —CH2OH group in the gt, tg, and gg conformation, respectively; in each case, the position-orientation is identified by the corresponding PDB ID.
Discussion
The interaction energies of the Gal–aromatic residue analog complexes are comparable to each other in most of the position-orientations
An aromatic residue, generally Trp, but Tyr or Phe in a few cases, has been found to be a key component of the binding sites of several saccharide binding proteins. The aromatic amino acid probably ensures the proper orientation of the saccharide in the binding site by orienting the nonpolar hydrogen atoms towards the aromatic ring and the oxygen atoms away from the aromatic ring. The variation brought about by a change in the position-orientation in the interaction energy of the Gal–aromatic residue analog complex is very small.
Small changes in position-orientation are necessary for optimizing the interaction of the saccharide with the rest of the binding site
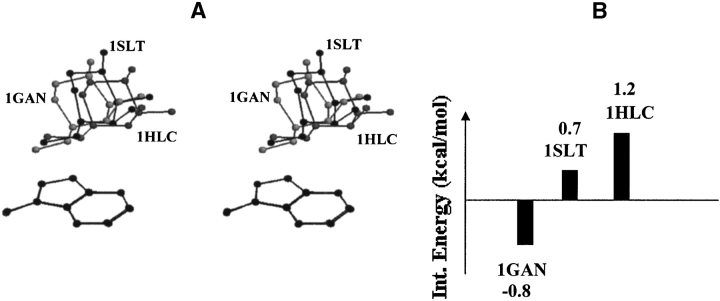
The position-orientations of galactose relative to the aromatic residue are quite similar in toad ovary galectin (1GAN), S-lectin (1SLT), and S-Lac lectin (1HLC; Table 3; Fig. 8 ▶). All three are members of the galectin family of proteins. The C4-H, C5-H, and C6-HS atoms interact with the aromatic ring in all three complexes; C3-H is located away from the aromatic ring. The interaction energies of the Gal–aromatic residue analog complexes in 1HLC and 1SLT position-orientations are higher than that in 1GAN position-orientation (Fig. 8 ▶). Visual inspection shows no obvious repulsive interactions in 1HLC and 1SLT complexes, indicating that the increase in the interaction energy is the cumulative effect of several attractive and repulsive interactions between the atoms of galactose and aromatic residue analog.
Figure 8.
(A) Stereo diagram showing superposition of the binding site aromatic residues along with the bound galactose in toad ovary galectin (1GAN), S-lac lectin (1HLC), and S-lectin (1SLT). Superposition has been carried out with reference to the atoms of the aromatic residue. The position-orientation of the bound saccharide with respect to the aromatic residue is similar in these three proteins of the galectin family. The main chain atoms of aromatic residues are not shown for clarity. (B) Bar diagram showing the interaction energies of galactose/3-methylindole complexes corresponding to the position-orientation observed in these three proteins.
The coordinates of galactose and binding site residues of S-lectin (1SLT) and toad ovary galectin (1GAN) were superposed using the pyranose ring atoms as reference. With this, the position-orientation of galactose in S-lectin was reset to the position-orientation observed for galactose in toad ovary galectin. Consequently, some key interactions of galactose with the binding site are lost, which were otherwise favorable (Table 4). Such changes were observed even when the position-orientation of galactose in S-Lac lectin (1HLC) was reset to that observed for galactose in toad ovary galectin (Table 4). In the context of binding site in S-lectin (1SLT) and S-Lac lectin (1HLC), slight changes in the position-orientation of galactose relative to the aromatic analog facilitate better interaction of galactose with other binding site residues. Thus, the position and orientation of galactose has to be optimized with respect to all the binding site residues in the protein, not with respect to the aromatic residue alone. Hence, the saccharide–aromatic residue interaction may or may not be optimal within the binding site.
Table 4.
Changes in the hydrogen bond distances due to a change in the position-orientation of galactose in the binding site of S-lectin and S-Lac lectin
| Distance (in Å) | ||
| Hydrogen bond | In observed position-orientationa | In modified position-orientationb |
| In S-Lectin–Galactose complex | ||
| Gal:C2-OH...His52:Nɛ2 | 4.1 | 4.8 |
| Gal:C4-OH...His44:Nɛ2 | 2.8 | 3.2 |
| Gal:Ring O...Arg48:Nη2 | 2.9 | 3.8 |
| Gal:C6-OH...Asn61:Nδ2 | 2.7 | 2.3 |
| Gal:C6-OH...Glu71:Oɛ2 | 2.8 | 3.0 |
| In S-Lac lectin–Galactose complex | ||
| Gal:C3-OH...Arg120:Nη2 | 3.4 | 4.8 |
| Gal:C4-OH...His45:Nɛ2 | 2.8 | 3.5 |
| Gal:Ring O...Arg49:Nη1 | 4.0 | 4.5 |
| Gal:C6-OH...Asn58:Nδ2 | 2.7 | 1.9 |
| Gal:C6-OH...Glu68:Oɛ1 | 2.6 | 2.9 |
a This refers to the position-orientation of galactose relative to the binding site aromatic residue observed in the X-ray crystallographic structure. In S-lectin–galactose complex (PDB ID 1SLT), position (r, θ, θ) = (5.1, 150, -3), and orientation (Φ,Θ,Ψ) = (19, 64, 209). In S-lac lectin–galactose complex (PDB ID 1HLC), position (r, θ, φ) = (4.9, 143, 5), and orientation (Φ,Θ,Ψ) = (37, 48, 199).
b In the modified position-orientation, (r, θ, φ) = (4.7, 152, -15) and (Φ,Θ,Ψ) = (29, 50, 191). This is the position-orientation observed for galactose in the toad ovary galectin–galactose complex (PDB ID 1GAN).
The relative position-orientations of the saccharide that are considered for interaction energy calculations in the present study are those that are observed in a saccharide–protein complex; in this environment, all the saccharide–protein interactions, not just those between saccharide and aromatic residue, are important for complex formation. It has been proposed (Sujatha and Balaji 2004) that galactose has the freedom to move along the plane of the stacking residue to establish optimal interactions with binding site residues in galactose binding proteins. After attaining the proper distance and orientation favorable for galactose with respect to the aromatic amino acid, it can fine tune its orientations in protein such that it forms optimal interactions with the rest of the binding site residues. If in this process, the energy due to galactose–aromatic residue interaction is slightly lower or higher, it could be compensated by the optimal interactions with the rest of the binding site residues. Interestingly, the position-orientation of the saccharide relative to the aromatic residue has changed in different 3D structures of the same protein accompanied by a change the interaction energy (Table 5).
Table 5.
Interaction energy for galactose-aromatic residue analog complexes for position-orientations observed in different structures of the same protein
| Average B-factor (Å2) | ||||
| PDB ID | Resolution (Å) | Aromatic residue | Bound sugar | Interaction energy (kcal/mole) |
| S-lectin (sugar moiety in the binding site: galactose) | ||||
| 1SLT | 1.9 | 23 | 23 | 0.7 |
| 1SLB | 2.3 | 13 | 12 | −0.7 |
| Heat-labile enterotoxin (sugar moiety in the binding site: galactose) | ||||
| 1EEF | 1.8 | 11 | 14 | −1.0 |
| 1DJR | 1.3 | 10 | 21 | 0.4 |
| Cholera toxin (sugar moiety in the binding site: galactose) | ||||
| 1CT1 | 2.3 | 19 | 30 | −1.7 |
| 3CHB | 1.25 | 12 | 12 | 0.4 |
| IG8Z | 2.0 | 17 | 35 | 0.4 |
| β1→4 glucan cellobiohydrolase (sugar moiety in the binding site: glucose) | ||||
| 1CEL | 1.81 | 16 | 22 | −1.1 |
| 7CEL | 1.9 | 13 | 22 | −1.3 |
| Erythrina corallodendron lectin (sugar moiety in the binding site: galactose) | ||||
| 1LTE | 2.0 | 15 | 39 | −0.9 |
| 1AX1 | 1.95 | 23 | 30 | −0.7 |
| Lectin UEA-II (sugar moiety in the binding site: galactose) | ||||
| 1DZQ | 2.85 | 36 | 61 | −1.7 |
| 1QOT | 3.0 | 32 | 53 | −2.8 |
| Peanut lectin (sugar moiety in the binding site: galactose) | ||||
| 1BZW | 2.7 | 16 | 11 | −0.9 |
| 1CR7 | 2.6 | 22 | 15 | −0.8 |
The proteins have been crystallized under different conditions and/or with different ligands.
Interaction energy of Glc–aromatic residue analog complexes are higher for position-orientations observed in Gal–protein complexes
The interaction energies of Gal–aromatic residue analog complexes for position-orientations observed in Glc/Man–protein complexes are similar to each other and are also comparable to those complexes wherein the position-orientations are as observed in Gal–protein complexes. In contrast, the interaction energies of Glc–aromatic residue analog complexes in position-orientations observed in Gal–protein complexes are very high (Fig. 5 ▶); the magnitude of increase is variable but is several folds higher in nine position-orientations (Table 3; Fig. 5 ▶). Such a large increase in the interaction energy cannot be tolerated in the binding site; thus, it can be inferred that the protein will not bind glucose in that position-orientation. In complexes where the extent of increase in the interaction energy is less than fivefold, the proteins may use some other mechanism to distinguish glucose from galactose; alternatively, they accommodate glucose with weaker affinity. Jacalin (1JAC) is one such protein (~fourfold difference); this protein has been shown to have broad specificity towards monosaccharides because of its flexible and spacious binding site (Bourne et al. 2002). This indicates that the aromatic residue may not play a significant role in distinguishing glucose from galactose in Glc-specific proteins; absence of an aromatic residue on the b face of saccharide in proteins such as mannose-binding protein (Iobst et al. 1994) and hexokinase (Mulichak et al. 1998) that bind glucose seems to corroborate this inference.
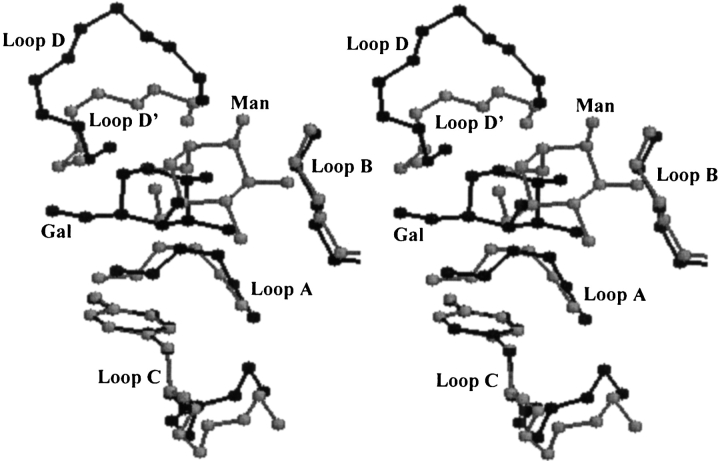
The binding site architecture is very similar in Con A (Man/Glc-specific; 5CNA) and peanut lectin (Gal-specific; 1BZW); most of the residues that interact with the bound saccharide are also the same in the two proteins (Sharma and Surolia 1997). The binding site architecture differs in loop D, which is smaller in the former complex. Even though the conformation of the binding site aromatic residue is also very similar in the two proteins, differences in the position-orientations of the bound saccharide (Fig. 9 ▶) ensure that the contact of the oxygen atoms with the aromatic ring is minimal in both the cases. Interestingly, while genetically engineering the mannose-binding protein A to confer galactose specificity, it was observed that the introduction of Trp led to an increase in the affinity; increased selectivity was achieved only by the introduction of an additional Gly-rich loop following Trp (Iobst and Drickamer 1994; Drickamer 1997).
Figure 9.
Stereo view of the loops that form the saccharide binding site in legume lectins. The binding site regions of Gal-specific peanut lectin (1BZW; bound to galactose) and of Man/Glc-specific concanavalin A (5CNA; bound to mannose) are superposed on each other. The loops A, B, and C superpose very well. However, large differences are seen in the specificity-determining loop D region (Sharma and Surolia 1997; labeled D and D′ corresponding to 1BZW and 5CNA, respectively). The orientation of the bound saccharide relative to the aromatic amino acid is also different: mannose interacts with the aromatic residue through its C5-H and C6-H atoms, whereas galactose interacts through its C3-H, C4-H, C5-H, and C6-H atoms.
Tryptophan versus phenylalanine/tyrosine in galactose binding site
The aromatic residue in the saccharide-binding sites of proteins is often a tryptophan. Phenylalanine and tyrosine are also found, albeit in fewer proteins. The interaction energies of the complexes of galactose with the three aromatic residue analogs are comparable (Table 3; Fig. 4A ▶), which suggests that the presence of Trp instead of Phe or Tyr in the binding site of a protein may not confer an energetic advantage. Instead, tryptophan, with its larger surface area, offers many more position-orientations for the saccharide to optimize its interactions with the other binding site residues without incurring any energetic penalty.
Materials and methods
Conformation of the —CH2OH group
The three staggered rotamers of the exocyclic —CH2OH group are specified as gg, gt, and tg, wherein the first and second letters specify the conformation of the —OH group with respect to the ring oxygen and C4 atoms, respectively (Rao et al. 1998b); for example, in the tg conformation, the —OH group will be trans to the ring oxygen atom and gauche to the C4 atom. The coordinates of the bound saccharide in a frame of reference defined with respect to the aromatic residue (Fig. 1 ▶; Table 1) were obtained by coordinate transformation.
The values of the polar coordinates (r,θ,φ) and the Euler’s rigid body rotation angles (Φ,Θ,Ψ) in the protein–saccharide complex were determined as follows:
Step 1. The coordinates of the protein–saccharide complex were retrieved from the protein data bank (Berman et al. 2000) and transformed to a frame of reference defined within the aromatic ring (Table 1). This transformation brings the aromatic residue in the protein–saccharide complex and the geometry optimized aromatic residue analog into the same frame of reference.
Step 2. The UHF/6-31G** geometry-optimized saccharide was superposed on to the protein-bound saccharide using an in-house program using the six atoms of the pyranose ring as reference atoms. This superposition step gives the relative distance and orientation of the bound saccharide with reference to the aromatic residue. The distance is specified in terms of the (x,y,z) coordinates of the centroid of the pyranose ring and the orientation is specified in terms of the Euler’s rigid body rotation angles. The (r,θ,φ) values are calculated from the (x,y,z) coordinates.
Step 3. The translation and rotation parameters obtained from Step 2 are used to generate the various galactose– and glucose–aromatic residue analog complexes corresponding to the position-orientation observed in different Gal–, Glc–, and mannose (Man)–protein complexes.
Geometry optimization and interaction energy calculations
Galactose and glucose, each with three different conformations of the —CH2OH group (gg, gt, and tg), and the three aromatic residue analogs were individually geometry optimized using unrestricted Hartree-Fock methods. Successive optimizations were carried out by using the basis sets STO-3G, 6-31G, and 6-31G** for faster convergence. The convergence criteria were set such that the largest component of the energy gradient is less than 10−6 Hartree/ Bohr (OPTTOL parameter in GAMESS) and RMS gradient is <1/3 of OPTTOL; default values were used for all other parameters. The optimized equilibrium geometry coordinates obtained from the lower basis set was used as input for optimization at the next higher level.
The equilibrium geometries obtained for each of these molecules from UHF/6-31G** calculations were used for single-point energy calculations using the computationally less demanding density functional theory (DFT). The approach adopted was specifically B3LYP, a hybrid method combining five functionals, namely, Becke, Slater, HF exchange, LYP, and VWN5 correlation (Becke 1993). The 6-31G** geometries were used to generate the different aromatic residue analog–saccharide complexes. Single-point energy calculations at U-B3LYP/6-31G** level of density functional theory were performed for these complexes. The interaction energy Eint was calculated as Eint = EA-B - (EA + EB), where EA-B, EA, and EB denote energies of the saccharide–aromatic residue analog complex, of the saccharide and of the aromatic analog, respectively. The energy EA(gB) of the saccharide (molecule A) in the presence of the ghost aromatic analog (molecule B) obtained by assigning a nuclear charge of zero to all the atoms of molecule B was found to be the same as the energy calculated for isolated saccharide. Similarly, the energy EB(gA) of the aromatic analog calculated in the presence of ghost saccharide was found to be the same as the energy calculated for isolated aromatic analog.
Choice of the ab initio method
The DFT method with medium-sized polarized sets of atomic orbitals used in the present study is computationally less expensive and is sufficient to achieve the objective of comparing the interaction energies of the saccharide and aromatic residue analog complexes in various position-orientations. A number of studies performed using DFT, including a study on the weak interactions of rare gases, have given good estimates of interaction energies (Zhang et al. 1997; Milet et al. 1999; Perez-Jorda et al. 1999; Guerra and Bickelhaupt 2003).
Acknowledgments
We thank Prof. S.N. Datta for his valuable suggestions and help with the quantum chemical calculations. We also thank Prof. S. Durani for discussion and critical reading of the manuscript, and the Gordon research group for the GAMESS software. M.S.S. is grateful to the Indian Institute of Technology Bombay for a teaching assistantship. This work was supported by a grant from the Council of Scientific and Industrial Research, India to P.V.B., No. 37(1110)/02/EMR-II. The authors are also thankful to the referees for their critical comments.
The publication costs of this article were defrayed in part by payment of page charges. This article must therefore be hereby marked “advertisement” in accordance with 18 USC section 1734 solely to indicate this fact.
Article and publication are at http://www.proteinscience.org/cgi/doi/10.1110/ps.04812804.
References
- Aqvist, J. and Mowbray, S.L. 1995. Sugar recognition by a glucose/galactose receptor. Evaluation of binding energetics from molecular dynamics simulations. J. Biol. Chem. 270 9978–9981. [PubMed] [Google Scholar]
- Becke, A.D. 1993. Density-functional thermochemistry. III. The role of exact exchange. J. Chem. Phys. 98 5648–5652. [Google Scholar]
- Berman, H.M., Westbrook, J., Feng, Z., Gilliland, G., Bhat, T.N., Weissig, H., Shindyalov, I.N., and Bourne, P.E. 2000. The protein data bank. Nucleic Acids Res. 28 235–242 (www.rcsb.org). [DOI] [PMC free article] [PubMed] [Google Scholar]
- Bourne, Y., Astoul, C.H., Zamboni, V., Peumans, W.J., Menu-Bouaouiche, L., Van Damme, E.J.M., Barre, A., and Rouge, P. 2002. Structural basis for the unusual carbohydrate-binding specificity of jacalin towards galactose and mannose. Biochem. J. 364 173–180. [DOI] [PMC free article] [PubMed] [Google Scholar]
- Drickamer, K. 1997. Making a fitting choice: Common aspects of sugar-binding sites in plant and animal lectins. Structure 5 465–468. [DOI] [PubMed] [Google Scholar]
- Elgavish, S. and Shaanan, B. 1997. Lectin–carbohydrate interactions: Different folds, common recognition principles. Trends Biochem. Sci. 22 462–467. [DOI] [PubMed] [Google Scholar]
- Goldstein, H. 1980. Classical mechanics. Addison Wesley, London.
- Guerra, C.F. and Bickelhaupt, F.M. 2003. Orbital interactions and charge redistribution in weak hydrogen bonds: The Watson-Crick AT mimic adenine-2,4-difluorotoluene. J. Chem. Phys. 119 4262–4273 [Google Scholar]
- Guex, N. and Peitsch, M.C. 1997. SWISS-MODEL and the Swiss-PdbViewer: An environment for comparative protein modeling. Electrophoresis 18 2714–2723 (www.expasy.org/spdbv). [DOI] [PubMed] [Google Scholar]
- Hohenberg, P. and Kohn, W. 1964. Inhomogeneous electron gas. Phys. Rev. 136 864–871. [Google Scholar]
- Iobst, S.T. and Drickamer, K. 1994. Binding of sugar ligands to a Ca2+-dependent animal lectins. II. Generation of high-affinity galactose binding by site-directed mutagenesis. J. Biol. Chem. 269 15512–15519. [PubMed] [Google Scholar]
- Iobst, S.T., Wormald, M.R., Weis, W.I., Dwek, R.A., and Drickamer, K. 1994. Binding of sugar ligands to Ca(2+)-dependent animal lectins. I. Analysis of mannose binding by site-directed mutagenesis and NMR. J. Biol. Chem. 269 15505–15511. [PubMed] [Google Scholar]
- Loris, R., Hamelryck, T., Bouckaert, J., and Wyns, L. 1998. Legume lectin structure. Biochim. Biophys. Acta 1383 9–36. [DOI] [PubMed] [Google Scholar]
- Milet, A., Korona, T., Moszynski, R., and Kochanski, E. 1999. Anisotropic intermolecular interactions in van der Waals and hydrogen-bonded complexes: What can we get from density functional calculations? J. Chem. Phys. 111 7727–7735 [Google Scholar]
- Mulichak, A.M., Wilson, J.E., Padmanabhan, K., and Garavito, R.M. 1998. The structure of mammalian hexokinase-1. Nat. Struct. Biol. 5 555–560. [DOI] [PubMed] [Google Scholar]
- Nishio, M., Umezawa, Y., Hirota, M., and Takeuchi, Y. 1995. The CH/π interaction. Significance in molecular recognition. Tetrahedron 51 8665–8671. [Google Scholar]
- Perez-Jorda, J.M., San-Fabian, E., and Perez-Jimenez, A.J. 1999. Density-functional study of van der Waals forces on rare-gas diatomics: Hartree-Fock exchange. J. Chem. Phys. 110 1916–1920 [Google Scholar]
- Quiocho, F.A. 1989. Protein–carbohydrate interactions: Basic molecular features. Pure Appl. Chem. 61 1293–1306. [Google Scholar]
- Quiocho, F.A. and Vyas, N.K. 1999. Bioorganic chemistry. Carbohydrates (ed. S.M. Hecht), pp. 441–457. Oxford University Press, New York.
- Rao, V.S.R., Lam, K., and Qasba, P.K. 1998a. Architecture of the sugar binding sites in carbohydrate binding proteins—A computer modeling study. Int. J. Biol. Macromol. 23 295–307. [DOI] [PubMed] [Google Scholar]
- Rao, V.S.R., Qasba, P.K., Balaji, P.V., and Chandrasekaran, R. 1998b. Conformations of carbohydrates, pp. 49–90. Harwood Academic Publishers, Singapore.
- Rini, J.M. 1995. Lectin structure. Annu. Rev. Biophys. Biomol. Struct. 24 551–577. [DOI] [PubMed] [Google Scholar]
- Sayle, R. 1994. RASMOL molecular visualization program. Biomolecular Structure Group, Glaxo Research and Development, Greenford, Middlesex, UK (www.bernstein-plus-sons.com/software/rasmol/).
- Schmidt, M.W., Baldridge, K.K., Boatz, J.A., Elbert, S.T., Gordon, M.S., Jensen, J.H., Koseki, S., Matsunaga, N., Nguyen, K.A., Su, S., et al. 1993. General atomic and molecular electronic structure system. J. Comput. Chem. 14 1347–1363 (www.msg.ameslab.gov/GAMESS/GAMESS.html). [Google Scholar]
- Sujatha, M.S. and Balaji, P.V. 2004. Identification of common structural features of binding sites in galactose-specific proteins. Proteins 55 44–65. [DOI] [PubMed] [Google Scholar]
- Sundari, C.S. and Balasubramanian, D. 1997. Hydrophobic surfaces in saccharide chains. Prog. Biophys. Mol. Biol. 67 183–216. [DOI] [PubMed] [Google Scholar]
- Toone, E.J. 1994. Structure and energetics of protein–carbohydrate complexes. Curr. Opin. Struct. Biol. 4 719–728. [Google Scholar]
- Weis, W.I. and Drickamer, K. 1996. Structural basis of lectin–carbohydrate recognition. Annu. Rev. Biochem. 65 441–473. [DOI] [PubMed] [Google Scholar]
- Zhang, Y., Pan, W., and Yang, W. 1997. Describing van der Waals interactions in diatomic molecules with generalized gradient approximations: The role of the exchange functional. J. Chem. Phys. 107 7921–7925. [Google Scholar]


