

Abstract
The Escherichia coli protein HU functions as an architectural DNA-binding protein by facilitating DNA looping or bending to form multiprotein complexes. Although HU does not recognize a specific DNA sequence, site-specific binding to a number of discontinuous, looped, or bent DNA substrates has been observed. In this study UV resonance Raman (UVRR) spectroscopy is used to identify structural elements associated with low- and high-affinity binding by examining three different HU–DNA complexes. UVRR spectra obtained with an excitation wavelength of 210 nm, which preferentially enhances protein backbone amide vibrations, indicate that HU secondary structure content increases and the protein structure becomes more rigid upon binding to DNA. The increase in α-helical content is attributed to the C-terminal helix, which interacts with the DNA and may play a role in binding affinity and specificity. UVRR spectra obtained with a 215 nm excitation wavelength demonstrate that Pro mode intensity at 1455 cm−1 decreases upon complex formation. This intensity decrease is attributed to the intercalation of Pro residues between DNA base pairs to induce a bend in the DNA, as has been observed previously in the IHF–DNA and HU–DNA cocrystal structures. DNA vibrational modes are also indicative of significant base unstacking and opening of the minor groove upon protein binding, consistent with bending and distortion of the DNA. In all three complexes, A-DNA conformational features are indicated by deoxyribose-phosphate backbone modes. These and other results suggest that protein-induced bending plays an important role in HU site-specific binding and supports a model of a mutually induced fit.
Keywords: protein, DNA interactions, A-tracts, Raman spectroscopy, DNA bending, DNA binding
HU, a multifunctional DNA-binding protein, participates in several cellular functions including growth, recombination, replication and transposition (Drlica and Rouviere-Yaniv 1987). Originally identified as a histone-like protein (Rouviere-Yaniv and Gros 1975), more recent studies implicate HU as a DNA chaperone (Travers 1993) or architectural protein. HU binding mediates DNA looping or bending, which facilitates the formation of multiprotein complexes (Lavoie and Chaconas 1993; Lavoie et al. 1996; Aki and Adhya 1997; Lia et al. 2003). Although HU protein participates in specific functions within the cell and binds to specific DNA sites, as in the case of Gal repression and Mu transposition, it does not exhibit sequence specific recognition of DNA.
HU, a heterodimer in Escherichia coli, binds with high affinity and 1:1 stoichiometry (HU dimer:DNA duplex) to discontinuous or bent DNA conformations, such as gapped or nicked DNA; whereas the binding of HU to linear duplex DNA is characterized by micromolar affinities and protein:DNA ratios greater than 1:1 (Castaing et al. 1995; Lavoie et al. 1996; Kamashev et al. 1999; Kobryn et al. 1999; Pinson et al. 1999; Kamashev and Rouviere-Yaniv 2000; Wojtuszewski et al. 2001). The structures of the 1:1 HU–DNA complexes have been successfully modeled using the IHF–DNA cocrystal structure, in which the protein induces a bend of 160° (Lavoie et al. 1996; Rice et al. 1996; Kamashev et al. 1999). The modeling of these complexes indicates that in certain instances HU can bind DNA duplexes site-specifically and induce a bend in a manner similar to IHF. The recent Anabena HU–DNA X-ray crystal structure (Swinger et al. 2003) reveals that the protein-induced bend is variable and not necessarily as large as in the IHF–DNA structure. IHF and HU interact with DNA through some common motifs such as the intercalation of Pro residues to induce bending or kinking of the DNA and interaction of the C terminus with the DNA (Rice et al. 1996; Swinger et al. 2003). In both structures protein-induced bending leads to the wrapping of the DNA around the protein α-helical body.
The nanomolar binding affinities observed with flexible or discontinuous DNA substrates and the micromolar binding affinities observed with linear DNA suggests that HU dimer exhibits different modes of DNA binding, which are governed by structure and not sequence, as has been recently described for HMG1 (Murphy and Churchill 2000). Further evidence for an alternate mode of HU binding to DNA has been observed by scanning force microscopy, in which HU binding leads to DNA elongation rather than compaction (Dame and Goosen 2002). The molecular basis that underlies these differences in HU binding interactions is not known.
The goal of this study is to identify structural elements important in binding and recognition by examining three different HU–DNA complexes using UV resonance Raman spectroscopy (UVRR): two higher affinity complexes that exhibit protein-induced bending are compared with a low-affinity complex that exhibits no bending. The three complexes have been previously characterized by fluorescence spectroscopy and analytical ultracentrifugation (Wojtuszewski et al. 2001; Wojtuszewski and Mukerji 2003), and were chosen for further study using UVRR spectroscopy because of the observed differences in binding affinity and the amount of protein-induced bending. In the higher affinity complexes (Ka ~5 μM−1) the duplexes are 20 bp long and contain an A4T4 repeating sequence either in the 5′ to 3′ direction or in the 3′ to 5′ direction, hereafter referred to as A4–20 and T4–20, respectively. The orientation of the A-tract leads to a marked difference in structural and energetic properties, which were attributed to DNA bending (Hagerman 1986; Burkhoff and Tullius 1988; Haran and Crothers 1989). Fluorescence resonance energy transfer measurements (FRET) determined a bend angle of 45° and 12° for the A4–20 and T4–20 duplexes and protein binding increased the total bend to 70° and 62°, respectively (Wojtuszewski and Mukerji 2003). Also examined was HU binding to a 13-bp duplex, the sequence of which is based on the IHF H1 consensus binding sequence. HU binds to this sequence with low affinity (0.5 μM−1), a 2:1 stoichiometry and little to no induced bending, as determined by fluorescence intensity measurements (Wojtuszewski et al. 2001). UVRR spectroscopy is now used to probe the structural elements of these complexes to identify their similarities and differences particularly with respect to binding affinity. This study elucidates molecular details of the HU–DNA interaction, which could not be discerned from the previous fluorescence experiments and provides a framework from which the structural recognition of DNA by HU can be understood.
Previously, UV resonance Raman spectroscopy has been used successfully to analyze proteins (Harada and Takeuchi 1986; Austin et al. 1993) and DNA (Fodor and Spiro 1986; Toyama et al. 1991, 1993; Mukerji et al. 1995, 1996, 1998; Sokolov et al. 2000; Mukerji and Williams 2002), but the technique has only been sparingly applied to the analysis of protein–DNA interactions. In contrast, Raman spectroscopy has been successfully applied to the study of DNA structure and protein–DNA interactions, and many previously identified conformational markers are used to analyze the current data (Thomas and Tsuboi 1993; Peticolas 1995; Thomas 1999). However, conducting the experiment in a resonance enhanced manner affords several advantages including the differential investigation of the protein and DNA moieties in the complex and the ability to use concentrations that are only modestly increased relative to those used to characterize the binding interaction by other methods (Wojtuszewski et al. 2001; Wojtuszewski and Mukerji 2003). In this study, excitation wavelengths of 210 and 215 nm are used to probe HU secondary structure through the protein amide backbone modes, and the local environment of Phe and Pro residues, respectively (Fig. 1 ▶). An excitation wavelength of 215 nm also enhances deoxyribose phosphate backbone modes, DNA carbonyl stretching vibrations and ring-stretching vibrations, the intensities of which are a reliable measure of base stacking. Structural details of the complexes can be inferred from changes in frequency or intensity of these modes upon complexation.
Figure 1.
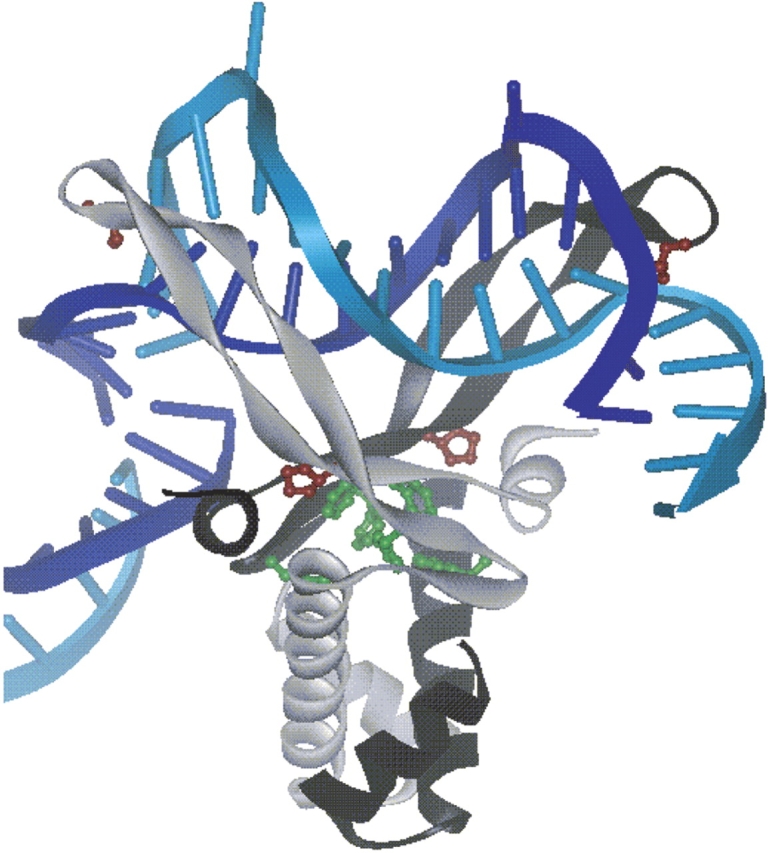
Anabena HU bound to DNA. HU monomers are shown in gray and black to indicate the heterodimeric nature of E. coli HU. The four Pro residues present in E. coli HU, located at positions 63 and 77 for each monomer, are shown in maroon. The six Phe residues present in E. coli HU at positions, 47, 50, and 79 for each monomer, are shown in green. These residues are highly conserved among all HU proteins and IHF. A portion of a second DNA molecule, present in the asymmetric unit, is shown to illustrate the interaction between the C-terminal helix and the DNA. Diagram was generated using Weblab Viewer Pro 3.7 and X-ray crystallographic coordinates of Swinger et al. (2003), PDB ID: 1P51.
The current study reveals that the bent complexes are very similar in structure, despite the fact that the A4–20 duplex is prebent. Significant structural features of these complexes, elucidated by UVRR, include increased protein secondary structure content, Pro intercalation to induce bending and a distorted DNA helix with an opened minor groove. In contrast, these structural features are reduced or nonexistent in the linear, low-affinity HU2:H1–13 complex. These features are consistent with a model of a mutually induced fit as originally proposed by Rice and coworkers (Swinger et al. 2003).
Results
Complexes formed between HU protein and 3 DNA duplexes (A4–20, T4–20, and H1–13; Table 1) were examined using excitation wavelengths of 210 and 215 nm. Discrimination between different groups of the protein as well as differentiation between DNA and protein contributions is achieved through the use of these two excitation wavelengths. Although many of the same bands are observed in the 210 nm and 215 nm-excited spectra, because of the resonance enhancement effect the 210 nm spectra are used primarily to detect changes in HU secondary structure through the backbone amide modes and the 215 nm-excited spectra reveal changes in DNA conformation and the relative intensities of Phe and Pro bands.
Table 1.
Duplexes used for UV resonance Raman experiments
| Duplex | Sequence | Complex stoichiometry | Binding affinity (μM−1) |
| A4-20 | 5′-CAAAATTTTGGAAAATTTTC-3′ | HU:A4–20a | 6.1 ± 1.4a |
| 3′-GTTTTAAAACCTTTTAAAAG-5′ | |||
| T4-20 | 5′-CTTTTAAAAGGTTTTAAAAC-3′ | HU2:T4–20a | 4.4 ± 1.6a |
| 3′-GAAAATTTTCCAAAATTTTG-5′ | K1 = 2k = 8.8 | ||
| K2 = k/2 = 2.2 | |||
| H1-13 | 5′-ATCAACTACCTTA-3′ | HU2:H1–13b | 0.53 ± 0.14b |
| 3′-TAGTTGATGGAAT-5′ | K1 = 2k = 1.1 | ||
| K2 = k/2 = 0.27 |
a Determined from fluorescence anisotropy (Wojtuszewski and Mukerji 2003).
b Determined from fluorescence anisotropy and analytical ultracentrifugation (Wojtuszewski et al. 2001).
The spectral changes that result upon complex formation are examined relative to the individual protein and DNA components as well as the spectra of the added components, in which the spectra of free protein and free DNA are added together in the same ratio used to form the complexes. The data are normalized against a buffer band occurring at 602 cm−1. Representative component spectra, complex, and added spectra are shown in Figure 2 ▶ for the HU:A4–20 complex.
Figure 2.
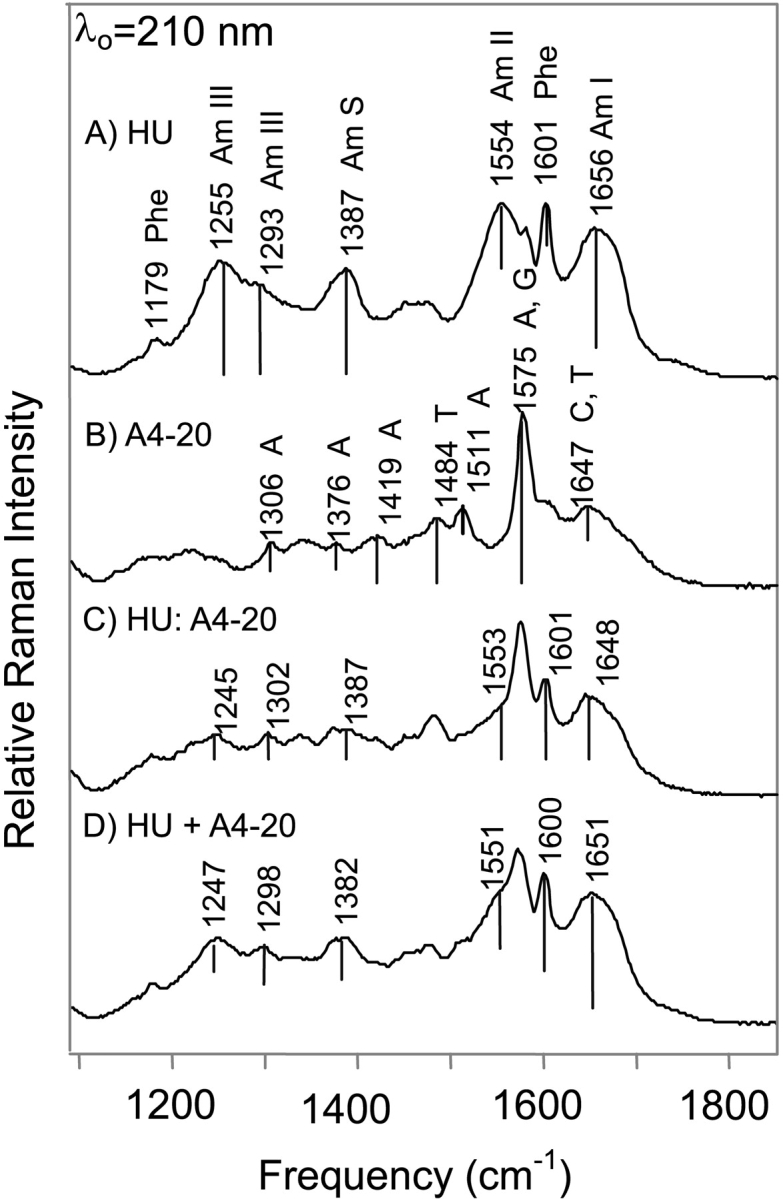
Illustration of the method used to generate the spectral comparisons. All spectra shown are excited with an excitation wavelength of 210 nm. (A) HU only spectrum obtained at a protein concentration of 0.14 mM. The resonance-enhanced amide I, II, III, and S modes are indicated. (B) A4–20 only spectrum obtained at a concentration of 0.15 mM. (C) HU:A4–20 complex spectrum in which the concentration of HU is 0.14 mM and the concentration of A4–20 is 0.127 mM. (D) Added spectrum of HU and A4–20 using the spectra shown in (A) and (B). Spectra were normalized to a buffer band at 602 cm−1 and then multiplied by the appropriate factors to match the concentrations used to obtain the complex spectra shown in (C). All of the samples were in a 10 mM Tris buffer at pH 7.6 containing 0.1 mM EDTA and 100 mM NaCl.
Changes in HU secondary structure upon complex formation
HU protein
As shown in Figure 3 ▶, an excitation wavelength of 210 nm was used to specifically enhance the contribution of the amide vibrational modes arising from the peptide backbone. The frequencies of the amide I and amide III modes are diagnostic of protein secondary structure, while the intensities of the amide II (1550–1555 cm−1) and amide S (1390 cm−1) modes correlate linearly with protein α-helical content (Table 2; Harada and Takeuchi 1986; Wang et al. 1991; Austin et al. 1993; Chi et al. 1998). Because amide I consists mainly of C=O stretching vibrations and amide III arises from C—N stretching and N—H bending vibrations, coordinated frequency shifts of these modes are not expected (Harada and Takeuchi 1986; Austin et al. 1993). In HU the amide I and amide III modes have strong peaks occurring at 1656 and 1252 cm−1, indicative of an unordered secondary structure (Harada and Takeuchi 1986; Wang et al. 1991; Chi et al. 1998). In addition to the unordered regions, shoulders at 1293 and 1647 cm−1 indicate the presence of significant α-helical content and a shoulder at 1676 cm−1 is observed consistent with the presence of β-sheet secondary structure (Harada and Takeuchi 1986; Wang et al. 1991; Austin et al. 1993; Chi et al. 1998).
Figure 3.

210 nm-excited spectra of the HU–DNA complexes. (A) Spectral range from 1125 to 1430 cm−1. (B) Spectral range from 1500 to 1760 cm−1. Mode assignments are discussed in the text and are given in Table 2. (1) HU-only spectrum; (2) HU:A4–20 spectrum obtained under the same conditions as in Figure 2 ▶; (3) HU2:T4–20 spectrum obtained with a protein concentration of 0.14 mM and a DNA concentration of 0.132 mM; (4) HU2:H1–13 spectrum obtained with a protein concentration of 0.13 mM and a DNA concentration of 0.112 mM. Buffer conditions were the same as in Figure 2 ▶ except that 50 mM NaCl was used for the HU2:H1–13 complex.
Table 2.
List and assignment of Raman vibrational modes with 210 nm excitation
| HU ν (cm−1) | HU:A4–20 ν (cm−1) | HU2:T4–20 ν (cm−1) | HU2:H1–13 ν (cm−1) | Assignment |
| 1179 | 1179 | 1179 | 1179 | F9a, Phea |
| 1255 | 1245 | 1247 | 1250 | Amide IIIa |
| 1293 | 1302 | 1304 | 1304 | Amide III, α-helixa |
| 1387 | 1387 | 1390 | 1389 | Amide Sa |
| 1484 | 1482 | 1480 | Ab | |
| 1555 | 1553 | 1553 | 1551 | Amide IIa |
| 1578 | 1578 | 1578 | A, Gc and Phe F8ba | |
| 1582 | F8b, Phea | |||
| 1601 | 1601 | 1601 | 1601 | F8a, Phea |
| 1656 | 1648 | 1649 | 1653 | Amide Ia |
| 1674 | 1675 | 1676 | 1673 | Amide Ia |
Data shown in Figures 2 ▶ and 3 ▶.
a Assignments taken from Austin et al. (1993) and other references as noted in the text.
b Assignments taken from Fodor et al. (1985) and other references as noted in the text.
HU:A4–20 and HU2:T4–20 complexes
In the HU:A4–20 and HU2:T4–20 complex spectra, the amide I mode shifts from 1656 to 1649 cm−1 (Fig. 3B ▶). This frequency downshift of amide I is attributed to both an increase in α-helical content and a strengthening of the α-helical H-bonds (Austin et al. 1993; Chi et al. 1998). In both the A4–20 and the T4–20 complexes, amide III exhibits two distinct peaks: at 1302 and 1247 cm−1 (Table 2). The peak observed at 1302 cm−1 arises from α-helical secondary structure; the upshift in frequency with respect to free HU (1293 to 1302 cm−1) is consistent with the downshift in amide I frequency. In the case of the HU:A4–20 and HU2:T4–20 complexes, the intensities of the amide II and S modes at 1550 and 1387 cm−1 are reduced by 10% to 20% relative to the added parent spectra, consistent with an increase in helical structure upon complexation (Fig. 4 ▶) (Wang et al. 1991).
Figure 4.

Relative Raman intensities of amide II and amide S modes. Amide II relative intensities are shown in the solid gray columns and amide S in the hatched columns. The intensity ratios of the complex spectra relative to the spectra of the added components are depicted. All intensities were measured relative to a buffer band at 602 cm−1. Original spectra are shown in Figure 3 ▶.
In the A4–20 and T4–20 complex spectra, a shoulder is observed on the main amide I band at 1676 cm−1, which is attributed to the presence of β-sheet. Amide I frequencies corresponding to β-sheet secondary structure typically occur in the frequency range from 1665 to 1680 cm−1 (Austin et al. 1993; Chi et al. 1998). Similarly, the main amide III mode occurring at 1255 cm−1 in free HU shifts -8 cm−1 to 1247 cm−1 in the HU:A4–20 and the HU2:T4–20 complex spectra and this shift results from an increase in β-sheet content and a loss of unordered structure (Fig. 3 ▶).
HU2:H1–13 complex
Interestingly, in the HU2:H1–13 complex spectra the amide I frequency shift is only -3 cm−1 (Fig. 3 ▶). Similarly, a -5 cm−1 shift is observed for the amide III mode (1255 → 1250 cm−1) in the H1–13 complex, which contrasts with the 8–10 cm−1 shift observed for the other complexes (Table 2). In the HU2:H1–13 complex the intensity of the amide II and amide S modes are increased relative to the added spectra (Fig. 4 ▶).
Phe mode intensity probes local environment
HU protein
In the free protein, vibrational modes corresponding to Phe residues are observed at 1601, 1581, 1179, and 1003 cm−1 (Table 3). Although observable with a 210 nm excitation wavelength, these modes are strongly enhanced using 215 nm excitation (data not shown; Sokolov and Mukerji 2000). Previously, it has been demonstrated that the intensities of these modes scale with the relative hydrophobicity of the local environment. The 1601 cm−1 mode intensity, which is a symmetrical C—C stretching mode of the phenyl ring (F8a), has the steepest dependence on local environment (Hildebrandt et al. 1988; Sokolov and Mukerji 2000). In this study the 1601 and 1179 cm−1 vibrational modes are used as an indicator of the local environment of Phe residues in HU. The relatively intense F8b mode at 1580 cm−1 is not used for this comparison because of the considerable intensity contribution from a DNA ring-stretching mode.
Table 3.
List and assignment of Raman vibrational modes with 215 nm excitation
| HU ν (cm−1) | HU:A4–20 ν (cm−1) | HU2:T4–20 ν (cm−1) | HU2:HU1–13 ν (cm−1) | Assignment |
| 1179 | 1179 | 1179 | 1179 | F9a, Phea |
| 1215 | Gb | |||
| 1255 | 1247 | 1247 | 1249 | Amide IIIa |
| 1293 | 1301 | 1300 | 1302 | Amide III, α-helixa |
| 1309 | 1308 | Ab | ||
| 1337 | 1340 | 1337 | Ab | |
| 1374 | 1376 | 1376 | Ab | |
| 1387 | 1393 | 1395 | 1395 | Amide Sa |
| 1415 | 1415 | 1419 | A, Gb | |
| 1453 | 1455 | 1455 | 1453 | X-Pro, imide IIa |
| 1480 | X-Pro, imide IIa | |||
| 1484 | 1482 | 1480 | Ab | |
| 1578 | 1578 | 1578 | A, Gb and Phe F8ba | |
| 1582 | Phe F8ba | |||
| 1601 | 1601 | 1601 | 1601 | Phe F8ab |
| 1646 | 1647 | T, C C=Ob | ||
| 1676 | 1676 | G C=Ob | ||
| 1710 | 1713 | T C2=Ob |
Data shown in Figure 5 ▶.
a Assignments taken from Austin et al. (1993) and other references as noted in the text.
b Assignments taken from Fodor et al. (1985) and other references as noted in the text.
HU:A4–20 and HU2:T4–20 complexes
The 215 nm-excited complex spectra (Fig. 5 ▶) specifically investigate the local environment of Phe and Pro residues, because of the resonance enhancement effect (Hildebrandt et al. 1988; Austin et al. 1993; Jordan et al. 1996; Sokolov and Mukerji 2000). For the A4–20 and T4–20 complexes a reduction in intensity of all Phe modes is observed relative to the added parent spectra. Phe modes at 1601 and 1179 cm−1 exhibit a maximum intensity decrease of 30% upon complexation (Fig. 6 ▶).
Figure 5.

215 nm-excited spectra of the HU–DNA complexes. (A) Spectra from 1775 to 1425 cm−1. Mode assignments are discussed in the text and are given in Table 3. Top: HU:A4–20; Middle: HU2:T4–20; Bottom: HU2:H1–13. Complexes prepared as in Figure 3 ▶. Buffer conditions were the same as in Figure 2 ▶ except that 50 mM NaCl was used for the HU2:H1–13 complex. (B) Spectral range: 1450–1100 cm−1. Top: HU:A4–20; Middle: HU2:T4–20; Bottom: HU2:H1–13.
Figure 6.

Relative Raman intensities of Phe modes at 1179 and 1601 cm−1. Relative intensities of 1179 cm−1 mode are shown in the hatched columns and 1601 cm−1 in the solid gray columns. The intensity ratios of the complex spectra relative to the spectra of the added components are depicted. All intensities shown represent an average of at least two different data sets and were measured relative to a buffer band at 602 cm−1. Original spectra are shown in Figure 5 ▶.
HU2:H1–13 complex
In the HU2:H1–13 complex, the intensities of Phe modes at 1601 and 1179 cm−1 increase by more than 40% upon complex formation (Fig. 6 ▶). This intensity increase is in striking contrast to the intensity decrease observed for the A4–20 and T4–20 complexes.
Pro mode intensity a measure of intercalation into the DNA
HU protein
Vibrational modes corresponding to Pro residues are observed at 1455 and 1480 cm−1. The frequency of the imide II Pro mode is sensitive to H-bond donation at the X-Pro carbonyl. Because this vibrational mode primarily arises from C—N bond stretching similar to amide II, stronger H-bonding leads to higher imide II frequencies because of increased electron density on the C—N bond (Takeuchi and Harada 1990; Jordan et al. 1996). The E. coli HU protein has only two Pro residues per subunit located at positions 63 and 77. The higher frequency shoulder, which corresponds to Pro residues with stronger H-bonding, most probably arises from the Pro residues located at α77 and β77 in the “saddle” region of the protein (Fig. 1 ▶). Because the β-ribbon arms are mobile and relatively unordered the backbone carbonyl moieties of the α63 and β63 Pro residues are probably H-bonded to solvent in the absence of DNA and are assigned to the peak occurring at 1455 cm−1.
HU:A4–20 and HU2:T4–20 complexes
HU binding to the A4–20 and T4–20 duplexes leads to an ~30% reduction in Pro mode intensity at 1455 cm−1 relative to the added spectra (Fig. 7 ▶). This decrease in Pro intensity is attributed to intercalation of the α63 and β63 Pro residues in between DNA bases. The reduction in Pro mode intensity is approximately the same in the two complexes, suggesting that the degree of intercalation for the complexes is the same. The intensity of the Pro mode at 1480 cm−1 is not monitored in the complex spectra because of interference from the relatively intense DNA band occurring at ~1485 cm−1 (Table 3).
Figure 7.

Relative Raman intensity of Pro mode at 1455 cm−1. The intensity ratios of the complex spectra relative to the spectra of the added components are depicted. All intensities shown represent an average of at least two different data sets and were measured relative to a buffer band at 602 cm−1. Original spectra are shown in Figure 5 ▶.
HU2:H1–13 complex
In the complex formed with the H1–13 duplex, Pro mode intensity is increased by almost 20% (Fig. 7 ▶). This is in striking contrast to the intensity reduction observed for the A4–20 and T4–20 complexes. The increased intensity of the Pro modes observed for the H1–13 complex indicates that α63 and β63 Pro residues remain relatively solvent exposed in this complex and are not intercalating into the DNA.
DNA structural changes upon complex formation
Structural changes of the DNA molecules are detected in the 215 nm spectra shown in Figure 5 ▶. Many of these features are also observed with an excitation wavelength of 210 nm; however, with 215 nm, the DNA features are easier to detect because of the reduced intensity contributions from the protein amide modes.
HU:A4–20 and HU2:T4–20: Changes in DNA backbone conformation
For the complexes formed with the A4–20 and T4–20 duplexes, a large peak at 1578 cm−1 is observed, which has contributions from Phe and adenine residues (Table 3). The dA bands occurring at 1578 and 1485 cm−1 arise primarily from C5 = C4 and C4—N3 ring stretching motions (Fodor et al. 1985) and become more defined relative to the added spectrum (Figs. 2 ▶, 5A ▶). This relative increase in intensity upon complexation is suggestive of bases unstacking. Backbone ribosyl modes associated with dA residues are broader in the complex because of increased intensity at 1407 and 1308 cm−1, frequencies that are characteristic of the A-form (Fig. 5B ▶; Toyama et al. 1993; Peticolas 1995). A peak is also observed at 1337 cm−1 (1343 cm−1 in the T4–20 complex), which is indicative of the C2′-sendo conformation and B-form DNA (Thomas and Tsuboi 1993; Peticolas 1995). The broadness of the peaks indicates that the duplex molecules adopt a mixture of A and B conformations in the complexes.
HU:A4–20 and HU2:T4–20 complexes: The minor groove
Other features observable in the complex spectra (Fig. 5A ▶) that can be assigned to the DNA occur in the high frequency region of the spectrum (1650–1750 cm−1). These features observed at 1646, 1676, and 1710 cm−1 arise from the exocyclic carbonyl modes of the dC, dG, and dT residues (Fodor and Spiro 1986; Grygon and Spiro 1990). The 1646 cm−1 mode arises from the dT C4 = O stretching vibration and dC C2 = O stretching vibration (Fodor et al. 1985; Fodor and Spiro 1986; Mukerji and Williams 2002). The 1676 cm−1 mode is assigned to the dG C6 = O stretching vibration (Fodor and Spiro 1986; Mukerji et al. 1996). The 1711 cm−1 mode, although weak, has been shown to arise from the dT C2 = O stretching vibration, and this mode is preferentially enhanced with 215 nm excitation (Grygon and Spiro 1990; Toyama et al. 1991; Tsuboi et al. 1997; Zhang et al. 1998). The observation of these shoulders is consistent with an increase in intensity of these modes and a shift to higher frequency upon complexation. These intensity increases and frequency upshifts arise from a decrease in base stacking interactions and a reduction in H-bonding strength, which potentially results from a significant distortion of the DNA helix and a disruption of base pair H-bonding.
Of most interest is the observation of shoulders corresponding to the dC C2 = O and dT C2 = O stretching vibrations at 1647 and 1711 cm−1 (Fig. 5A ▶; Fodor and Spiro 1986; Grygon and Spiro 1990; Tsuboi et al. 1997). These groups are located in the minor groove and the intensity increase of the associated vibrational modes suggests that the minor groove opens or widens upon complexation, leading to increased H-bonding with the solvent.
HU2:H1–13 complex: No evidence for DNA distortion
Interestingly, many of the structural features indicating a distortion of the DNA are not detected in the HU2:H1–13 complex spectrum, which is dominated by Phe modes (Fig. 5 ▶). Some smaller features associated with the DNA can be detected; in particular, the spectral features at 1308, 1337, and 1415 cm−1 suggestive of a mixture of A- and B- form DNA are observable, as well as the strong features at 1484 and 1579 cm−1 indicative of base unstacking (Table 3; Thomas and Tsuboi 1993; Peticolas 1995; Thomas 1999). In the 1600–1750 cm−1 region shoulders are observed at 1641 and 1682 cm−1, corresponding to the dT C4 = O and dG C6 = O stretching vibrations (Fig. 5A ▶; Fodor and Spiro 1986; Mukerji et al. 1996; Mukerji and Williams 2002). Strikingly, the dT C2 = O stretching vibration is not observed.
Discussion
Comparison of the complexes: Bent versus linear
Although UVRR spectroscopic results reveal that the three HU–DNA complexes examined share many common features, there are pronounced differences in the structures that can be related to binding affinity and site specificity. In general, the HU:A4–20 and HU2:T4–20 complexes are very similar structurally, despite the difference in HU binding stoichiometry; yet, these complexes share only a few structural features with the HU2:H1–13 complex.
Determination of secondary structure content of free HU by UVRR is consistent with the known structure of HU as determined from X-ray crystallography (Tanaka et al. 1984; White et al. 1989, 1999), NMR (Vis et al. 1995), and Raman (Serban et al. 2003a) methods, which indicate that the α-helical core of the protein is well folded, but the β-ribbon arms are relatively unordered and mobile in the absence of DNA. In the HU:A4–20 and HU2:T4–20 complexes, however, HU exhibits a greater amount of helical content upon binding DNA and the DNA spectral bands indicative of distortion and minor groove opening are comparable in intensity and frequency, suggesting that HU interacts with these two duplexes in a similar manner to yield a bent complex. These results are in good agreement with FRET measurements that had previously determined HU binding to either the A4–20 or T4–20 duplex led to a very similar bend angle, 70° and 62°, respectively (Wojtuszewski and Mukerji 2003).
In the current study the observed opening of the minor groove is consistent with an interaction between the protein β-arms and the minor groove as observed in the crystal structure of Anabena HU bound to DNA (Swinger et al. 2003; Fig. 1 ▶). This structural feature appears to be an important element of binding and recognition, as has been previously suggested by X-ray crystallography (Swinger et al. 2003) and Raman (Serban et al. 2003b) studies.
By contrast, the UVRR spectral features of the HU2:H1–13 complex are attributed to a different and low affinity protein binding interaction. In this complex, smaller frequency shifts are observed for both amide I and III and spectral features indicative of an increase in α-helical content and Pro intercalation are reduced relative to the other complexes. These observations suggest that the α-helical secondary structure is less rigid and forms weaker H-bonds in the HU2:H1–13 complex. The lack of observable C=O bands at high frequency and less intense DNA ring-stretching modes argues against a significant amount of minor groove opening and DNA distortion in this complex, consistent with previous fluorescence measurements (Wojtuszewski et al. 2001).
All three complexes exhibit UVRR spectral signatures of A- and B-form DNA, suggesting that protein binding modifies DNA conformation. This finding is consistent with a previous Raman study of Bacillus stearothermophilus HU binding to two different DNA dodecamers, in which a mixture of A- and B-form DNA was observed as well as the unstacking of the purine bases (Serban et al. 2003b). Similarly, a twist of 31°/bp was also observed in the Anabena HU-DNA cocrystal structure, indicating that the DNA is underwound with respect to canonical B-form DNA and is closer to that of the A-form conformation (Swinger et al. 2003).
Pro intercalation and induced bending
Pro vibrational modes in the A4–20 and T4–20 complexes decrease in intensity upon complex formation. E. coli HU only has two Pro residues per subunit located at positions 63 and 77, in contrast to B. stearothermophilus HU and Anabena HU, which have six and eight Pro residues, respectively. The Pro residues in E. coli HU are highly conserved, and are also found in Anabena HU and IHF (Rice 1997). In the X-ray crystal structures Pro 63 was observed to intercalate and stack with DNA base pairs to induce bending (Rice et al. 1996; Swinger et al. 2003). Therefore, the reduction in Pro intensity is attributed to the intercalation of Pro residues (α63 and β63) into the DNA, potentially between TT bases, as detected in the IHF cocrystal structure (Fig. 8 ▶).
Figure 8.

Pro intercalation and stacking interactions in HU–DNA and IHF–DNA cocrystal structures. (Left) Stacking interaction between Pro 63 and T5 in the HU–DNA cocrystal structure (Swinger et al. 2003). (Right) Pro 65 intercalation and stacking interaction between two thymine residues (T37 and T38) in the IHF–DNA cocrystal structure (Rice et al. 1996). Diagram was generated using Weblab Viewer Pro 3.7 and X-ray crystallographic coordinates of Rice et al. (1996; Swinger et al. 2003), pdbid: 1P51 and 1IHF.
The relative intensities of the Pro modes in the HU:A4–20 and HU2:T4–20 complexes are approximately the same, consistent with the similarity of the induced bend angle (25°/HU dimer; Wojtuszewski and Mukerji 2003). The cocrystal structures of IHF and HU are suggestive that Pro intercalation leads to a kinking of the DNA rather than a smooth bend, which may lead to a more dramatic bend angle than previously reported. Regardless of the nature of the induced bend, UVRR results are consistent with the induced bending arising from an intercalation of Pro residues into the DNA and an equivalent amount of intercalation in the A4–20 and T4–20 complexes. In other instances of HU binding to DNA substrates with high affinity and a 1:1 protein-to-DNA ratio, bending of the DNA was inferred from footprinting experiments (Lavoie et al. 1996; Aki and Adhya 1997; Kamashev et al. 1999). Similarly, crystals were only observed when HU was bound to distorted DNA containing mismatched and unpaired thymines, suggesting that a bent or distorted DNA facilitated formation of an ordered crystal (Swinger et al. 2003). Thus, these findings coupled with our results suggest that Pro intercalation and protein-induced DNA bending is an essential element of the site-specific interactions observed for HU dimers.
In contrast to the bent complexes, the Pro vibrational mode intensity in the “linear” HU2:H1–13 complex is increased relative to that obtained for the added components, indicating that there is no intercalation of Pro residues. The lack of intercalation is consistent with the absence of induced bending detected for this complex by fluorescence spectroscopy (Wojtuszewski et al. 2001). These findings suggest that the relatively low affinity and non-site-specific HU2:H1–13 complex is structurally distinct from either the HU:A4–20 or HU2:T4–20 complexes. Furthermore, these observations suggest that the relative UVRR intensities of Pro vibrational modes can be used as an indicator of Pro intercalation and induced bending.
Comparison of the complexes: Flexibility of the monomer–monomer interface
By analogy with the structure from B. stearothermophilus HU (White et al. 1999), six Phe residues (47, 50, and 79 from each dimer; see Fig. 1 ▶) form an aromatic cluster that links the top of the α-helical region to the hydrophobic inner surface of the β-sheet region. The intensities of Phe vibrational modes scale linearly with hydrophobicity (Hildebrandt et al. 1988; Sokolov and Mukerji 2000); therefore, the decrease in Phe mode intensity in the A4–20 and T4–20 complexes suggests that the hydrophobic interactions in this cluster become less pronounced as a consequence of the binding interaction. This would be consistent with an opening of the dimeric interface as the protein adapts its conformation to bind and bend the DNA. Recent Raman experiments of B. stearothermophilus HU that monitored deuteration of the amide II mode in the absence of DNA have indicated that the dimer interface is more flexible than previously thought (Serban et al. 2003a).
In contrast, the strongest and most distinctive features of the 215 nm-excited HU2:H1–13 complex spectra arise from the Phe residues, and the observed intensity increase can be attributed to an increase in hydrophobicity of their local environment and potentially an interaction of HU dimers. Analytical ultracentrifugation and fluorescence anisotropy results had previously demonstrated that two HU dimers bind to this duplex (Wojtuszewski et al. 2001). The increase in hydrophobicity, as suggested by the increase in Phe mode intensity, may result from an interaction between the two HU dimers upon binding to the DNA. In this complex the relative proximity and orientation of the HU dimers with respect to the duplex is not known; however, the HU–DNA crystal structure suggests that there should be at least nine bp in between the Pro residues located on the protein β-arms arguing against a linear binding mode (Fig. 1 ▶; Swinger et al. 2003).
UVRR measurements of Phe local environment indicate that the dimer interface adapts to the type of complex formed, where complexes with induced bending have a more open interface than linear complexes, such as the HU2:H1–13 complex, which have a stronger monomer–monomer interaction and tighter interface. The HU2:H1–13 complex is probably more reminiscent of the high protein:DNA ratio complexes observed by Dame and Goosen (Dame and Goosen 2002), which lead to rigidification and elongation of the DNA instead of bending.
Binding affinity and recognition through the C-terminal helix
Collectively, the amide modes, which arise from the peptide backbone, indicate that an increase in secondary structure occurs upon HU complex formation with DNA. A previous study that evaluated the ability of UVRR to determine secondary structure, demonstrated that the frequency and bandwidth of amide III increased with α-helical content (Chi et al. 1998). In the case of the A4–20 and T4–20 complexes, the frequency shifts and intensity increases of the α-helical amide modes are attributed to an increase in H-bonding strength in the body of the protein and an increase in α-helical structure at the C terminus (Wang et al. 1991; Chi et al. 1998). The increase in β-sheet content probably arises from the ordering of the β-arms upon interaction with the DNA as has been observed previously by X-ray crystallography and Raman spectroscopy (Rice et al. 1996; Rice 1997; Serban et al. 2003b; Swinger et al. 2003). Although similar spectral changes are observed for the H1–13 complex, the amide I and amide III peptide backbone modes exhibit smaller frequency shifts, indicating that the relative increase in α-helical secondary structure for this complex is smaller than for the other two complexes. An intensity increase is detected for the amide II and amide S modes, which is attributed to an increase in β-sheet content upon complex formation, because the Raman cross-section of β-sheets is greater than that of α-helices and the maximum absorbance of β-sheets is shifted to a wavelength that is closer to the excitation wavelength of 210 nm (Wang et al. 1991; Austin et al. 1993). The intensity increase observed for the HU2:H1–13 complex as opposed to the intensity decrease observed for the HU:A4–20 and HU2:T4–20 complexes further confirms that these complexes and not the HU2:H1–13 complex experiences an increase in α-helical content upon complexation.
The start of the C-terminal helix differs in the NMR solution (Vis et al. 1995) and X-ray crystallographic structures (White et al. 1999) of the protein and this region may be a source of protein flexibility, as are the β-arms. We attribute the increase in α-helicity of the A4–20 and T4–20 complexes to this region of the protein and speculate that contact between the helix and the DNA facilitates specific binding interactions. The length of the T4–20 and A4–20 duplexes coupled with the induced bending allows them to interact with this region of the protein. In the case of the H1–13 duplex, the shorter 13 bp duplex and the absence of bending prohibits this interaction.
Recognition through this region of the protein stems from a consideration of other members of the HU-like family of proteins, TF1 and IHF. Both of these proteins have longer C-terminal helices than HU and they bind with nanomolar affinity to specific recognition sites (White et al. 1989; Rice 1997). Modification of this region in IHF, either by substitution (Mengeritsky et al. 1993) or deletion (Zulianello et al. 1995) leads to altered binding specificity and affinity. In addition, the IHF and HU cocrystal structures reveal that the DNA interacts with this region of the protein (Rice et al. 1996; Swinger et al. 2003). In the case of the HU–DNA crystal structure, the interaction occurs with another 17 bp DNA duplex in the crystal unit (Fig. 1 ▶); however, it is expected that this favorable interaction could occur within one molecule with a longer DNA duplex (Swinger et al. 2003). Thus, the higher binding affinity and reduced protein to DNA stoichiometry observed for the A4–20 duplex is attributed to the formation and interaction of this helix with the DNA and supports the notion that this helix plays an important role in binding and recognition.
In summary, UVRR results indicate that the HU2:H1–13 complex is distinct from the complexes formed with either the A4–20 duplex or the T4–20 duplex and leads to identification of some structural elements that potentially lead to higher affinity and 1:1 binding stoichiometries. From the spectral comparison of these complexes and the observed differences in binding affinity (5 μM−1 versus 0.5 μM−1: Table 1), we propose that induced bending as a consequence of Pro intercalation is a significant element in the HU binding interaction and plays a role in specificity. Bending and untwisting of the DNA leads to interactions with the protein C-terminal helix, which becomes more pronounced in the complex, and these contacts also influence binding and recognition. The non-site-specific interaction, as characterized by the HU2:H1–13 complex, exhibits greater flexibility in protein structure, stronger monomer–monomer interactions, as evidenced by a tighter hydrophobic core, and little bending or distortion of DNA. Further experiments on discontinuous DNA substrates that form high affinity complexes with HU will help to elucidate the structural elements of specificity in the HU–DNA binding interaction and are currently underway in our laboratory.
Materials and methods
HU protein
HU protein was isolated from E. coli strain, RLM1078, and purified according to the procedure previously described (Wojtuszewski et al. 2001). The amount of protein used in formation of the HU–DNA complexes for the UVRR experiments was determined based on previously determined binding constants (Wojtuszewski et al. 2001; Wojtuszewski and Mukerji 2003). The concentrations of HU and DNA were chosen such that less than 1% of the total amount of DNA was free. All experiments were conducted in a 10 mM Tris buffer at pH 7.6 containing 0.1 mM EDTA. A4–20 and T4–20 duplexes and complexes were examined in the presence of 100 mM NaCl, while the H1–13 duplex and complex was examined in the presence of 50 mM NaCl. In instances where Na2SO4 was used instead of NaCl, 50 mM Na2SO4 was used with the A4–20 and T4–20 duplexes and complexes and 25 mM Na2SO4 was used with the H1–13 duplex and complex.
Oligonucleotides
Oligonucleotides were purified by UV-shadowing and electro-eluted from the gel (Schleicher and Schuell). Duplex formation was achieved by mixing equal molar amounts of the pure single stranded oligonucleotides, heating at 90°C for 5 min followed by slow cooling to room temperature in a water bath at a rate of approximately 0.2°/min. Concentrations of single strand oligo-nucleotides were determined by measuring the absorbance at 260 nm at 90°C. Extinction coefficients were calculated using the methodology of Richards (1975).
UVRR spectroscopy
The UVRR spectrometer has been previously described (Sokolov and Mukerji 2000; Mukerji and Williams 2002). Absolute frequencies are accurate to ±1 cm−1 and relative shifts are accurate to ±0.25 cm−1. HU protein, DNA, and complex samples were continuously stirred in a 3 × 3-mm Spectrosil quartz cuvette (Starna Cells, Inc.) with a sample volume of 80 μL and cooled with a circulating water bath to approximately 6 ± 2°C.
Each sample was acquired for four 15-min cycles in 1 h. A total of 3 h of data for each sample were collected. When applicable, the data were normalized to a factor of unity using the symmetric stretching mode of SO42− occurring at 981 cm−1. For intensity comparisons, data were normalized to a buffer band at 602 cm−1. Intensity comparisons made with either the SO42− or the 602 cm−1 buffer band yielded the same result. For comparisons between complex and added spectra, spectral addition was accomplished using the buffer as intensity standard and correcting for any concentration differences in the complex spectra relative to the component spectra. Data manipulation and analysis were done using Grams/32 and Grams/AI (Galactic Industries).
Acknowledgments
This work was supported by a National Science Foundation Career Development Award (MCB-9507241) and a grant from the Patrick and Catherine Weldon Donaghue Medical Research Foundation. K.W. gratefully acknowledges support from an NIH training grant in Molecular Biophysics (GM08271). We are grateful to Prof. Roger McMacken for the gift of the HU overexpressing E. coli strain RLM1078, and we also thank Phoebe Rice for sharing her results on the Anabena HU–DNA complex prior to publication.
The publication costs of this article were defrayed in part by payment of page charges. This article must therefore be hereby marked “advertisement” in accordance with 18 USC section 1734 solely to indicate this fact.
Abbreviations
bp, base pair
IHF, integration host factor
FRET, fluorescence resonance energy transfer
UVRR, UV resonance Raman spectroscopy.
Article and publication are at http://www.proteinscience.org/cgi/doi/10.1110/ps.04730204.
References
- Aki, T. and Adhya, S. 1997. Repressor induced site-specific binding of HU for transcriptional regulation. EMBO J. 16 3666–3674. [DOI] [PMC free article] [PubMed] [Google Scholar]
- Austin, J.C., Jordan, T., and Spiro, T.G. 1993. Ultraviolet resonance Raman studies of proteins and related model compounds. In Biomolecular spectroscopy (eds. R.J.H. Clark and R.E. Hester), pp. 55–127. John Wiley and Sons, Ltd., New York.
- Burkhoff, A.M. and Tullius, T.D. 1988. Structural details of an adenine tract that does not cause DNA to bend. Nature 331 455–457. [DOI] [PubMed] [Google Scholar]
- Castaing, B., Zelwer, C., Laval, J., and Boiteux, S. 1995. HU protein of Escherichia coli binds specifically to DNA that contains single-strand breaks or gaps. J. Biol. Chem. 270 10291–10296. [DOI] [PubMed] [Google Scholar]
- Chi, Z., Chen, X.G., Holtz, J.S.W., and Asher, S.A. 1998. UV resonance Raman-selective amide vibrational enhancement: Quantitative methodology for determining protein secondary structure. Biochemistry 37 2854–2864. [DOI] [PubMed] [Google Scholar]
- Dame, R.T. and Goosen, N. 2002. HU: Promoting or counteracting DNA compaction? FEBS Lett. 529 151–156. [DOI] [PubMed] [Google Scholar]
- Drlica, K. and Rouviere-Yaniv, J. 1987. Histonelike proteins of bacteria. Microbiol. Rev. 51 301–319. [DOI] [PMC free article] [PubMed] [Google Scholar]
- Fodor, S.P.A. and Spiro, T.G. 1986. Ultraviolet resonance Raman spectroscopy of DNA with 200–266-nm laser excitation. J. Am. Chem. Soc. 108 3198–3205. [Google Scholar]
- Fodor, S.P.A., Rava, R.P., Hays, T.R., and Spiro, T.G. 1985. Ultraviolet resonance Raman spectroscopy of the nucleotides with 266-, 240-, 218-, and 200-nm pulsed laser excitation. J. Am. Chem. Soc. 107 1520–1529. [Google Scholar]
- Grygon, C.A. and Spiro, T.G. 1990. UV resonance Raman spectroscopy of nucleic acid duplexes containing A–U and A–T base pairs. Biopolymers 29 707–715. [Google Scholar]
- Hagerman, P.J. 1986. Sequence-directed curvature of DNA. Nature 321 449–450. [DOI] [PubMed] [Google Scholar]
- Harada, I. and Takeuchi, H. 1986. Raman and ultraviolet resonance Raman spectra of proteins and related compounds. In Spectroscopy of biological systems (eds. R.J.H. Clark and R.E. Hester), pp. 113–175. Wiley, New York.
- Haran, T.E. and Crothers, D.M. 1989. Cooperativity in A-tract structure and bending properties of composite TnAn blocks. Biochemistry 28 2763–2767. [DOI] [PubMed] [Google Scholar]
- Hildebrandt, P.G., Copeland, R.A., Spiro, T.G., Otlewski, J., Laskowski Jr., M., and Prendergast, F.G. 1988. Tyrosine hydrogen-bonding and environmental effects in proteins probed by ultraviolet resonance Raman spectroscopy. Biochemistry 27 5426–5433. [DOI] [PubMed] [Google Scholar]
- Jordan, T., Mukerji, I., Wang, Y., and Spiro, T.G. 1996. UV resonance Raman spectroscopy of the proline peptide bond. J. Mol. Struct 379 51–64. [Google Scholar]
- Kamashev, D. and Rouviere-Yaniv, J. 2000. The histone-like protein HU binds specifically to DNA recombination and repair intermediates. EMBO J. 19 6527–6535. [DOI] [PMC free article] [PubMed] [Google Scholar]
- Kamashev, D., Balandina, A., and Rouviere-Yaniv, J. 1999. The binding motif recognized by HU on both nicked and cruciform DNA. EMBO J. 18 5434–5444. [DOI] [PMC free article] [PubMed] [Google Scholar]
- Kobryn, K., Lavoie, B.D., and Chaconas, G. 1999. Supercoiling-dependent site-specific binding of HU to naked Mu DNA. J. Mol. Biol. 289 777–784. [DOI] [PubMed] [Google Scholar]
- Lavoie, B.D. and Chaconas, G. 1993. Site-specific HU binding in the Mu transpososome: Conversion of a sequence-independent DNA-binding protein into a chemical nuclease. Genes & Dev. 7 2510–2519. [DOI] [PubMed] [Google Scholar]
- Lavoie, B.D., Shaw, G.S., Millner, A., and Chaconas, G. 1996. Anatomy of a flexer–DNA complex inside a higher-order transposition intermediate. Cell 85 761–771. [DOI] [PubMed] [Google Scholar]
- Lia, G., Bensimon, D., Croquette, V., Allemand, J.F., Dunlap, D., Lewis, D.E., Adhya, S., and Finzi, L. 2003. Supercoiling and denaturation in Gal repressor/heat unstable nucleoid protein (HU)-mediated DNA looping. Proc. Natl. Acad. Sci. 100 11373–11377. [DOI] [PMC free article] [PubMed] [Google Scholar]
- Mengeritsky, G., Goldenberg, D., Mendelson, I., Giladi, H., and Oppenheim, A.B. 1993. Genetic and biochemical analysis of the Integration Host Factor of Escherichia coli. J. Mol. Biol. 231 646–657. [DOI] [PubMed] [Google Scholar]
- Mukerji, I. and Williams, A.P. 2002. UV resonance Raman and circular dichroism studies of a DNA duplex containing an A3T3 tract: Evidence for a premelting transition and three-centered H-bonds. Biochemistry 41 69–77. [DOI] [PubMed] [Google Scholar]
- Mukerji, I., Shiber, M.C., Spiro, T.G., and Fresco, J.R. 1995. A UV resonance Raman study of d(A(+)-G)10, a single-stranded helix without stacked or paired bases. Biochemistry 34 14300–14303. [DOI] [PubMed] [Google Scholar]
- Mukerji, I., Shiber, M.C., Fresco, J.R., and Spiro, T.G. 1996. A UV resonance Raman study of hairpin dimer helices of d(A–G)10 at neutral pH containing intercalated dA residues and alternating dG tetrads. Nucleic Acids Res. 24 5013–5020. [DOI] [PMC free article] [PubMed] [Google Scholar]
- Mukerji, I., Sokolov, L., and Mihailescu, M.-R. 1998. A UV resonance Raman investigation of poly (rI): Evidence for cation dependent structural perturbations. Biopolymers 46 475–487. [Google Scholar]
- Murphy, F.V. and Churchill, M.E.A. 2000. Nonsequence-specific DNA recognition: A structural perspective. Structure 8 R83–R89. [DOI] [PubMed] [Google Scholar]
- Peticolas, W.L. 1995. Raman spectroscopy of DNA and proteins. Methods Enzymol. 246 389–416. [DOI] [PubMed] [Google Scholar]
- Pinson, V., Takahashi, M., and Rouviere-Yaniv, J. 1999. Differential binding of the Escherichia coli HU, homodimeric forms and heterodimeric form to linear, gapped and cruciform DNA. J. Mol. Biol. 287 485–497. [DOI] [PubMed] [Google Scholar]
- Rice, P.A. 1997. Making DNA do a U-turn: IHF and related proteins. Curr. Opin. Struct. Biol. 7 86–93. [DOI] [PubMed] [Google Scholar]
- Rice, P.A., Yang, S.-w., Mizuuchi, K., and Nash, H.A. 1996. Crystal structure of an IHF-DNA complex: A protein-induced DNA U-turn. Cell 87 1295–1306. [DOI] [PubMed] [Google Scholar]
- Richards, E.G. 1975. Nucleic acids. In Handbook of biochemistry and molecular biology, 3rd ed. (ed. G.D. Fasman). CRC, Cleveland, OH.
- Rouviere-Yaniv, J. and Gros, F. 1975. Characterization of a novel, low-molecular-weight DNA-binding protein from Escherichia coli. Proc. Nat. Acad. Sci. 72 3428–3432. [DOI] [PMC free article] [PubMed] [Google Scholar]
- Serban, D., Arcineigas, S.F., Vorgias, C.E., and Thomas Jr., G.J. 2003a. Structure and dynamics of the DNA-binding protein HU of B. stearothermophilus investigated by Raman and ultraviolet-resonance Raman spectroscopy. Protein Sci. 12 861–870. [DOI] [PMC free article] [PubMed] [Google Scholar]
- Serban, D., Benevides, J.M., and Thomas Jr., G.J. 2003b. HU protein employs similar mechanisms of minor-groove recognition in binding to different B-DNA sites: Demonstration by Raman spectroscopy. Biochemistry 42 7390–7399. [DOI] [PubMed] [Google Scholar]
- Sokolov, L. and Mukerji, I. 2000. Structure of sickle cell hemoglobin fibers probed with UV resonance Raman spectroscopy. J. Phys. Chem. 104 10835–10844. [Google Scholar]
- Sokolov, L., Wojtuszewski, K., Tsukroff, E., and Mukerji, I. 2000. Nucleic acid structure investigated by UV resonance Raman spectroscopy: Protonation effects and A-tract structure. J. Biomol. Struct. Dyn. 327–334. [DOI] [PubMed]
- Swinger, K.K., Lemberg, K.M., Zhang, Y., and Rice, P.A. 2003. Flexible DNA bending in HU–DNA cocrystal structures. EMBO J. 22 3749–3760. [DOI] [PMC free article] [PubMed] [Google Scholar]
- Takeuchi, H. and Harada, I. 1990. Ultraviolet resonance Raman spectroscopy of X-proline bonds: A new marker band of hydrogen bonding at the imide C = O site. J. Raman Spectrosc. 21 509–515. [Google Scholar]
- Tanaka, I., Appelt, K., Dijk, J., White, S.W., and Wilson, K.S. 1984. 3-Å resolution structure of a protein with histone-like properties in prokaryotes. Nature 310 376–381. [DOI] [PubMed] [Google Scholar]
- Thomas Jr., G.J. 1999. Raman spectroscopy of protein and nucleic acid assemblies. Annu. Rev. Biophys. Biomol. Struct. 28 1–27. [DOI] [PubMed] [Google Scholar]
- Thomas Jr., G.J. and Tsuboi, M. 1993. Raman spectroscopy of nucleic acids and their complexes. Adv. Biophys. Chem. 3 1–70. [Google Scholar]
- Toyama, A., Takeuchi, H., and Harada, I. 1991. Ultraviolet resonance Raman spectra of adenine, uracil and thymine derivatives in several solvents. Correlation between band frequencies and hydrogen-bonding states of the nucleic acid bases. J. Mol. Struct. 242 87–98. [Google Scholar]
- Toyama, A., Takino, Y., Takeuchi, H., and Harada, I. 1993. Ultraviolet resonance Raman spectra of ribosyl C(1′)-deuterated purine nucleosides: Evidence of vibrational coupling between purine and ribose rings. J. Am. Chem. Soc. 115 11092–11098. [Google Scholar]
- Travers, A. 1993. DNA–protein interactions: The three-dimensional architecture of DNA–protein complexes. In DNA–protein interactions, pp. 28–51. Chapman & Hall, London.
- Tsuboi, M., Kumakura, A., Aida, M., Kaneko, M., Dupuis, M., Ushizawa, K., and Ueda, T. 1997. Raman scattering tensors in thymine molecule from an ab initio MO calculation. Spectrochim. Acta Part A 53 409–419. [Google Scholar]
- Vis, H., Mariani, M., Vorgias, C.E., Wilson, K.S., Kaptein, R., and Boelens, R. 1995. Solution structure of the HU protein from Bacillus stearothermophilus. J. Mol. Biol. 254 692–703. [DOI] [PubMed] [Google Scholar]
- Wang, Y., Purrello, R., Jordan, T., and Spiro, T.G. 1991. UVRR spectroscopy of the peptide bond. 1. Amide S, a nonhelical structure marker, is a CαH bending mode. J. Am. Chem. Soc. 113 6359–6368. [Google Scholar]
- White, S.W., Appelt, K., Wilson, K.S., and Tanaka, I. 1989. A protein structural motif that bends DNA. Proteins 5 281–288. [DOI] [PubMed] [Google Scholar]
- White, S.W., Wilson, K.S., Appelt, K., and Tanaka, I. 1999. The high-resolution structure of DNA-binding protein HU from B. stearothermophilus. Acta Crystallogr. D 55 801–809. [DOI] [PubMed] [Google Scholar]
- Wojtuszewski, K. and Mukerji, I. 2003. HU binding to bent DNA: A fluorescence anisotropy and resonance energy transfer study. Biochemistry 42 3096–3104. [DOI] [PubMed] [Google Scholar]
- Wojtuszewski, K., Hawkins, M.E., Cole, J.L., and Mukerji, I. 2001. HU binding to DNA: Evidence for multiple complexes and DNA bending. Biochemistry 40 2588–2598. [DOI] [PubMed] [Google Scholar]
- Zhang, S.L., Michaelian, K.H., and Loppnow, G.R. 1998. Vibrational spectra and experimental assignments of thymine and nine of its isotopomers. J. Phys. Chem. A 102 461–470. [Google Scholar]
- Zulianello, L., van Ulsen, P., van de Putte, P., and Goosen, N. 1995. Participation of the flank regions of the Integration Host Factor protein in the specificity and stability of DNA binding. J. Biol. Chem. 270 17902–17907. [DOI] [PubMed] [Google Scholar]